Article by Investazor.com
Chart: XAUUSD, Daily
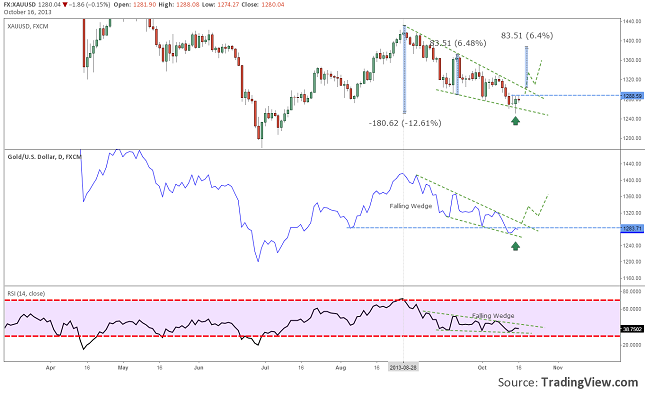
The price of gold started to fall at the end of august. In less than 2 months it touched a low at 1251$ per ounce, marking a loss of 12.6% from the high of this second half of 2013. The down trend seems to have lost its power with every swing low and yesterday the price has drawn a reversal candle, Hammer.
Looking at the form of the down trend on both, candle stick chart and line chart, we can observe that the price has drawn a Falling Wedge. This pattern usually signals a reversal. A breakout through the upper line of the price pattern it would be enough to confirm a rally. The price target of this Wedge sits around 1400 dollar per ounce.
Even though there are bullish signals, traders should wait for a clear confirmation in the price action. If the price will continue to make new lows, than it means that investors have already set their mind and the down trend might continue all the way to 1200$ per ounce.
The post Gold Signaling Reversal, Target 1400$ appeared first on investazor.com.
