Australia holds rate, repeats will adjust to growth, inflation

By www.CentralBankNews.info     Australia’s central bank held its cash rate steady at 2.5 percent, as expected, and repeated that it would “continue to assess the outlook and adjust policy as needed to foster sustainable growth in demand and inflation consistent with the target.”
    The policy guidance was the same as The Reserve Bank of Australia (RBA) gave last month when it cut its rate for the second time this year, indicating that the central bank has adopted a neutral policy stance. In previous months, the RBA had said that it had scope to adjust policy, but this phrase is no longer used.
   The RBA, which has cut rates by 50 basis points this year and by 225 points since October 2011, also repeated last month’s statement that the Australian dollar “remains at a high level” although it has depreciated by around 15 percent since early April and it is “possible that the exchange rate will depreciate further over time, which would help to foster a rebalancing of growth in the economy.”
    The RBA said rate cuts since late 2011 had supported interest-sensitive spending and asset values and further effects can be expected over time. The pace of borrowing has remained relatively subdued, though recently there are signs of increased demand for finance by households.
    The A$, which had been above parity to the U.S. dollar most of the time since early 2011, started to weaken in early May in response to the RBA’s first rate cut and was trading below 0.90 cents to the U.S dollar earlier today, down some 13 percent since the beginning of the year.

    Economic growth in Australia has been hit by a slowdown in China’s imports of raw materials and the RBA said below-trend growth is expected to continue in the near term as the economy adjusts to lower mining investment.
    Australia’s Gross Domestic Product grew by 0.6 percent in the first quarter from the previous quarter for annual growth of 2.5 percent, down from 3.1 percent in the four and third quarters.    Australia’s unemployment rate has also moved higher while inflation remains consistent with the RBA’s target of 2-3 percent.
    “With growth in labour costs moderating, this is expected to remain  the case over the next one to two years, even with the effects of the recent depreciation of the exchange rate,” the RBA said about inflation.

    Australia’s inflation rate was 2.4 percent in second quarter, slightly below the first quarter’s 2.5 percent but up from the fourth quarter’s 2.2 percent.


    www.CentralBankNews.info

Surprise! Stocks Aren’t Guaranteed to Tank in September

By WallStreetDaily.com

It’s officially September in the market – which is notorious for being the worst month for stocks. And, right on cue, every major media outlet is spreading fear.

Everywhere we look, an ominous headline greets us…

“September is a stock market graveyard,” declares The Globe and Mail.

Over at CNBC, we’re told, “Look out! September market headwinds are looming.”

The approach I fancy the most comes from The International Business Times: “Why September is The Worst Month of The Year: Stocks Tank; Banks Fail.” (Please note… just because it’s September doesn’t mean, say… Bank of America (BAC) is about to collapse!)

I could go on and on with the examples. But you get the point. We should be scared stockless right now.

Granted, uncertainties abound – any of which could reasonably sink the market. There’s the worsening situation in Syria, the imminent start of the Fed Taper – and, of course, the never-ending debt ceiling and budget debates in our nation’s capitol.

But all the fears are overblown. In fact, we might actually be in store for a September surprise. Let me explain…

An Undeniable Tendency

I’m not going to deny that September’s terrible reputation is well deserved.

As MarketWatch’s Mark Hulbert reminds us: “Since the Dow was created in 1896, it has lost an average of 1.09% during September. The average return during all other months, in contrast, has been a gain of 0.75%.”

That’s a spread of almost 2%, which is huge, statistically speaking.

Sadly, the track record for the S&P 500 Index in September isn’t any better…

As Guggenheim Partners’ Scott Minerd wrote in a recent note to clients, “Since 1929, the S&P Composite Index has averaged -1.1% for September, making it one of only three months with negative average returns over that time.”

But does that automatically mean stocks are doomed this September, too, and we should bail on the market until October to be safe? Not a chance!

Don’t Be Misled

As Hulbert notes, there’s no “plausible explanation” for why stocks fare so poorly (and consistently) in September. And he’s right. So it could be just a statistical fluke that should be ignored, not feared.

I mean, changing levels of butter production in Bangladesh statistically explain the majority of the moves of the Dow, too. But you don’t hear about anyone using that data point to make investment decisions, do you?

Of course not. Because correlation doesn’t equal causation. And the same truth applies to any month on the calendar. It might correlate to weak or strong returns. But there’s no causation involved.

What’s more, we need to remember that the stats above merely reflect the averages. Not every single September is a downer for stocks. In fact, stocks rose 3.57% in September 2009 and 2.42% in September 2012 (more about this in a moment).

What about those uncertainties I mentioned before, though? Couldn’t they spark a selloff?

It’s not likely. Known risks tend to be priced into the market already. They’re not the real danger.

So what is? I’ll let the infamous words of former Secretary of Defense, Donald Rumsfeld, tell you:

“There are known knowns; there are things we know that we know. There are known unknowns; that is to say, there are things that we now know we don’t know. But there are also unknown unknowns – there are things we do not know we don’t know.”

It’s that last group of unknowns – things we don’t know that we don’t know – that sinks markets.

They’re also known as Black Swan events. And how in the world do you devise an investment strategy to protect against them? You can’t.

The only reliable and rational solution in any market environment is to use trailing stops and stay invested in the market. And that’s especially true this year.

No Reason for Paranoia, Here

While everyone is fretting over the possibility of a September swoon based on over 100 years of data, the number crunchers over at Bespoke Investment Group uncovered an interesting anomaly.

They discovered that during strongly positive years for the market – when the S&P 500 is already up 10% to 25% by September – average returns are actually positive.

Based on 25 occurrences, the S&P 500 averages a gain of 1.29% in September. And it delivers positive returns 68% of the time, according to Bespoke. (That compares to positive returns only 43% of the time during all Septembers.)

Keep in mind that we already witnessed two such occurrences during the current bull market, which I alluded to before…

Heading into September 2009, the market was up 12.9%. Heading into September of last year, the market was up 11.9%. And in both instances, the stock market defied history and rallied during September.

Bottom line: The market is up big again this year (16.5%). And that means the stage is set for a rally, not a selloff. No matter how much the financial media tries to tell you otherwise.

Ahead of the tape,

Louis Basenese

The post Surprise! Stocks Aren’t Guaranteed to Tank in September appeared first on Wall Street Daily.

Article By WallStreetDaily.com

Original Article: Surprise! Stocks Aren’t Guaranteed to Tank in September

Business Stalls for Equipment Manufacturers; Outlook for Precious Metal Companies Flat

By Profit Confidential

Business Stalls for Equipment ManufacturersOne specific stock market sector that continues to be very challenging is the precious metals mining area. A combination of events has hit the precious metals producers: lower spot prices and rising costs being two of the main factors. It’s been the perfect storm for gold mining stocks, and the trend isn’t over yet.

And with reduced operating margins comes the big squeeze in capital expenditures. This is no more evident than in the well-known mining equipment company Joy Global Inc. (JOY), which has been under pressure on the stock market for the entire year.

Joy Global is a well-known manufacturer of mining equipment out of Milwaukee, Wisconsin. It’s been around since 1884, and like precious metals themselves, the company’s share price is volatile.

In the company’s latest earnings report for its third fiscal quarter of 2013 (ended July 26), total bookings for underground mining machinery dropped a staggering 42.6% to $361.2 million from $629.2 million in the same quarter last year.

The company reported original equipment orders fell 68%, with declines in all regions except China. Aftermarket orders fell 27%, with declines in all regions except North America. Foreign exchange hurt orders for underground mining machinery, which dropped by $71.0 million, according to the company.

Total revenues in Joy Global’s latest quarter fell five percent to $1.3 billion. As noted by the company’s management team, prices for industrial metals and bulk commodities have dropped 20% to 40% over the last 18 months.

Seaborne coal prices have fallen 17% since the beginning of the year, and China’s domestic coal prices have dropped almost 20%. With this backdrop, Joy Global says that many mines are now uneconomic, which will result in closures. Until there is a “rebalance” in the marketplace, there will be no incentive to invest in new mining capacity.

As you can see, it’s not a great time to be in this industry.

But the flip side to precious metals is oil, with prices strengthening further due to events in Syria. (See “My Two Favorite Picks in the Speculative Oil & Gas Sector.”)

Anything related to resource/commodity investing is always risky. Tides change so quickly in the resource business, and it mostly has to do with spot prices. It very much remains a risk capital stock market sector, even with large-caps.

I would not make the case for considering a company like Joy Global for investment at this time, recognizing that it does have a long history as a mining equipment innovator.

Not surprisingly, Joy Global recently announced a major new share buyback program, which seems to be a given these days when a company announces a weak quarter.

This stock is not expensively priced, and the company pays a dividend with a current yield of 1.3%. But to invest in a mining equipment manufacturer at this stage of the business cycle in precious metals is unwise. Joy Global’s management team did a very good job highlighting the company’s global challenges in its latest earnings report.

Spot gold (and silver) prices have been ticking higher lately due to geopolitical events. But there’s no need to be loading up on mining stocks, especially when the other side of the equation—costs—show no sign of easing.

Article by profitconfidential.com

Why Oil Prices Aren’t Going Anywhere If Syria Stabilizes

By Profit Confidential

Oil Prices Aren’t Going Anywhere If Syria StabilizesFor those of you who think oil prices will continue to steadily rise, you may want to pause and rethink that. The reality is that the price of oil, which in our case means West Texas Intermediate (WTI) crude, recently broke difficult resistance at $110.00 a barrel. I wouldn’t be emptying my son’s piggy bank to buy oil.

Now, if the conflict in Syria worsens and a U.S.-led coalition goes in and bombs the heck out of the Syrian army, then obviously oil prices would drive higher. And to make matters worse, if Syria, which is said to be harnessing the world’s largest chemical weapons arsenal, decides to engage in chemical warfare as its best defense, then we would have a major problem and oil prices would surge.

In the worst case scenario, if U.S. ally Iran and its Supreme Leader Ayatollah Ali Khamenei decide to enter into the fray, then the risk of the war spreading through the tension-filled Middle East would intensify. For example, if Iran decided to join Syria and, in the process, launch an attack against its enemy Israel, then all I can say is hell would break out.

I hope the worst case scenario doesn’t happen, but if it does, look out, as oil prices will surge.

Yet based on oil futures, it seems like the stock market is betting on nothing major materializing in Syria and the Middle East.

The price chain of the WTI crude oil shows futures oil prices declining below $100.00, beginning with the May 2014 contract. Prior to that, the high point is $109.33 for the October contract. In fact, the futures oil prices fall below $90.00, starting with the June 2015 contract, and below $80.00, with the December 2019 contract. The December 2021 contract is priced at $78.00.

Light Crude Oil Chart

Chart courtesy of www.StockCharts.com

Now the prices clearly suggest nothing will happen to wreak havoc with the oil market, specifically with the situation in Syria.

The steady decline in the WTI oil prices also suggests steadily higher production from domestic reserves, including shale oil from North Dakota and Montana and Canadian oil from the tar sands in Alberta. (Read “Why This Cold Prairie State Is an Investment Hotspot.”)

So if you decide to trade oil, keep in mind that it will largely be dependent on the Syria situation at this time—meaning that it becomes more of a betting game, which is only for risk capital.

Article by profitconfidential.com

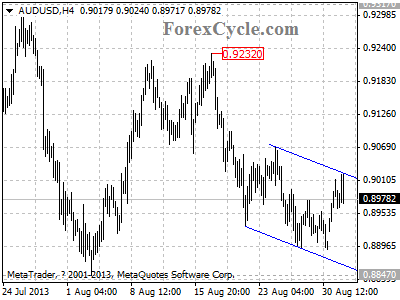
AUDUSD stays within a downward price channel

AUDUSD stays within a downward price channel on 4-hour chart, and remains in short term downtrend from 0.9232. Resistance is at the upper line of the channel, as long as the channel resistance holds, the downtrend could be expected to resume, and another fall to test 0.8847 support is still possible, a breakdown below this level will signal resumption of the longer term downtrend from 1.0582 (Apr 11 high), then the following downward movement could bring price to 0.8500 zone. On the upside, a clear break above the channel resistance will suggest that the short term downtrend from 0.9232 is complete, then further rally to 0.9200 area could be seen.

audusd

Provided by ForexCycle.com

How to Make The Job of Selling Stocks Easier…

By MoneyMorning.com.au

The easiest way to not lose money on the stock market is to not invest in stocks.

It’s an investment strategy advocated by the newest member of the Money Morning team, Vern Gowdie.

It’s a radical position. And we thought we were contrarian. But Vern’s strategy takes the biscuit on that score.

But as we wrote yesterday, there are things to think about before you rush out to sell your stocks.

For a start you need to think about the opportunity cost of not owning stocks. Plus there are the tax implications.

The truth is that most investors find selling stocks a lot harder than buying stocks. But there is good news. There’s a way to make the job of selling much easier…

Before we get into that, why is it that investors find selling a stock so hard?

The simple answer is that investing in stocks is a much more emotional experience than you may think.

Few investors have ice running through their veins when it comes to stocks. Even before an investor buys a stock they develop an emotional attachment to it.

That’s understandable. You put so much research and background reading into a stock, by the time you invest the money it doesn’t seem possible the stock could fall.

But sometimes against your hopes, the stock falls. And rather than admitting you may have made a mistake, you hang with it and justify your decision; ‘the market is wrong, not me!’

Even Billionaire Investors Get it Wrong

Look, we’ve all done it. Your editor has done it. And some of the world’s biggest investors have done it too.

Big hedge fund manager Bill Ackman bought into US retailer JC Penney [NYSE: JCP] in late 2010 when the stock traded between USD$20 and USD$35. His aim was to turn around the ailing retailer.

His hedge fund ended up owning 18% of the company.

But even a billionaire investor doesn’t get it right all the time. Last week Ackman finally announced he had had enough. He’s decided to sell his stake in the company. The shares are trading at USD$12.50.

Ackman’s hedge fund is looking down the barrel of at least a 50% loss on the investment.

Now, let’s make one thing clear. You will make losses as an investor. Anyone who tells you they’ve never made a loss or can show you a way to not make losses isn’t being truthful.

So if you’re looking for the magic investment that eliminates all losses, forget about it. You’re wasting your time. Such an investment doesn’t exist.

The best thing you can do is find ways to help minimise losses…or trying to avoid them in the first place.

This is where we recommend using stop orders. Again, they aren’t perfect, but if you use them wisely it’s a handy way to stop a big profit turning into a small profit, or a small loss turning into a big loss.

Taking the Emotion Out of Investing

So, what is a ‘stop order’?

Put simply, a stop order is an order you place with your broker to automatically sell a share if the price falls to a certain level.

For instance, if you bought a stock at $5, you could place a stop order to sell the stock if it falls to or below $4.50. The great thing about stop orders is that it takes the emotion out of investing.

Rather than sticking with a stock because you don’t want to admit you’re wrong, a stop order will automatically sell your shares if it falls to the pre-set price.

Now, this doesn’t mean you should use stop orders for every stock position – although some people do.

And stop orders aren’t a substitute for doing your homework. As you can picture, if every share you buy hits the stop level, odds are you’ll end up losing a lot of money.

The best way to use stop orders is when a stock is trending one way or the other in a gradual fashion. This is when you can use a ‘trailing stop order’. That is, as the share price goes up, you move your stop order higher.

So, just say your $5 stock is now $6, you could move your stop order to $5.50. If the share price falls back to $5.50 it triggers the stop order and you’ve locked in a profit of 50 cents.

(By the way, if you plan on using stop orders check with your broker on how they execute the trades. If the market ‘gaps’ lower, i.e. it doesn’t trade at your stop level, the broker may sell at a price lower than you expected.)

It’s also handy if you’re buying into a stock that’s trending lower where you’re betting on the stock reversing its trend. If you’re wrong, the stop order will kick in and you’ll get out of the position.

The stocks where stop orders don’t always work are the particularly volatile stocks. That doesn’t mean you shouldn’t use stop orders. It just means you may need to set your stop further away from the prevailing price to ensure you don’t sell during short-term volatility.

An Investor’s Duty

As we say, stop orders aren’t perfect and they aren’t for everyone.

If you’ve bought a dividend paying stock for the long term and you’re comfortable the company will keep paying out a dividend, then it probably doesn’t make sense to use a stop order on these shares.

In fact, you’re arguably better off buying more shares when the share price falls – especially if it’s a stable and dependable dividend payer.

But if Vern’s prophecy is right  and the markets are due to suffer the consequences of the Great Contraction, it’s every investor’s duty to manage their portfolio in a way that will minimise losses if the market suffers a huge fall.

We’ll have more advice on ways to lock in profits and reduce losses in tomorrow’s Money Morning.

Cheers,
Kris+

Join The Daily Reckoning on Google+

From the Port Phillip Publishing Library

Special Report: GET OUT & STAY OUT

Australian Small-Cap Investigator:
How to Make Big Money from Small-Cap Stocks

How to Escape the Costs of Investing

By MoneyMorning.com.au

High costs and low returns don’t mix.

In the good times generosity abounds. Everyone gets to share in the spoils. Investors, fund managers and financial planners all make money. It is only when the good times stop investors sharpen their focus on the genuine value derived from fees.

The Cost of Investing

Fees and taxes act like friction on your investments. They slow down the compounding rate of return you can achieve. Where possible, it is imperative to minimise both.

There are generally three layers of fees in the investment industry. The fees will vary depending on amount invested; services offered; type of investment recommended and type of administration service. The following are indicative fee ranges offered by the investment industry:

  • Financial planner: 0.5% to 1.% — note with the introduction of Future of Financial Advice (FOFA) on 1 July 2013, the percentage based fees have largely been replaced by a dollar amount monthly retainer e.g. $100 per month ($1,200 per annum). If you have an investment of $200,000 this equates to 0.6% of funds invested.
  • Investment manager: 0.2% to 1.2%
  • Administration: 0.3% to 0.5%

The total level of fees can vary from 1.0% to 2.7%. In my experience the average fee for the average client tends to be around 1.8% to 2.0%

Are Investment Managers Value for Money?

The theory is professional investment managers will more than justify their fees by outperforming the market.

As usual there is a difference between theory and reality..

The vast majority of professional managers measure their performance to a relevant index. A manager investing in the Australian share market’s Top 200 companies benchmarks its performance against the ASX 200 Accumulation index.

Professional investment managers undertake extensive company research to identify the winners and losers in the index. The managers aim is to back more winners than losers to deliver superior performance. This is easier said then done.

Investment managers suffering from Illusory Superiority Syndrome (above average effect) are inevitably brought back to earth by the performance tables. 

The following chart from S&P Dow Jones Indices Report 31 Dec 2012 shows over a 1, 3 & 5 year period the percentage of investment managers who were outperformed by the index up to 31 December 2012.

In my opinion the Five Year column — a decent amount of  time for a trend to be established — is the most relevant. With the exception of Large Cap Value Funds (and only by a very small margin), the majority of professional investment managers did not beat the relevant index.

The following extract from the reports Executive Summary (emphasis is mine) pretty much sums it up:

The performance figures are equally unfavorable for active funds when viewed over three- and five- year horizons. Managers across all domestic equity categories lagged behind the benchmarks over the three-year horizon. The five-year horizon yielded similar results, with large-cap value emerging as the only category that maintained performance parity relative to its benchmark.

The above data is on the US investment industry. However, Morningstar Research has conducted similar studies on the Australian industry and produced roughly the same results.

While the data clearly indicates the majority struggle against the index, there are a select group who do consistently out perform the index.

Selecting these consistent outperformers in advance is not easy. The task doesn’t get any easier by using past performance either. There is absolutely no guarantee the results will be replicated.

How to Play the Percentages Game

We know from the S&P Dow Jones table nearly 70% of investment professionals fail to beat their relevant benchmark.

The other major consideration is cost. There is a significant difference in the percentage charged to run an index fund and that charged by investment professionals.

Index funds employ computer models (not expensive analysts) to simulate the index.

Without the high cost of personnel, an Australian share index fund (Exchange Traded Fund) operates on a management fee of approx. 0.3% per annum.

The management fee for investment professionals — operating in the Australian share market — range from around 1% per annum (Wholesale) and up to 2% per annum (Retail).

Based on: a) The index consistently outperforms the majority of investment professionals, and b) Index funds operate on significantly lower fees, the question is, ‘Why wouldn’t you just invest in the index?’

If investors adopted this simple and logical approach, then nearly 70% of investment professionals would close their doors. The investment industry will not surrender this ground easily. This expains why marketing departments are an essential part of the industry.

The Return of the Secular Bear Market

The Secular Bull Market of 1982 to 2007 delivered an average return (income + growth) over this 25-year period of 15% per annum.

With this level of return on offer, investors are happy to share the bounty and rarely question paying an all inclusive investment cost of 2% per annum.

It is a different story in a Secular Bear Market. Low single figure returns are the norm for Secular Bear Markets and paying 2% per annum strips away the majority of an investor’s return.

Only time will tell as to whether we have entered a Secular Bear Market or not, but it is reasonable to assume the sustained double digit market returns are a distant memory. Therefore the luxury of higher fees for lower performance is one you can definitely not afford (not that you should need a Secular Bear Market to highlight this fact).

In my opinion a prudent optimistic outlook for the future would be for a low growth, low return era in all major investment markets — shares, cash, fixed interest and property.

The more pessimistic outlook would see negative returns in risk assets — shares and property — and very low interest rates on cash and term deposits.

In either scenario, paying fees totalling 2.0% per annum seriously erodes your net returns.

Even if you disagree with my bleak outlook for growth assets, investing in index based ETFs compared to investment professionals makes sense from both a cost and performance perspective.

With the market conditions we find ourselves in, it is vital you reduce your friction to a fraction.

Regards,

Vern Gowdie
Chairman, Gowdie Family Wealth

Join Money Morning on Google+

Vodafone and Verizon Reached an Agreement

Article by Investazor.com

The Vodafone Group decided to sell its 45% stake in Verizon Wireless for $130 billion according to the last press releases related to the negotiations. Sources are saying that Vodafone will get $58.9 billion in cash, $60.2 billion in Verizon stock and additional $11 billion in the beginning of the next year. For the following period, Vodafone is planning to extend on the European market which is its main target. In this respect, the company is about to make serious investments in countries like Spain, Italy, Germany and Portugal. Another area that is in question is Africa which is considered a market with full of potential. This transaction would also help Verizon Communication develop on the U.S. market and beat its competitors, boosting its profits. Because of a clause introduced in 2002 in the Britain capital gains legislation, allowing companies to return cash from large disposals to the U.K. without paying taxes, chances are that the great deal of money resulting form this transaction will go to the U.K..

As the deal is nearing completion, Vodafone’s stocks are getting to highs that haven’t been reached in a decade. Holders of the Vodafone’s shares are expecting as well a better payout resulting from their investments, situation that could radically change on the long term. The second largest transaction in history is expected to improve the image and profits of both the companies involved.

The post Vodafone and Verizon Reached an Agreement appeared first on investazor.com.

Technical Overview on the Forex Majors (2 – 6 September)

Article by Investazor.com

It has been a while since we haven’t post something on the major currency pairs, so for today we have prepared a technical analysis on the most frequent traded FX instruments.

Let us start with NZD/USD, which has moved sideways from 24th of June. Now the price has reached the lower boundary but it started drawing a positive divergence. The price action made lower lows, while the 14 RSI has drawn higher lows, signaling this way a possible reversal. Now it would be better to wait for a confirmation. If the price will fall under the local support, 0.7790, the divergence could have given us a false signal and the down move could continue to 0.7677. On the other hand, a breakout above 0.7872 could trigger a rally that might get the price back to 0.8000.

nzdusd-signaling-a-reversal-resized-02.09.2013

Chart: NZDUSD, H4

The Canadian dollar continued to lose ground after Canada reported a drop of 0.5% in the GDP. USD/CAD has come back around 1.0600 price level, a high touched in July. The price of this pair seems to be in a grey area between 1.04300 and the current highs. If the resistance will be broken then we expect a rally to 1.0700, while a drop under the support might bring the price back to 1.0300.

usdcad-in-a-grey-area-resized-02.09.2013

Chart: USDCAD, Daily

USD/JPY broke up from the Double Bottom pattern and continued to retest 97.00 for several times. In the bigger time frame we can see that the price is consolidating around 98.00 level. On a 4 hours chart we spot a short break of the today’s rally. It is important to wait for a breakout. If the price will break above 99.40, the next good resistance sits at 100.00; on the other hand a drop under 99.15 could be stopped at 98.50.

usdjpy-break-after-rally-resized-02.09.2013

Chart: USDJPY, H4

During the past two weeks AUD/USD had a down slope, but the pattern that has emerged is actually a reversal pattern. The Falling Wedge was confirmed by a breakout on the 240 minutes chart (4 hours), but the price of this pattern has not yet reached the pattern’s target. It has found a good support at 0.9000 but a close above this level would leave the road open for a rally to 0.91 where the Wedge’s target is set. If the price will fall under 0.8900 then the higher probability is to continue its fall all the way to 0.8800.

audusd-falling-wedge-broke-resized-02.09.2013

Chart: AUDUSD, H4

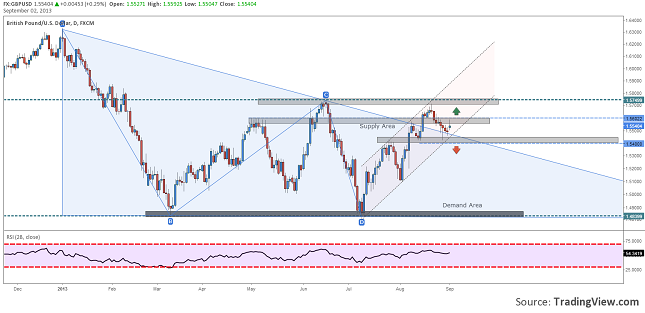
We got to GBP/USD. The British pound has managed to stay in an up channel from the beginning of July. It also broke out of a Descending Triangle on 15th of August, but the rise was only sustained until 1.5750. The drop that followed brought the price back to a good demand area right next to 1.54. If the price will close, on a daily time frame, under the support level the pound might get all the way to 1.5000. If the pound’s buyers will drive the price above 1.5600 then the target will become the area between 1.5750 and 1.5800.

gbpusd-broke-the-triangle-resized-02.09.2013

Chart: GBPUSD, Daily

Even though there are some interesting and important technical signals, do not forget to take a look over the fundamentals, and especially over the economic releases and the monetary policy.

The post Technical Overview on the Forex Majors (2 – 6 September) appeared first on investazor.com.

Central Bank News Link List – Sep 2, 2013: ECB’s Coeure says bank eyeing market rates closely-paper

By www.CentralBankNews.info Here’s today’s Central Bank News’ link list, click through if you missed the previous link list. The list comprises news about central banks that is not covered by Central Bank News. The list is updated during the day with the latest developments so readers don’t miss any important news.