Monetary Policy Week in Review – Sep 16-20, 2013: Fed, India surprise markets, 7 central banks keep rates on hold

By www.CentralBankNews.info

    The U.S. Federal Reserve’s surprisedecision to postpone the inevitable wind down in asset purchases for a few more months dominated global monetary policy last week, closely followed by India’s equally surprising decision to raise its policy rate.
    Last week nine central banks took policy decisions with seven banks keeping rates on hold (the United States, Sri Lanka, Turkey, Ghana, Norway, Switzerland and South Africa), while Egypt again cut its rate and India raised its rate.
    The previous week 11 central banks took policy decisions, with nine keeping rates on hold (Mozambique, New Zealand, Chile, Korea, Philippines, Serbia, Macedonia, Peru and Russia) while Indonesia again raised its rate along with Pakistan.

    Through the first 38 weeks of this year, central banks have raised rates 21 times, or 5.8 percent of the 365 policy decisions that have been taken by the 90 central banks followed by Central Bank News, up from 5.6 percent the previous week and 5.2 percent two weeks ago.
    Meanwhile, the ratio of rate cuts continues to drop. Rates have been cut 86 times this year, or 23.6 percent of this year’s policy decisions, down from 23.9 percent the previous week and 24.6 percent two weeks ago.
    Emerging markets account for 43 percent of the 21 rate rises, with Brazil, Indonesia and India accounting for eight of those rate rises.
LAST WEEK’S (WEEK 38) MONETARY POLICY DECISIONS:
COUNTRYMSCI    NEW RATE          OLD RATE       1 YEAR AGO
SRI LANKAFM7.00%7.00%7.75%
TURKEYEM4.50%4.50%5.75%
GHANA16.00%16.00%15.00%
UNITED STATESDM0.25%0.25%0.25%
NORWAYDM1.50%1.50%1.50%
SWITZERLANDDM0.25%0.25%0.25%
SOUTH AFRICAEM5.00%5.00%5.00%
EGYPTEM8.75%9.25%9.25%
PREVIOUS WEEK’S (WEEK 37) MONETARY POLICY DECISIONS:
COUNTRYMSCI    NEW RATE          OLD RATE       1 YEAR AGO
MOZAMBIQUE8.75%8.75%10.50%
NEW ZEALANDDM2.50%2.50%2.50%
CHILE5.00%5.00%5.00%
INDONESIAEM7.25%7.00%5.75%
SOUTH KOREAEM2.50%2.50%3.00%
PHILIPPINESEM3.50%3.50%3.75%
SERBIAFM11.00%11.00%10.50%
MACEDONIA3.25%3.25%3.75%
PERUEM4.25%4.25%4.25%
RUSSIAEM8.25%8.25%8.25%
PAKISTANFM9.50%9.00%10.50%
     This week (week 39) 12 central banks are scheduled to hold policy meetings, including those from Israel, Nigeria, Armenia, Hungary, Georgia, Moldova, the Czech Republic, Taiwan, Fiji, Trinidad and Tobago, Rwanda and Colombia.

COUNTRYMSCI          DATE  CURRENT  RATE        1 YEAR AGO
ISRAELDM23-Sep1.25%2.25%
NIGERIAFM24-Sep12.00%12.00%
ARMENIA24-Sep8.50%8.00%
HUNGARYEM 24-Sep3.80%6.50%
GEORGIA25-Sep3.75%5.75%
MOLDOVA26-Sep3.50%4.50%
CZECH REPUBLICEM26-Sep0.05%0.25%
TAIWANEM26-Sep1.88%1.88%
FIJI26-Sep0.50%0.50%
TRINIDAD & TOBAGO27-Sep2.75%2.75%
COLOMBIAEM27-Sep3.25%4.75%
RWANDA27-Sep7.00%7.50%

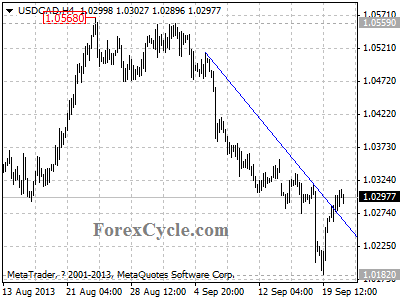
USDCAD broke above trend line resistance

USDCAD broke above the downward trend line on 4-hour chart last Friday, suggesting that consolidation of the downtrend from 1.0568 is underway. Range trading between 1.0182 and 1.0350 would likely be seen in a couple of days. Resistance is now at 1.0350, as long as this level holds, the downtrend could be expected to resume, and another fall towards 1.0000 is still possible after consolidation. On the upside, a break above 1.0350 will suggest that the downward movement from 1.0568 had completed at 1.0182 already, then the following upward movement could bring price back to 1.0750 zone.

usdcad

Provided by ForexCycle.com

My Simple Approach to Buying Stocks in This Market…

By MoneyMorning.com.au

It’s a bull market.

No it’s not.

The US Federal Reserve’s gonna keep printing money.

No they’re not…yes they are…no they’re not.

Just when we think we’ve got this market licked…just when we think the Federal Reserve has made its position clear and we know what it’s up to, someone starts flapping their mouth to confuse things again.

And what do you know? Stock prices give up their gains. So, what’s an investor to do?

Our old pal Dan Denning knows the answer…

Dan edits The Denning Report, our premium macro-economic investment advisory service.

Dan looks at the big investing picture. It was this big picture analysis that meant he was one of the first Australian-based analysts to pick the shale gas boom.

It has helped him to rack up gains of 200%, 117% and 54.7%.

The same big picture view has helped him bag his readers a 55% gain on a super-volatile precious metals stock, too.

And now Dan has some advice for investors trying to play the current market.

Play the Ball Not the Man

In his update to Denning Report readers last Friday, Dan wrote:

But there are a couple of important takeaways from the last 48 hours. First, you should play the ball, not the Fed. Everyone was so busy taking the Fed at its word that I reckon very few people took the other side of the trade. But if we’d been thinking about our own strategy instead of trying to figure out what’s inside Bernanke’s brain, we might have seen the situation more clearly and made a profitable speculation or two.

Lesson? Don’t dance to the Fed’s tune. You’ll stop thinking for yourself. You’ll become the stock market equivalent of a “rent seeker”, or an investor who profits from the largesse of others (Bernanke) without a thought to value, strategy, or risk. They say in footy you should attack the football, not the man. The same is true here: attack the markets and don’t play the Fed.

Without blowing our own trumpet too much (Parp!), that’s exactly the strategy we’ve followed for the better part of two years. And because we’ve continued to play the ball, not the man, it has meant we’ve stayed in the market while others scared themselves out of it.

We will concede one thing. It hasn’t helped us too much with short-term speculations, because we’re just not very good at trading short-term price action.

But it has helped us clock up some tasty gains (triple-digit and high double-digit) for Australian Small-Cap Investigator  readers over the medium and longer term.

And our bet is there are still many more gains to come.

As Dan says, the key is to play the ball and not the man…unless that man happens to be one of the world’s leading entrepreneurs…

Fortunes Are Made in Recessions

As this report in Bloomberg News notes, Tesla Motors [NASDAQ: TSLA] founder Elon Musk is just getting on doing what he does best – coming up with great new ideas:

Elon Musk, Tesla Motors Inc. (TSLA)’s unconventional chief executive, has turned to Twitter Inc. to further his goal of developing self-driving cars by posting a “help wanted” ad on the social media site.

Musk, who told Bloomberg in May that Tesla would eventually develop its own “autopilot” technology for cars, wrote in a post on Twitter yesterday that the Palo Alto, California-based maker of electric cars is serious about developing such a system.

We wouldn’t be surprised if Musk didn’t know who Ben Bernanke is. And to be honest, if you’re focusing on entrepreneurial companies, what does it matter which egg-head has their finger on the printing press?

As CNN Money notes, the following six giant companies each came into existence during a recession or depression:

  • Proctor & Gamble, during the Panic of 1837
  • IBM, during the Long Depression of 1873-1896
  • General Electric, during the Panic of 1873
  • General Motors, during the Panic of 1907
  • United Technologies Corp, during the Great Depression
  • Federal Express, during the Oil Crisis of 1973

Even Musk’s Tesla Motors was founded in 2003, arguably towards the end of the early 2000′s recession.

Focus on What You CAN Control

There’s a simple message in all this.

It’s not necessarily to ignore all the stuff that happens around the periphery, but that it is important to keep it in its place.

That means not allowing things you can’t control to take control of your investments – if you get what we mean.

That’s why we try to focus on two key types of stock investment: dividend stocks that should provide a reliable income regardless of market conditions, and entrepreneurial high-growth small-cap stocks that could give investors spectacular returns because they’re at the leading edge of technological change.

If you stick to the same plan we’re convinced you’ll not only achieve better investment returns, but you’ll have a much less stressful life, not worrying about what the Fed will or won’t do…or what impact it will or won’t have on your stocks.

As Dan says, ignore the man and play the ball.

Cheers,
Kris+

Join Money Morning on Google+

Special Report: Are You Waiting for a Real Estate Crash That Isn’t Going to Come?

The Stock Market is a Trap

By MoneyMorning.com.au

What will happen if this inflatable stock market rally blows up? Speaking with Greg Canavan, editor of Sound Money Sound Investments, he mentioned the idea that most of the rally in stocks has been ‘multiple expansion’. Earnings haven’t kept up with stock prices. Instead, investors are simply paying more for stagnant earnings.

What’s more, it appears investors are paying a premium on stagnant earnings with borrowed money. Margin debt is leverage your broker allows you to use. You can borrow against the value of the securities in your portfolio to buy more securities, which works pretty well in a rising market.

But in a falling market, margin calls – where you have to post more collateral against the falling value of your portfolio – accelerate stock market crashes. To raise cash and meet the margin call, investors are forced to sell. It’s a brutal and rapid kind of deleveraging. And it’s coming to a market near you – soon, based on the two charts below.

The first chart shows margin debt on the New York Stock Exchange (NYSE) going back to 1943. Below that you see that margin debt as a percentage of the total market capitalisation of the NYSE. What it shows is that margin debt is near an all-time peak in nominal terms and also near an all-time peak in terms of its percentage of market cap. Let’s break it down.

The Danger of Borrowed Money in Today’s Financial System

In March of 2000, margin debt peaked at a then-all-time-high of $278 billion. That was a peak in its percentage of market cap, and quite obviously it was a peak in the stock market, which proceeded to crash over the next three years. Only Alan Greenspan cutting interest rates 13 times in a row and leaving them at one percent for twelve months reversed the decline.

In June of 2007, margin debt on the NYSE made a new all-time-high at $378 billion. That was around the time the Bear Stearns leveraged mortgage funds began to crack. It was an early warning sign of the big credit crisis. That crisis destroyed the value of collateral in the banking system and led to a lot of forced selling of stocks. Hence the stock market high.

Australian stocks have just now recovered from the fall from the 2007 peak. In fact, as I write the All Ords are trading at 5276. The last time they traded that high was August 2008. They fell by 40% over the next eight months, before bottoming at 3111 in March of 2009.

And now here we are, looking at the second chart. The growth in margin debt has clearly fuelled the rise to all-time highs on the S&P 500. The rotation out of fixed income and emerging market stocks has poured even more fuel on the fire. At $382 billion dollars, margin debt is peaking along with stocks.

The boom in margin debt is a feature of Ben Bernanke’s attempt to levitate asset markets across a sea of bad debts in the financial system. The trouble is, there is nothing on the other side. In stock market cycles, shares move from overvalued to undervalued. They are over-bought and over-valued now.

Could they go higher still? You bet they could. If margin debt as a percentage of market cap reaches a new all-time high, there’s probably another 5-10% rally in store. That’s the sort of move that could happen if the Federal Reserve taper worries prove to be unfounded…and if the prospect of war in Syria fades. That’s a powerful cocktail for higher prices.

But the numbers don’t lie. When people borrow money to bet on higher prices, you’ve reached the end of a cycle. Sentiment and recklessness peak. The trade gets crowded. And then it reverses.

Dan Denning+
Editor, The Denning Report

Join Money Morning on Google+

Free Elliott Wave Forex Trading Course

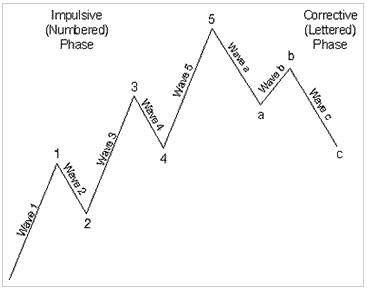
How to Use Elliott Wave Analysis to Boost Your Forex Trading

For a limited time, you can take advantage of access to the full $79 online trading course, FREE.

Learn from Jim Martens, Senior Currency Strategist for Elliott Wave International

Watch Mr. Martens demonstrate how you can use Elliott wave analysis to develop trading strategies and identify opportunities in your Forex trading.

Jim has been practicing Elliott for over two decades. Also – and this is very important – he’s not a spring chicken when it comes to trading: Jim spent two years working for Nexus Capital Ltd., a fund affiliated with none other than George Soros.


Get Free Access to Complete Forex Course Now


elliott-wave-international-forex-course

Here’s what you’ll learn in this 90-minute course:

  • How to identify trade set-ups in currencies
  • How to set protective stops using Elliott to help me manage risk
  • How to set price targets using Elliott wave analysis
  • How to identify a wave pattern in real-time forex trading on your screen
  • How not to be distracted by the news from the real trend
  • What to expect from a market when a wave pattern ends
  • How to combine other market indicators with your Elliott wave analysis
  • How important it is to have a larger perspective of your currency market
  • How to set price targets for waves using Fibonacci numbers
  • How to deal with complex Elliott wave corrections
  • And MORE!

Get Free Access to Complete Forex Course Now


Elliott Wave International is the world’s largest market forecasting firm. Its staff of full-time analysts led by Chartered Market Technician Robert Prechter provides 24-hour-a-day market analysis to institutional and private investors around the world.
Foreign Currency trading and trading on margin carries a high level of risk and can result in loss of part or all of your investment. Due to the level of risk and market volatility, Foreign Currency trading may not be suitable for all investors and you should not invest money you cannot afford to lose. Before deciding to invest in the foreign currency exchange market you should carefully consider your investment objectives, level of experience, and risk appetite. You should be aware of all the risks associated with foreign currency exchange trading, and seek advice from an independent financial advisor should you have any doubts.

Binary Options Vs. CFD Trading

Article by Thebinaryoptionsbroker.com

When we say Binary Options Vs. CFD Trading, we are trying to consider the similarities and differences between binary options and CFD trading systems. This is necessitated because, if you are trader looking for a method to profit from trading, you will need to understand the dissimilarities between the two before investing in any. Although these trading methods vary from the standard trading of commodities, stocks, currency pairs or indices, you can apply the experience acquired from standard trading to these two types of trading.

In Binary Options Vs CFD Trading, CFD traders will have to pay commissions and fees where fees are frequently coupled with power to invest using borrowed funds. You will need to invest just 10% of your own money upfront, with the left over being borrowed or spotted. The remaining amount will have to be paid, if the trade ends with the trader owing money. On the other hand, you as the trader have to pay financial charges and commissions to the broker, even if the trade ends in money.

As far as binary options trading is concerned, there is no commission or borrowing amounts associated with it. As an alternative, the broker will earn money on all successful and unsuccessful trades that pay out something less than 100 percent of the first investment. The meaning of this is that there is no upfront cost to function with a binary options broker, but just require depositing funds to trade with. The withdrawal fees that some brokers charge when multiple withdrawals are initiated in the same month is the only fees that a binary options trader may be subjected to.

Another issue in Binary Options Vs CFD Trading is that in Contract for Difference aka CFD, trading is carried out without actually buying an asset which is also the case with binary options trading. A contract is purchased in CFD, which will yield two possible results – make or lose money. The trader has the alternative to go long (buy) or go short (sell), depending on the prediction they made as to whether the asset value will increase or decrease by the end of the contract time. As this may appear the same with binary options trading, the CFD will not know upfront the amount they will earn if they are in money at the end of the contract period.

Another difference to note when looking at Binary Options Vs CFD Trading is that several binary options brokers will give a refund or a percentage of 10 to 15 percent on all trades that end out of money. As far as the CFD trading is concerned, there is no such assurance. However, there is the possibility of using stop loss as an alternative, but this can only be done when a loss is happening. If the trade should continue until the contract expiration time, this will just prevent the trader from losing more money.

The binary options and CFD trading are available on many diverse assets. They will then offer almost immeasurable trade opportunities. In Binary Options Vs CFD Trading, what traders need to decide when choosing between binary options and CFD trading is the degree of risk they are willing to accept for the potential reward. In addition, this same traders must also decide whether they want to have the end number remain in limbo until the end of the end of the contract time period or prefer to know the exact possible outcomes.

It is also noteworthy to look at the similarities between these trade options when considering Binary Options Vs CFD Trading. The binary nature of the trade is the similarities between the two investments as well as the fact that the two trades can take advantage of the bear markets and sheer amount of assets available to both CFD and binary traders. Both the CFD and binary options trading markets are by far the most liquid with the greatest number of investment opportunities in terms of number of assets across all the four most important assets – indices, stocks, commodities and currencies.

Without mincing words, CFD trading is very much better suitable to more proficient investors who are having a huge degree of market knowledge in addition to higher amount of disposable risk capital. On the other hand, the binary options are your best bet, if you are entry level investors that want to give the game a trial with a limited amount of capital they are prepared and willing to risk.

The post binary options Vs. CFD trading also appeared on Thebinaryoptionsbroker.com.


Madoff’s Ponzi Scheme Looks Like a Joke Compared to This

By Profit Confidential

Madoff’s Ponzi Scheme Looks Like a Joke Compared to ThisThe “Bernie” Madoff name became famous while the stock market was falling during the credit and financial crisis. He was responsible for running one of the biggest Ponzi schemes in U.S. history—if I recall correctly, it was a $65.0-billion scheme. But as the scam got bigger, Madoff couldn’t go on. He was caught, prosecuted, and sentenced to more than 100 years in jail.

What did we learn from the Madoff ordeal? At the very least, we learned Ponzi schemes eventually become impossible to hide, no matter how smart and cunning the perpetrator.

Wednesday of this week, we learned that the Federal Reserve’s Ponzi scheme of printing paper money and giving it to the government via the purchase of U.S. Treasuries will go on.

While the Fed says it wants to keep the “stimulus” going until the economy gets better, as I have written in these pages many times, the Fed cannot stop printing because if it did stop, three things would happen: 1) the stock market would collapse; 2) housing prices would fall; and 3) the government would have no real buyer for its debt (especially in light of China and Japan pulling back on buying U.S. Treasuries).

Madoff’s $65.0-billion Ponzi scheme is nothing when I look at the U.S. national debt figures. While it looks like we are beyond the point of no return, our national debt level would have to double from $17.0 trillion to $34.0 trillion before our debt-to-gross domestic product (GDP) ratio matches that of Japan. (And don’t for a moment think that’s not going to happen!)

In 2011, only two years ago, we heard Congress debate whether they should increase our national debt limit or not. The theater of a government shutdown was on for a while; it drove key stock indices lower and bond yields higher. Now we’re at square one again. Secretary of the Treasury Jack Lew sent a letter requesting an increase in our national debt limit by October, or the U.S. economy would face a risk of default.

The bottom line, dear reader, is that the U.S. government is broke. To keep the government afloat from now until Congress passes a new national debt limit, the government has stopped investing into the pensions of federal government workers.

I don’t for a second doubt that Congress won’t raise the national debt limit—it will; it has done just that 78 times since 1960. Why would this time be any different?

The chart below shows how the national debt of the U.S. economy has skyrocketed since 1966.

Federal Debt Chart

What has happened so far—the massive printing of paper money—is just one part of the puzzle. The Ponzi scheme is complex and has many moving parts. The government’s failure to clamp down on spending is the main problem.

In the 11 months of the fiscal 2013 year, the U.S. government has incurred a budget deficit of $755 billon, according to the Bureau of Fiscal Services. (So much for those estimates that said the U.S. government budget deficit would be below $700 billion this year!)

The Congressional Budget Office (CBO) expects the U.S. government to continue posting budget deficits until 2015, when it says the annual budget deficit will equal two percent of the gross domestic product of the U.S. economy. (Source: Congressional Budget Office, September 17, 2013.) I don’t buy that prediction for a moment. Interest costs on the national debt alone could be a huge problem going forward.

For the government’s fiscal year ending this September 30, the U.S. government expects to have incurred $414 billion in interest payments alone. Assuming a national debt of $16.7 trillion, this equates to an interest rate of about 2.5%. But interest rates are rising!

And the more the national debt increases, the higher the interest payment. Think what will happen once interest rates in the U.S. economy start to climb higher, and when creditors start asking for higher returns due to our massive amount of national debt. Even if our national debt doesn’t change and interest rates go back to normal (it’s going to happen), the interest payments on the national debt would rise to over $900 billion a year!

Bring Social Security liabilities into the picture, and the future looks even more gruesome. According to the Pew Research Center, every day 10,000 Americans reach retirement age. (Source: Pew Research Center, December 29, 2010.) With the financial crisis having placed pressure on retirement savings, retirees are now relying on Social Security more than ever.

Right now we are seeing the government hoping investors will keep re-investing in U.S. bonds while the Fed picks up the slack. But what happens when they say, “We want our money back?” It will make Madoff’s Ponzi scheme look like a joke.

Article by profitconfidential.com