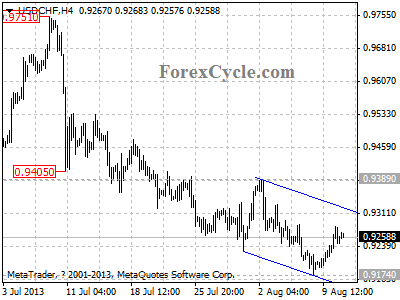
USDCHF remains in downtrend from 0.9751

USDCHF remains in downtrend from 0.9751, the rise from 0.9174 could be treated as consolidation of the downtrend. Resistance is at the upper line of the downward price channel on 4-hour chart, as long as the channel resistance holds, the downtrend could be expected to resumed, and another fall towards 0.9000 is still possible. On the upside, a clear break above the channel resistance will indicate that the downtrend from 0.9751 had completed at 0.9174 already, then the following upward movement could bring price to 0.9500 zone.

usdchf

Provided by ForexCycle.com

Why I’m Glad I Missed a Dividend Stock That Doubled…

By MoneyMorning.com.au

On and on the craze continues for dividend stocks.

We’d be lying if we said it didn’t concern us.

We’d be lying if we said the thought of an asset bubble hadn’t crossed our mind.

But that doesn’t mean the dividend craze will end soon.

The simple message is be alert but not afraid…

A big theme we’ve touched on in Australian Small-Cap Investigator is the way managers have had to change the way they run their businesses.

In some cases it’s a subtle change. In others it’s a blatant and desperate bid for shareholders to invest.

When most investors think about dividend payments they only look at it from the investors’ perspective. They don’t look at it from the businesses perspective.

That can be dangerous. That’s because a healthy looking dividend isn’t all it seems…

When a High Dividend isn’t all it Seems

You’re probably familiar with the saying ‘mutton dressed as lamb’. It’s the idea that something ugly or unappealing has been dressed up to look more appealing.

A healthy looking dividend can have the same effect. It can make an unappealing business appear to be attractive and worth investing in. And worse, plenty of investors will fall for it.

So, what’s the problem?

Companies have figured out that investors are craving dividends. You don’t need to be Einstein to work that one out. And so companies have figured out that they can use this dividend craze to attract investors to their company’s shares.

All they need to do is raise the dividend. Normally a company would raise its dividend if profits go up. But now you’ll find some companies are raising their dividend even if profits don’t go up…and sometimes when profits go down.

That’s because they know investors are more interested in the size of the dividend payout rather than the size of the company’s profits.

A classic example is Australian Securities Exchange (ASX) listed company Infomedia Ltd [ASX: IFM]. This is a stock we looked at about two years ago.

It was paying a fairly high dividend, but revenue was falling. Importantly, so was net profit. In fact, net profit had fallen so much the company had cut its dividend for four straight years.

But then something changed. Even though profits kept falling, the dividend didn’t.

You can see how the company’s numbers have stacked up over the past seven years in the table below:

Year

2006

2007

2008

2009

2010

2011

2012

Sales

17

17

16

16

15

15

15

Earnings

5.6

4.7

4.0

3.3

3.7

3.3

2.8

Dividend

11.0

7.5

3.2

2.8

2.4

2.4

2.4

NB: All numbers are cents per share

In short, despite earnings falling from 3.7 cents per share in 2010 to just 2.8 cents per share in 2012, the company has maintained a dividend of 2.4 cents per share.

To our mind, we’d rather stay clear of a business like that. Soon the market will start to think the dividend is unsustainable.

That’s why we’ve been careful with the small-cap dividend stocks recommended in Australian Small-Cap Investigator. We want stocks with room to pay or raise a dividend, but which also have the ability to grow revenue and earnings.

Looking at the numbers in the above table maybe you can see why we didn’t recommend this stock. It just isn’t a good business. However, we were (and still are) in the minority.

Why? Because the stock has more than doubled over the past year.

It’s Important to Question Your Investing Beliefs

That tells us some investors are just looking at one thing – the dividend yield. They’re ignoring everything else. They’re ignoring company fundamentals.

That’s why elements of this dividend rally have us on edge. And it’s why we’re glad we missed out on Infomedia.

It’s also another example of why we don’t want you to go head first into the stock market without thinking it through and properly analysing your investments.

Sure, folks who bought Infomedia at 25 cents must be feeling pretty smart now that it’s 62 cents. But we’ll stick with tipping stocks with rising revenue, profits and dividends.

So, why are we mentioning all this when we’ve told you we’re confident the stock market is going higher – to hit a record high in 2015?

Well, it’s important to remember that investing isn’t just about proving you’re right with an investment strategy. It’s also about making sure you’re not wrong…if you get what we mean.

That’s why we constantly question our own approach to stock investing. We believe we’re right about the demand for yield and that stocks will go higher from here.

But that doesn’t mean every stock will follow the same path. If we see things that cause us to pause we’ll stop, reassess and let you know what we’ve found. It’s then up to you to decide if it’s enough evidence to change your approach now or if you’re prepared to stick to the plan for a while longer.

Right now, we’ll just repeat what we said at the top of this letter: be alert but not afraid. We’ll just add one caveat to the end of that sentence, ‘yet’.

Cheers,
Kris+

From the Port Phillip Publishing Library

Join Money Morning on Google+

Special Report: The Sixth Revolution

Daily Reckoning: China’s Economy… Stabilising, Bottoming, Rebounding

Money Morning: Cash and Stocks Aren’t the Same

Pursuit of Happiness: Innovation Where You Least Expect… In the Shale Gas Industry

Australian Small-Cap Investigator:
How to Make Big Money from Small-Cap Stocks

Why Now is the Time to Buy Gold Stocks

By MoneyMorning.com.au

The time has finally arrived to step up to the plate and buy some beaten up gold stocks. I’ve been waiting for what seems like an eternity for the long term charts on gold to turn more bullish after a gut wrenching fall over the past year.
 
I’m going to stick my neck out and say that moment has arrived.

The first thing I needed to see was for the weekly MACD to cross above its signal line. You can see from the chart below that the last two times we saw the weekly MACD cross its signal line from below zero the gold price took off to the upside over the next few months.

Gold Price Weekly Chart


Click to enlarge

The first time was actually the beginning of a huge leg up in gold after the crash in 2008.

I also wanted to see a weekly close in the gold price above the 10-week moving average. I currently have the 10-week moving average sitting at US$1319 and yesterday’s rally in the gold price took it to US$1330 and above.

If prices can hold above the 10-week MA this week then it will increase my conviction levels that gold has seen an intermediate bottom.

Gold stocks saw good buying across the board yesterday. Silver Lake Resources (SLR), Troy Resources (TRY), Perseus Mining (PRU), Medusa Mining (MML), Kingsgate Consolidated (KCN), Gryphon Minerals (GRY), Resolute Mining (RSG), Newcrest Mining (NCM), Ramelius Resources (RMS), Saint Barbara Mines (SBM) and Oceana Gold (OGC) were all up by more than 7% yesterday.

The Aussie Gold Miners Index (XGD) is looking particularly interesting on the weekly chart. The thick blue line in the chart below is the low in the XGD after the crash in 2008. The false break of that low could prove to be a great buying opportunity in gold stocks for the long term. At the very least we should see a bit of a bounce in gold stocks in the short to medium term if we get the weekly close above that level.

XGD Weekly Chart

Click to enlarge

Another thing that has me interested is the fact that Newcrest Mining (NCM) announced a horrible annual result yesterday with a loss of $5.78 billion but spiked higher by 8% over the day. In other words, investors have now taken into account the bad news and they’re now looking forward to the future rather than fretting about the past.

There has been a lot of press lately about the fact that the GOFO (gold forward offered rate) has gone negative. The Gold Forward Offered Rate (GOFO) is the rate used for gold/U.S. dollar swap transactions.

That is, if you own gold and you need to borrow dollars, you can use your gold as collateral and pay a much smaller rate of interest to borrow the cash than otherwise. This is a common transaction in London. The LBMA (London Bullion Marketing Association) publishes the GOFO daily.

A 10 July article on Seeking Alpha said that:

The only reason a negative GOFO would occur is if someone desperately needs to get their hands on gold but thinks they’ll be able to return it within the time frame of the loan. A negative rate out to three months tells us that there’s a big delivery shortage and bullion banks or large investment funds are willing to pay an interest rate to borrow gold and put up dollars as collateral.

The Time to Look at Gold is Now

If some big investors are finding it hard to get their hands on physical gold then we shouldn’t be surprised to see the gold price starting to catch a bid. A negative GOFO rate is a bit of a canary in the coal mine that something big could be happening behind the scenes that we aren’t privy to.

You’ve probably heard the conspiracy theory that traders took down gold over the past year to shake as many weak hands out of physical gold as possible. It has also been pretty clear that demand for physical gold has actually been skyrocketing the lower prices have fallen. Not really what you would be expecting to see at the end of a bull market.

Gold stocks have had one of the biggest crashes I have seen in many years. The Aussie Gold Mining index fell from 8,500 to 2,000 in a little over two years. That’s a fall of 76% in the whole index in 26 months! Quite extraordinary.

With margins dropping to zero for most gold stocks we’re either heading to a situation where gold mines will begin to get mothballed or gold prices will have to rise to a level where production can continue to fulfil demand. In either situation we should be getting close to a low in gold prices, because if a lot of production goes offline then prices should naturally rise.

Any gold stock that’s producing in the bottom quartile and priced on the current razor thin margins has got to be looking pretty cheap right here.

It’s pretty clear from yesterday’s price rises that other investors are starting to think the same thing. The opportunity is still there but it won’t last forever.

Murray Dawes+
Editor, Slipstream Trader

Join Money Morning on Google+

From the Archives…

Should You Still Buy Stocks Here? Yes, but…
09-08-2013 – Kris Sayce

The Secret to China’s $7 Billion Milk Market
08-08-2013 – Nick Hubble

RBA (Retirees Below Average)
07-08-2013 – Vern Gowdie

Have Australian Stocks Broken Free from China?
06-08-2013 – Kris Sayce

When Should You Sell Your ‘Loser’ Stocks?
05-08-2013 – Kris Sayce

Technical Overview on the Forex Majors before the Show

Article by Investazor.com

As we wrote in our post “What is to be Expected Next Week for the Forex Market?” this week’s economic calendar will be more crowded starting with Tuesday. Today the most important data came from Japan. It’s GDP rise only 0.6%, despite the expectations of 0.9%.

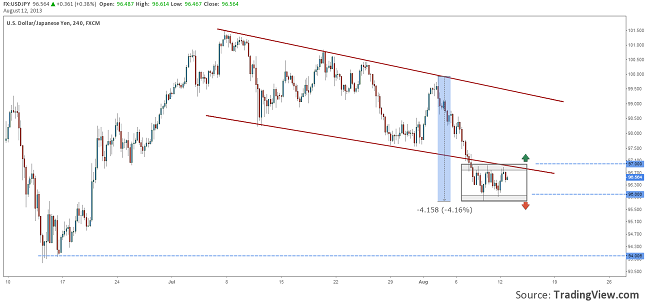
USDJPY has consolidated between 96.00 and 97.00 after a falling 4.16% from almost 100.00. The drop broke the rejection line of the down trend and started to draw a rectangle. From the current price action the higher probability is on the down side. A 240 minutes candle close under 96.00 could trigger another drop which will target the 94.00 level.

A recovery of the US dollar would mean a breakout above the 97.00 level. If this will occur we should look also for a close, to have a certain confirmation. On this scenario, the upper target sits around 98.50.

usdjpy-consolidated-under-rejection-line-12.08.2013

Chart: USDJPY, H4

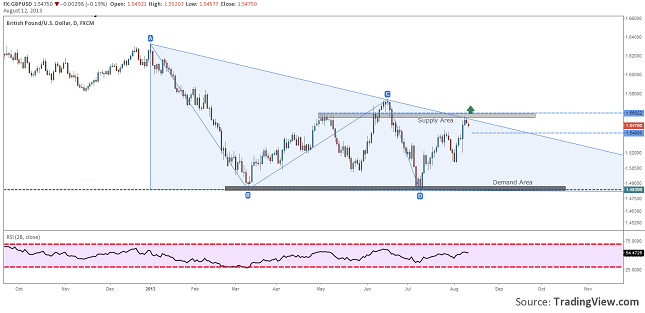
Next is GBPUSD. This currency pair had an interesting evolution during the past moves. The up move was not straight but the price managed to get back to 1.5600. Here it has found a pretty good supply enforced by the round level and a down trend’s line.

Looking at the price action from January 2013 we will observe a consolidation that resembles pretty much with a Descending Triangle. This pattern would be confirmed only by a breakout under its base line or above the upper line. At the current moment the most probable would be a break above the upper line. If the price falls under 1.54 then we should look for a target around the demand area at 1.4840.

gbpusd-forcing-the-upper-line-12.08.2013

Chart: GBPUSD, Daily

A good technical image for AUDUSD would give us the 240 minutes time frame. Here we spot two converging lines that were respected by the fall of the price. On Friday, the trend line was broken, but because the price did not go too far, it was quickly retested today.

At this point we can say that the Australian dollar it is at a cross road. Even though it broke an important line, a fall back under it could signal a false breakout, which will end up with a drop. If the US dollar will not strengthen during the next days we should see a break above the 0.9215, the local resistance, and by the end of the week a retest of the demand/supply area from 0.9300.

audusd-consolidated-above-trendline-12.08.2013

Chart: AUDUSD, H4

And we got to the most traded currency pair in nowadays, EURUSD. For the past month the single European currency has gained 5%. The rally seems to have stopped for the moment at 1.3400. The price was bounced back to 1.3300. At this point EURUSD is on thin line. A daily close under 1.33 could start a bigger corrective move, targeting 1.3200 or even lower.

On the other hand if the price will rally back to 1.34, the probability for a breakout from under this level will be even higher.

The trend is up as long as there are no clear reversal signals, but do not forget that the evolution of the US dollar is very sensible to the economic news published for the United States and especially those from the labor market. The better the news, the close Fed will get to tapering and shutting down the Quantitative Easing program.

eurusud-rallied-one-month-12.08.2013

Chart: EURUSD, Daily

The post Technical Overview on the Forex Majors before the Show appeared first on investazor.com.

Is the Baby Bust Over?

By The Sizemore Letter

Americans stopped having babies when the financial crisis hit in 2008.

I exaggerate, of course; there were nearly 4 million babies born in 2012.  Yet this number was an 8% decline over the pre-crisis level, and this despite a rise in the number of women of peak childbearing age.

When you look at the fertility rate (births per 1,000 women aged 15-44), which takes into account the rise in the number of women in peak childbearing age, the story looks a lot worse.  American fertility hit a new all-time low in 2011, at barely 63 births per 1,000 potential mothers.

Those of us who are not professional demographers have a hard time conceptualizing  “births per 1,000 women,” but the “total fertility rate” is a little easier to understand.  This is the total number of children the average woman can expect to have over her lifetime.  In the developed world, the “replacement” rate is 2.1 babies per woman.

By this measure too, American fertility had sunken to new recent lows at 1.9 babies per woman.  As I wrote last year, the American birthrate—long the pride of red-meat-eating Americans—is below the level of France.  France!

If you’ve read my work for any length of time, then you know I believe this trend to be temporary.  The Baby Boomers of the 1950s and 1960s had a baby boom of their own in the 1980s and early 1990s.  Now this generation—alternatively called the “Millennials,” the “Echo Boomers” or “Generation Y”—are entering their family formation years, and you can expect another baby boom as a result.  The sheer number of potential mothers makes it all but inevitable.

New birth data suggests that the post-crisis baby bust may be ending.  Preliminary data for 2012 shows births and the birth rate essentially unchanged from 2011 after declining every year since 2007.

This is a big deal.  And let me tell you why.

Children and family formation have a massive, disproportionate effect on the economy.  There are the obvious beneficiaries—makers of everything from diapers to baby formula to cribs—but the most important effects show up elsewhere.

Consider housing.  Before my first son came along, I was living the life of a frivolous urbanite, renting an uptown apartment and happily avoiding the responsibilities of homeownership.  Today, I own a house in the suburbs…along with the mortgage albatross hung around my neck.   I even have a tree swing in the front yard…and a bouncing house with a slide in the back.

The point here should be clear: an uptick in the birthrate should mean a boom in the starter home market, which in turn means a return to normalcy for banks.  This is a sustainable, virtuous cycle that has yet to really begin.  Get ready for it.

Less directly—though by no means less importantly—are harder-to-quantify metrics such as productivity.  I’m more productive that I was pre-kids.  I have no choice.  I have hungry mouths to feed.

Before you dismiss the last point as fluff, consider that the biggest productivity boom (and consequently the biggest drop in inflation) in the lifetimes of anyone reading this article came in the early 1980s, as the Baby Boomers were in the early stages of their family formation cycle.  Yes, Fed monetary policy under Paul Volcker had a lot to do with the drop in inflation.  But don’t underestimate the long-term effects on productivity growth. of the Baby Boomers getting haircuts and real jobs.

Generation Y’s peak birth year was 1990.  The average age of mother at first birth is around 26 years…which is a number that continues to rise due to would-be mothers staying in school longer and getting a larger share of advanced degrees.

So, doing a little math here, we can add 26 to 30 years to 1990 and come up with an estimate for a boom in new mothers peaking in the years 2016-2020.

All babies are roughly equal in terms of demand for staple items like formula, diapers and clothes.  But first babies are more economically significant than their later siblings because they are the ones that force their parents’ lifestyle change.  If I may oversimplify a little, they are the reason we buy homes and furnish them.

What are we to do with this information?

You could buy shares of infant formula makers such as Abbot Labs ($ABT) or Mead Johnson ($MJN), of course.  Though being global companies, these companies tend to be as affected by births in China as births here in the United States.  And you could also buy shares of diaper producers such as Procter & Gamble ($PG) and Kimberly-Clark ($KMB), though the same logic applies.

For more direct exposure to an American baby boom, consider buying a portfolio of starter homes with a goal of eventually selling out to a Gen Y family in a couple years.  Or better yet, consider starting a new business that caters to new mothers and their kids.

You want some examples of low-hanging fruit?  How about a website with product reviews of strollers, cribs and other baby products with an online store that links to a major retailer like Amazon ($AMZN)?  It is a business with very little in start-up costs and a manageable amount of “sweat equity.”

Or better yet, start a handyman service for assembling baby gear to save fathers like myself hours of late nights of cursing and reading undecipherable instruction manuals upside down.

Disclosures: Sizemore Capital is long ABT, MJN, PG, and KMB

See also:  U.S. Births “essentially unchanged” in 2012 after Declining for Four Consecutive Years

SUBSCRIBE to Sizemore Insights via e-mail today.

Join the Sizemore Investment Letter – Premium Edition

New York subpoenas Bitcoin firms in probe over criminal risk

New York subpoenas Bitcoin firms in probe over criminal risk (via Futures Magazine)

New York’s top banking regulator sent subpoenas to 22 digital currency companies, including BitInstant and Dwolla, to determine whether new regulations should be adopted to govern the emerging industry, according to a person familiar with the matter…

Continue reading “New York subpoenas Bitcoin firms in probe over criminal risk”

The SP 500 Enters Major Correction Period

Market close to confirming new correction

David A. Banister- www.markettrendforecast.com 1685 support is KEY!

The SP 500 has been on a tear since late 2012 with the SP 500 bottoming at 1266. The rally though we have been charting out as part of a “Primary wave 3″ uptrend for this Bull market cycle from March 2009, and we are likely entering a Major correction or what we would label “Major wave 4″. Since the 1266 lows, we have had Major Wave 1, 2, and now 3 completed at 1710. We are entering Major wave 4 which should correct 23-38% of the entirety of Major wave 3, which was 444 points.

This correction will be confirmed with any close below 1674 and nails in the coffin begin with any close below 1685 on the SP 500 index. Primary wave 1 of this super bull cycle ended at 1370, a 704 point rally. Primary wave 3 will likely be larger than Primary wave 1 and I am projecting a top between 1900-2000 on the SP 500 before it’s completed. The current correction is Major wave 4 of Primary wave 3, which has 5 Major waves required. With that said, our projections are for 1605 on the shallow side and 1540 on the deeper side for Major wave 4 of Primary wave 3.

Now it is possible that we may extend a bit higher yet in Major wave 3 to 1736-1772, but only if we hold the 1685 support lines which the market is basing around currently. In any event, at our Trading service we have been aggressively taking profits in the past two weeks on multiple positions while still holding a few open at this time.

Below is a chart showing our projected correction pivots of 1605 and 1540, subscribers will be updated on a regular basis. Join us with a 33% discount at www.markettrendforecast.com and also receive Precious Metals (GOLD) forecasts on a regular basis every week.

812 SP 500


Written by David A. Banister- www.markettrendforecast.com