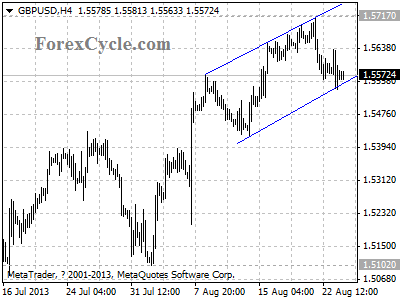
GBPUSD is facing channel support

GBPUSD is facing the support of the lower line of the price channel on 4-hour chart. A clear break below the channel support will indicate that the uptrend from 1.5102 had completed at 1.5717 already, then deeper decline to 1.5400 area could be seen. On the upside, as long as the channel support holds, the fall from 1.5717 would possibly be consolidation of the uptrend from 1.5102, one more rise towards 1.6000 is still possible after consolidation.

gbpusd

Provided by ForexCycle.com

Lies, Damned Lies and the US Unemployment Data

By MoneyMorning.com.au

Only one letter separates the words ‘paper’ and ‘taper’.

And yet, in the financial world the difference between a P or a T is massive.

After last week’s release of July’s FOMC Meeting Minutes, Wall Street thinks there is no real intention to quit the printing of paper just yet. Paper wins.

Maintaining the same massive dose of adrenalin or slightly reducing the rate is academic. The Great Credit Contraction has damaged the economy’s organs and the stimulants are only masking the deeper problem.

The US Federal Reserve has indicated arbitrary targets of 6.5% unemployment and a 2% annual increase in consumer prices as the signals it wants to see before slowing down the printing presses.

Here is an extract from the FOMC Minutes:

First, almost all participants confirmed that they were broadly comfortable with the characterization of the contingent outlook for asset purchases that was presented in the June post meeting press conference and in the July monetary policy testimony.

Under that outlook, if economic conditions improved broadly as expected, the Committee would moderate the pace of its securities purchases later this year. And if economic conditions continued to develop broadly as anticipated, the Committee would reduce the pace of purchases in measured steps and conclude the purchase program around the middle of 2014. At that point, if the economy evolved along the lines anticipated, the recovery would have gained further momentum.

Basically if (and that’s a big if) the economic outlook as measured by employment and inflation improve, then the Federal Reserve will taper.

Here’s what they had to say about the employment situation:

Committee members viewed the information received over the intermeeting period as suggesting that economic activity expanded at a modest pace during the first half of the year. Labor market conditions showed further improvement in recent months, on balance, but the unemployment rate remained elevated.

Oskar Morgenstern, the author of On the Accuracy of Economic Observations,best described the compilation of economic data as ‘these numbers are a complex amalgam of errors in the parts whose magnitude is not easily determined.

According to the Federal Reserve Economic Data (FRED), the unemployment rate is headed in the right direction – falling from 10% to 7.5%. This is the headline number the ‘talking heads’ wax lyrical about and point to the jobs recovery in the US:

There are lies, damn lies and statistics. The US unemployment data is a statistic – this is the biggest lie of all because it’s an official lie.

The US unemployment rate doesn’t include those who have given up looking for work or those who have moved to disability pensions.

The next chart shows a drop of 2.5% (since the GFC) in the number of people participating in the US labour force. There are many reasons why people give up looking for work (despondency, retirement, ill-health, working in the cash economy etc.), however, you see how the data can be massaged to produce certain outcomes.

In an effort to ‘keep the bastards honest’, John Williams at www.shadowstats.com produces an Alternate Unemployment chart. The methodology behind the chart’s compilation is:

The seasonally-adjusted SGS Alternate Unemployment Rate reflects current unemployment reporting methodology adjusted for SGS-estimated long-term discouraged workers, who were defined out of official existence in 1994. That estimate is added to the Bureau of Labor Statistics’ (BLS) estimate of U-6 unemployment, which includes short-term discouraged workers.

The red line – the U-3 unemployment rate – is the official number.

The grey line – the U-6 unemployment rate – is the Bureau of Labor Statistics’ broadest unemployment measure. It includes those who are short-term discouraged, under-employed (part-time but would like more hours) and the unemployed.

The blue line – is shadow stats calculation – uses the official U-6 number plus the long-term discouraged workers who are no longer counted in the official data.

In the interest of fairness let’s assume the truth of US un- and under employment lies somewhere between the grey and blue line – around the 18-20% mark.

Employment is the vital organ I referred to earlier. If a greater number of people don’t have sufficient disposable income or the capacity to borrow, how do you revive a consumption based economy?

If the recent disappointing profit announcements from Target, Wal-Mart and Macy’s are any guide, the answer is ‘with great difficulty’.

Bernanke and co may have a 6.5% official figure in mind, but if the number is just a statistic and not reality, then it doesn’t alter the course of the underlying economy.

Paper or Taper?  Well here it is straight from the donkey’s mouth (again, emphasis is mine):

At the conclusion of its discussion, the Committee decided to continue adding policy accommodation by purchasing additional MBS at a pace of $40 billion per month and longer-term Treasury securities at a pace of $45 billion per month and to maintain its existing reinvestment policies. In addition, the Committee reaffirmed its intention to keep the target federal funds rate at 1⁄4 percent .

The Federal Reserve has no intention of changing its ‘print and suppress’ experiment.

This paper or taper caper may make the traders twitchy, but for long term, patient investors the end game will still be the same – quality shares at substantially discounted prices await us.

Vern Gowdie+
Editor, Gowdie Family Wealth

Join Money Morning on Google+

From the Archives…

How Many Warren Buffett’s in a Bar of Gold?
16-08-2013 –  Kris Sayce

Two Points to Consider from the Commonwealth Bank…
15-08-2013 –  Kris Sayce

Take Control of Your Superannuation, but Know the Limits
14-08-2013 – Vern Gowdie

Why I’m Glad I Missed a Dividend Stock That Doubled…
13-08-2013 – Kris Sayce

No Profit in the Federal Reserve Divination
12-08-2013 – Dan Denning

Why I’m Certain Stocks Are Going Higher

By MoneyMorning.com.au

We’ve made a lot of enemies in recent months.

Most of those enemies are folks who hate that we’re bullish on stocks.

We think they started reading Money Morning when we were bearish on stocks. So now they don’t like it that we’re trying to exploit the Aussie stock rally by buying stocks.

Maybe they’re angry at missing out on the stock rally.

Or maybe there’s a misunderstanding. After all, just because we say it’s a great time to buy stocks doesn’t mean we’re ignoring the big problems facing the world economy.

So, to prove that we understand the risks in the market – and to make sure you understand them too – the newest member of our team, Vern Gowdie, joins Money Morning each day this week.

You’ll read his take on the state of the economy below. Vern’s view is that you shouldn’t buy stocks…or not yet anyway. But first, we’ll give you our slant on the latest stock action…

If you’ve read Money Morning in recent weeks you’ll know we’ve gotten more cautious on Aussie stocks as the S&P/ASX 200 trades above the 5,100-point level.

We’re cautious because each time the index has traded around this level since 2010, stocks have fallen. It has already happened several times this year.

But at some point (perhaps this time) our bet is stocks will successfully burst through this key level. And once they do, it’ll be a race to 7,000 points.

But why should this time be any difference? And why hasn’t it already happened?

Stock Markets Set to Rally as Fears Decline

If things are as positive for stocks as we suggest, why couldn’t the market keep going higher the last time it hit this level?

The quick answer is: that’s just how markets are.

Remember that millions of Aussie investors make up the Australian market. On any given day they act and react according to the latest news filtering through the market.

Some days it’s good news, other days it’s bad news.

Usually bad news means that stocks will fall. And a constant stream of bad news can lead to big falls. Such as the big fall from mid-May through to the end of June.

But at some point the market starts to react to the bad news in the same way as the villagers reacted to the boy who cried wolf.

Investors hear the bad news, but the Sun shines, the electricity still works, and for most people, they’ve still got a job. As far as they can see, nothing is wrong.

So they stop listening to the bad news and assume that things are bound to get better. That can lead to rising stock prices.

Of course, if you know the story about the Boy Who Cried Wolf, the villagers made a bad choice by ignoring his final warning.

And that’s why we don’t want you to completely ignore the warnings (hence why we’re publishing Vern Gowdie’s alternative market view this week).

The investors who will get in the most strife during the next market collapse are those investors who ignore all the bad news.

Those are the investors who tend to put every last cent of their savings into stocks without thinking of the risks.

Naturally, they tend to do that near the top of the market. And then they sell near the bottom of the market.

Saying that, there is a time when you should consider buying near a market top. And in our view that time is now.

Because although it’s important that you pay attention to the warnings, you can’t let it get in your way of making money…

Orderly Queue to Become a Rampage

We’ll show you why with this chart of the S&P/ASX 200:


Source: CMC Markets Stockbroking

Now, we won’t claim to be a charting expert. We leave that lark to our technical trading guru Murray Dawes.

But the way we read the chart is that the market is consolidating into a range near this key level (above 5,000 points).

This tells us that broadly speaking, investors are starting to have a positive take on the future. Put another way, stocks haven’t rallied 10% in just a few weeks because investors are nervous.

The one thing that’s missing is the catalyst and confidence booster that will cause investors to buy stocks at these and even higher prices.

When that catalyst arrives (whatever it is) the orderly queue that’s currently forming will disappear and will turn into a rampage as investors rush to buy stocks.

That’s why we’re still buying stocks here, even though the market is at an extremely risky level.

Of course, there’s no guarantee the picture we’ve laid out will happen. If the catalyst doesn’t appear then you could see a repeat of the May to June fall.

But we’re prepared to go out on a limb. Don’t put everything you’ve got into the market, but make sure you’ve got some exposure to stocks and make sure you can add to your position quickly if we’re right and stocks keep moving higher.

Cheers,
Kris+


Join Money Morning on Google+

From the Port Phillip Publishing Library

Special Report: The Sixth Revolution

Daily Reckoning: The Global Trend Towards Wealth Protection

Money Morning: Two Approaches to Investing…

Pursuit of Happiness: Learning to Avoid the Governments ‘Noble Wealth Trap’

Australian Small-Cap Investigator:
How to Make Big Money from Small-Cap Stocks

Unsexy Profits

By Investment U

What’s cooler than smartphones? Industrial strength fluid pumps, energy exploration gear, commercial refrigeration and bar codes. That’s what!

At least, that’s what Dover (NYSE: DOV), an industrial manufacturing company founded in 1947, says. It will be selling its communication and technology division that supplies parts for the two hottest smartphone manufacturers in the biz, Apple and Samsung.

In an age when everyone is carrying a smartphone, it seems counterintuitive to be leaving the business now. But Dover says it wants to focus on the more predictable segment of its business that has better and more reliable long-term profit potential over the sizzle of smartphones.

And profits are exactly what this company has delivered and will continue to deliver for a long time.

DOV has bulked up on its energy-related businesses in a division that specializes in bringing gas and oil to the surface known as artificial lift. In just five years it has gone from $250 million in sales to $1 billion.

And artificial lift, according to Oakmark Equity and Income fund manager Colin Hudson, has a long runway and recurring revenues. He puts the stock value at $100, 17% above its current price.

The other totally not sexy division DOV has that has huge potential is doors for commercial refrigeration – supermarket cases. No sizzle here!

The market for unenclosed cases in North America has an estimated value of $2.5 billion. This division alone, year over year, added 26% to DOV’s bottom line last quarter.

Here’s a stockholder-friendly company that has raised its dividend for the past 57 years, recently spent $1 billion in stock buybacks, raised both EPS and revenue estimates for this year, and is doing it all in markets that are more predictable, have greater and longer earning potential and more stable earnings than the darlings of the money press, smartphones.

They aren’t flashy, and they are getting even less flashy, but you can’t argue with their numbers.

An Airline That Gets It

This next company’s story is so funny and is such a great investment, it is both the second idea this week and our slap-in-the-face winner.

The company is Ryanair (Nasdaq-GM: RYAAY). It’s run by a guy named O’Leary from Tipperary. I know, this sounds like an Irish joke, but this guy O’Leary is my kind of CEO.

When he opened a new air route to Rome he greeted customers to the first flight dressed up as the Pope.

He has railed against overweight passengers on airplanes and wants to charge them more because they cost more to haul through the air.

He wants to charge to use the bathrooms on his planes and wants to remove one of the two bathrooms on short flights, less than 75 minutes, to add more seats. He figures one toilet is enough.

He throws temper tantrums and rails against anyone who gets in his way. Specifically, politicians, regulators, labor unions, competitors and, his favorite target, pilots.

Nothing is below this guy, and he says all of these antics are PR stunts. He will do anything to get people on his planes.

And it is working.

Ryanair is now the biggest airline in Europe, and travelers are flocking in increasing numbers. It serves almost 80 million flyers a year and is expected to run that number up to 108 million very soon.

Not bad for a company run out of a country of less than 5 million people.

Last year it reported a 13% jump in net income and a 13% rise in revenues, and it is expected to see the same percentage increases next year.

The stock price has doubled in the last year but, based on the projections, is cheap and has lots of upside.

O’Leary’s model is Herb Kelleher, the founder of Southwest Airlines, who stood the airline industry on its head with his no-frills, cheap fares. It is my preferred airline. I like the no-nonsense approach and the cheap fares.

O’Leary describes himself and his company as a bunch of Irish peasants who will stand on their heads to save a sixpence. I think that’s less than a nickel.

His great joy now is that he can’t hire any more people. He says they have nowhere to sit. This is what he calls controlling costs.

O’Leary’s next target is Aer Lingus, which he says is a money pit. He says he can make it work and make money. The regulators haven’t given the go-ahead – not yet.

By the way, the idea to remove one of the bathrooms on his aircraft will result in a 5% reduction in ticket prices.

I have only known a few like O’Leary, but I know this about his type: They get what they want and they don’t care what they look like getting there.

Take a look at Ryan Air.

Article By Investment U

Original Article: Unsexy Profits

New Free Investor Report: 3 Dangerous Myths About Rising Bond Yields

Greetings Investor,

Now that interest rates are up 100% and bonds are down 20%, pundits are jumping aboard the forecast for rising yields.  But they are missing the most important parts of the story for investors: why yields are rising, and what that says about prosperity (it undercuts it dramatically) and inflation (think the opposite).

Elliott Wave International has just released a new report titled 3 Dangerous Myths About Rising Bond Yields to get the word out about the scenario most investors don’t even know is looming.

You cannot get this story from any other source – except from EWI.

Please learn more about this eye-opening new resource. The realities behind the myths are dangerous only to the investors who are unprepared. And you do not want to be a part of that herd.

Prepare yourself now – download this short free report from EWI today >>


About the Publisher, Elliott Wave International
Founded in 1979 by Robert R. Prechter Jr., Elliott Wave International (EWI) is the world’s largest market forecasting firm. Its staff of full-time analysts provides 24-hour-a-day market analysis to institutional and private investors around the world.

Fed determines global financial cycle – Jackson Hole paper

By www.CentralBankNews.info     (Following is the fourth and final report based on papers presented at the 2013 Jackson Hole Economic Policy Symposium, hosted by the Federal Reserve Bank of Kansas City. The reports have been published as soon as the authors presented their papers to the symposium.)

    A global financial cycle, mainly determined by U.S. monetary policy, constrains national monetary policies when capital is freely mobile regardless of the exchange rate regime, according to a paper presented at the Jackson Hole symposium by Helene Rey of the London Business School.
    In her paper, “Dilemma not Trilemma: The Global Financial Cycle and Monetary Policy Independence,” Rey shows how global capital flows, asset prices, credit growth and financial leverage tend to move in sync with the VIX, the ticker symbol for the Chicago-traded index that measures uncertainty and risk aversion in financial markets.
   The VIX thus becomes a proxy for a global financial cycle that is independent of countries’ specific economic conditions. The symptoms of the cycle can be benign or large asset price bubbles and excess credit growth, one of the best predictors of financial crises.
    “Low value of the VIX, in particular for long periods of time, are associated with a build up of the global financial cycle: more capital inflows and outflows, more credit creation, more leverage and higher asset price inflation,” Rey says, adding that asset markets with more credit inflows tend to be more sensitive to this global cycle.

    Particularly striking, says Rey, is the consistency of this global factor with the timing of major events, such as the Gulf War from the second half of 1990 and the first quarter of 2009 when the global financial crises reached its climax.
    Overall, the index rises from the early 1990s until mid-1998 when the Russian crises erupts and eventually the bursting of the dotcom bubble. From the beginning of 2003, the index increases rapidly until the beginning of the third quarter of 2007.
    Rey then looks at other studies to see how the VIX is related to banks with significant trading operations and finds a positive feedback loop between greater credit supply, asset price inflation and compression of spreads. Smaller risk premiums then amplify the credit boom and contributes to the procyclicality of credit flows, which then contributes to a build-up of financial fragility.
    Given this procyclicality of credit flows and the way global banks operate, Rey looks at the effect on the global financial cycle of the cost of finance in dollars, i.e. the Federal Reserve’s monetary policy.
    “The dollar is the main currency of global banking. Since surges in capital flows – especially credit flows – are associated with increases in leverage worldwide, a natural interpretation is that monetary conditions in the centre country are transmitted worldwide through these cross-border gross credit flows,” she says.
    To fully understand this interaction between U.S. monetary policy, risk aversion and uncertainty, leverage and credit flows, Rey builds on earlier work by other economists and analyses the relationship between the VIX and growth, inflation, forms of credit, leverage and the federal funds.
    “When the Federal Funds rate goes down, the VIX falls (after about 5 quarters), European banks’ leverage rises, as do gross credit flows (after 12 quarters),” she says.
    This helps set up a positive feedback loop between loose monetary policy, a fall in the VIX, a rise in credit, capital flows and leverage and then a further fall in the VIX.
    Economists have long understood how capital flows creates booms and busts in emerging markets and advanced economies.
   But what Rey adds to our understanding is how capital flows, credit growth and leverage are part of a global financial cycle that is largely determined by monetary policy is the U.S.
    This finding allows her to question the so-called “trilemma, ” a popular concept in international economics that says in a world of free capital mobility, independent monetary policies are feasible if and only if exchange rates are floating.
   “Instead, while it is certainly true that countries with fixed exchange rates cannot have independent monetary policies in a world of free capital mobility, my analysis suggests that cross-border flows and leverage of global institutions transmit monetary conditions globally, even under floating exchange-rate regimes,” Rey says, adding:
    “The “trilemma” morphs into a “dilemma” – independent monetary policies are possible if and only if the capital account is managed, directly or indirectly, regardless of the exchange-rate regime.”
   The relevance of Rey’s work has immediate policy implications.
    Last month, for example, India’s central bank described how it was currently caught in the “impossible trinity trilemma” by having to tighten, rather than loosen, monetary policy in order to tackle the challenge of capital outflows and a falling rupee.
   For years, the total free flow of capital across borders was a basic tenant of economic thinking.  However, in recent years this belief has begun to wane, especially in emerging markets, and even the International Monetary Fund has acknowledged that a free flow of capital is not always the best option for every country.
    Looking at the effects of the massive rise in cross-border investments from 1980 to 2007 in both advanced and emerging markets, Rey find surprisingly little impact on economic growth.
    “I do not claim that there are no benefits to international financial integration, only that they have been remarkably elusive so far given the scale of financial globalization the world has undergone,” she said.
    While she acknowledges that the gains from the free flow of capital may be hard to measure, it is still puzzling to her why it hasn’t shown up in growth rates and she concludes that any such gains really can’t be taken for granted.
    If the welfare gains from free flow of capital are unclear and the global financial cycle tends to lead to financial instability, Rey questions how to weaken the potency of the global cycle.
    Methodically, she examines four options but dismisses the option of acting on the source of the financial cycle itself: the monetary policy of the Fed and other major central banks.
    The monetary conditions in the major advanced economies shape the global financial cycle through leverage and credit growth that is transmitted worldwide via flexible exchange rates.
   As international cooperation in the monetary sphere conflicts with central banks’ domestic mandates, the next best option is for those central banks to pay more attention to the implications of their policies for the rest of the world.
    Citing a proposal by the respected economist Barry Eichengreen, Rey says a small group of systemically significant central banks should meet regularly at the Bank for International Settlements (BIS), discuss the implications of their policies and issue a short report that may “encourage central bankers to internalize some of the external spillovers of the policies.”
    Rey proposes that the most appropriate policies would be to take action directly aimed at the source of excessive leverage and credit growth. This includes a combination of aggressive stress-testing, tougher leverage ratios, and in some cases capital controls.

   www.CentralBankNews.info

Portfolio flows fuel global liquidity – Jackson Hole paper

By www.CentralBankNews.info

    (Following is the third of four reports based on papers presented at the 2013 Jackson Hole Economic Policy Symposium, hosted by the Federal Reserve Bank of Kansas City. The reports will be published as soon as the authors present their papers to the symposium.)
    The sharp movement in emerging markets’ exchange rates in recent months is partly because the flow of money from investors’ portfolios have taken on the character of global liquidity, according to a paper delivered at the Jackson Hole symposium.
    The rise of global banking has brought the world closer to being a single financial system, fueled by cross border liquidity that is created by private financial entities, such as major banks and investment funds, and central banks.
    Traditionally, the direction of global capital flows was mainly driven by differences in expected returns and this in turn was based on a mix of growth and monetary policy expectations, according to Jean-Pierre Landau, former deputy governor of the Bank of France, in his paper “Global Liquidity: Public and Private.”
    In the decade prior to the global financial crises, the flow of wholesale banking capital acted as the artery of global financial markets. A large part of cross-border funding took place between the head office and foreign offices of a bank – almost like an internal centralized funding model in which available funds are deployed globally through centralized allocation decisions.

    Portfolio flows used to be more stable, driven by economic fundamentals, and there is still a prominent view that growth perspectives are the main determinants behind the inflow of capital into emerging markets.

    However, Landau finds that portfolio flows have become more volatile, with higher frequency and shorter cycles as compared with banking flows. This is in contrast with foreign direct investment that has been relatively stable.
    Portfolio flows into emerging markets turned negative at the onset of the global financial crises, then surged in 2009 and 2010 as emerging market economies recovered and then dried up again in the second half of 2011 as Europe’s crises intensified and global risk aversion rose before picking up again as financial stress eased in Europe, improving investor sentiment.
   “The flows seem to be driven more and more by global risk appetite and, to a lesser extent, interest rate differentials,” Landau said, referring to studies that show that the sensitivity of portfolio flows to policy rate differentials and to risk aversion appears to have increased during the post-crises period whereas in the pre-crises period growth differentials were relatively more important.
    Part of this change may be due to the growing importance of open ended funds dedicated to emerging markets that allow investors to move in and out quickly, making it easier for retail and institutional investors to arbitrage between advanced and emerging countries risky assets.
    With risky assets in emerging markets becoming more substitutable with those in advanced economies, it has amplified the spillover from monetary policy in advanced countries, he said.
    Extraordinary low interest rates and unconventional monetary policy in advanced countries also means that risk appetite has played an even bigger role than usual in influencing the direction of private liquidity, magnifying global liquidity spillovers.
    Although portfolio flows remain relatively modest compared with foreign direct investment and banking flows, Landau says these flows represent the “marginal investor, the one that instantly determines the market equilibrium and its price, with huge impact in times of stress when market liquidity dries up.”
    The funds offer some liquidity to investors who want to redeem their money if they sense a crises.
    “However, valuations may fluctuate and this can create or stimulate runs when risk perceptions shift,” said Landau, adding that the combination of risk sensitivity and a fairly “narrow exit” creates the conditions for such runs and provides a partial explanation for the sharp movement in emerging market exchange rates after the Federal Reserve in June said it was planning to wind down quantitative easing.
    This heightened sense of sensitivity to risk perceptions will complicate the task of exiting from ultra-easy monetary policy, necessitating very close and constant dialogue and cooperation between central banks, said Landau, a deputy to the Group of Seven (G7) and Group of Twenty (G20).
    “In the longer run, policy choices on global liquidity will determine the shape of global capital markets, as they will orient countries’ incentives in opening and deepening (on not) their financial systems,” said Landau.
    Faced with increased volatility, Landau said some countries may decide to protect themselves from the capital flows and this could lead to a fragmentation of the international financial system.
   “It may be natural that, after a period of opening and increase in gross asset positions, there would be some retrenchment, as signaled by the shift towards a more “local” model of banking in many countries and the acceptance of capital controls as part of overall macro prudential toolkit,” he said, adding:
    “There may be no other choices in the short run as consequences of explosive dynamics of global liquidity are very apparent.”
    In the long run, however, such a segmentation may be harmful as imbalances in savings, public debt and financial deepening can be better managed in an open financial environment, he adds.

What Those Collapsing Homebuilder Stocks Are Trying to Tell Us

By Profit Confidential

 housing marketFinally, some good news for the U.S. economy?

The National Association of Realtors (NAR) just reported July existing-home sales increased in the U.S. housing market to an annual rate of 5.39 million homes—up 17.2% from July of 2012. (Source: National Association of Realtors, August 21, 2013.)

And those companies that are closely related to the housing market like The Home Depot, Inc. (NYSE/HD) and Lowe’s Companies Inc. (NYSE/LOW) reported better-than-expected second-quarter earnings. All these companies cited the housing “recovery” as the reason their earnings did better.

So does this mean it’s a good time to buy homebuilder stocks, or to jump into companies related to the housing market? My answer is a resounding, “NO.”

In fact, the housing market is flashing four warning signs that the so-called “recovery” is losing steam.

First-time home buyers are not entering the housing market. Last month, first-time home buyers accounted for only 29% of all existing-home sales in the housing market, down 15% from July 2012. In a normal market, you’d want t first-time home buyers to account for 40% of all sales.

Mortgage rates are rising quickly. The rate on the standard 30-year fixed mortgage hit 4.6% this morning—up sharply from about 3.5% at the beginning of 2013

For months (in these pages), I’ve been saying interest rates would start to creep up. Even the NAR acknowledges the problem with higher interest rates. Its chief economist, Lawrence Yun, said this week, “Mortgage interest rates are at the highest level in two years, pushing some buyers off the sidelines…the initial rise in interest rates provided strong incentive for closing deals. However, further rate increases will diminish the pool of eligible buyers.” (Source: Ibid.)

The slowing U.S. economy, as evidenced by meager corporate earnings and revenue growth, coupled with jobs growth principally in the low-paying retail and service sectors, will put pressure on the housing market.

Finally, the homebuilder stocks that make up the Dow Jones Home Construction Index, a leading indicator, have been taking it on the chin. This bellwether index is down 25% from the middle of May.

The “recovery” in the U.S. housing market has been nothing like a normal post-bust housing recovery. We’ve had financial institutions come in and buy empty homes at an unprecedented rate and quantity, then renting them out for profit. That’s a temporary fix for the housing market, because these homes will come back onto the market as interest rates rise and these investors shift their capital to higher-return investments. Historically, homebuilder stocks have been a great leading indicator of the housing market. Their recent collapse should be an important warning sign for investors.

Michael’s Personal Notes:

Wednesday’s release of the much anticipated Federal Open Market Committee (FOMC) meeting minutes basically said the Federal Reserve will continue to run its printing presses at the same speed at which they have been running since late last year—until further notice.

So when will the Fed pull back on its $85.0-billion-a-month quantitative easing program?

It depends on economic conditions. The meeting minutes said “…if economic conditions improved broadly as expected, the Committee would moderate the pace of its securities purchases later this year. And if economic conditions continued to develop broadly as anticipated, the Committee would reduce the pace of purchases in measured steps and conclude the purchase program around the middle of 2014.” (Source: Federal Reserve, August 21, 2013.)

There is no clear answer as to when quantitative easing will end, and that causes uncertainty for the financial markets.

If the Federal Reserve decides to taper quantitative easing in September, as many now expect, the pullback will be insignificant. Even if the Fed decides to cut printing by 20% a month, the Fed’s balance sheet will still be destined to surpass four trillion dollars soon! Yes, the Fed will have cumulatively created $4.0 trillion in new money out of thin air!

And let’s face the facts: quantitative easing hasn’t done much for the U.S. economy or for the average American Joe. Quantitative easing has made the banks stronger and richer, while risking hyper-inflation.

One not-so-funny thing: take the earnings of the big banks out of the S&P 500 second-quarter earnings, and you’ll find the remaining companies, collectively, experienced negative earnings growth in the second quarter of 2013. It’s scary stuff—and it’s proof that quantitative easing is helping the banks more than any other sector of the economy.

What He Said:

“When I look around today, I see falling stock prices…I see falling house prices…and prices falling for retail goods stores. The media has it all wrong blaming (worrying about) inflation. In my opinion, the single biggest threat to the U.S. economy and to the Fed in 2008 is deflation. You can bet the Fed will expand the money supply and drop interest rates aggressively as deflation starts to rear its ugly head.” Michael Lombardi in Profit Confidential, December 17, 2007. Michael was one of the first to warn of deflation. By late 2008, the world economies were embedded in their worst state of deflation since the Great Depression.

Article by profitconfidential.com

Final Results in for Quantitative Easing: It Made the Banks Stronger and Richer Again

By Profit Confidential

Wednesday’s release of the much anticipated Federal Open Market Committee (FOMC) meeting minutes basically said the Federal Reserve will continue to run its printing presses at the same speed at which they have been running since late last year—until further notice.

So when will the Fed pull back on its $85.0-billion-a-month quantitative easing program?

It depends on economic conditions. The meeting minutes said “…if economic conditions improved broadly as expected, the Committee would moderate the pace of its securities purchases later this year. And if economic conditions continued to develop broadly as anticipated, the Committee would reduce the pace of purchases in measured steps and conclude the purchase program around the middle of 2014.” (Source: Federal Reserve, August 21, 2013.)

There is no clear answer as to when quantitative easing will end, and that causes uncertainty for the financial markets.

If the Federal Reserve decides to taper quantitative easing in September, as many now expect, the pullback will be insignificant. Even if the Fed decides to cut printing by 20% a month, the Fed’s balance sheet will still be destined to surpass four trillion dollars soon! Yes, the Fed will have cumulatively created $4.0 trillion in new money out of thin air!

And let’s face the facts: quantitative easing hasn’t done much for the U.S. economy or for the average American Joe. Quantitative easing has made the banks stronger and richer, while risking hyper-inflation.

One not-so-funny thing: take the earnings of the big banks out of the S&P 500 second-quarter earnings, and you’ll find the remaining companies, collectively, experienced negative earnings growth in the second quarter of 2013. It’s scary stuff—and it’s proof that quantitative easing is helping the banks more than any other sector of the economy.

What He Said:

“When I look around today, I see falling stock prices…I see falling house prices…and prices falling for retail goods stores. The media has it all wrong blaming (worrying about) inflation. In my opinion, the single biggest threat to the U.S. economy and to the Fed in 2008 is deflation. You can bet the Fed will expand the money supply and drop interest rates aggressively as deflation starts to rear its ugly head.” Michael Lombardi in Profit Confidential, December 17, 2007. Michael was one of the first to warn of deflation. By late 2008, the world economies were embedded in their worst state of deflation since the Great Depression.

Article by profitconfidential.com

Choppy Market Action Exposes Attractive Entry Point for This Bellwether Leader

By Profit Confidential

Attractive Entry Point for This Bellwether LeaderThe best companies the stock market has to offer rarely go on sale. But when they do, you have to make a determination as to whether there’s been a fundamental change in the long-run prospects of an enterprise. If there hasn’t been a change, then that company is worthy of serious consideration.

One such company that’s been an excellent wealth creator on the stock market and has recently pulled back from its high is Visa Inc. (V). The position crossed below its 50-day simple moving average (MA) at the end of July and is just a few points away from hitting its 200-day simple MA.

Prospects for Visa haven’t diminished. Wall Street has been consistently increasing its earnings outlook on the company for this year and next.

Both Visa and MasterCard Incorporated (MA) trade similarly on the stock market. While Visa is the larger company by market capitalization, both positions are off their highs.

Now is a good time to put Visa on your radar for a number of reasons. The position isn’t down from its high very often—let alone being down to this degree. Business prospects for the company haven’t changed. It’s the lull between earnings seasons, and the marketplace is worried about a reduction in monetary stimulus. For long-term portfolios, Visa is a good pick to consider.

The business of credit cards is a good one. In its fiscal third quarter of 2013 (which just ended), Visa’s revenues were $3.0 billion, up markedly from $2.57 billion in the comparable quarter. Plus, the company is highly profitable, generating earnings of $1.23 billion last quarter, compared to a loss due to a litigation provision.

The fastest growth the company is experiencing is in transactions outside of the U.S. market. International transaction revenues grew 14% to $854 million in the latest quarter. Total operating revenues this year are expected to grow approximately 13%. Adjusted earnings-per-share (EPS) growth in 2013 is expected to be in the low 20% range. Management recently affirmed its previous full-year outlook.

So business prospects for Visa haven’t changed, but the stock is off its high by approximately 20 points.

No doubt, this position’s due for a correction. It’s been running strong since 2011. Regardless, this company is an awfully good business, and it has proven in the past that it’s never off its highs for very long. (See “Will a Return to Normalized Interest Rates Halt Economic Growth?”)

Those investors with an interest in this kind of enterprise may want to consider following the stock now. If it continues to pull back, the company will soon become a value with a current forward price-to-earnings (P/E) ratio of just under 20.

I would say, however, that I don’t like the trading action of this stock market. Until recently, the action had a good amount of conviction; now, there’s an undercurrent of worry about what the Federal Reserve is going to do with its monetary stimulus.

So while a company like Visa is very much a business worth keeping an eye on, I’m not an advocate of doing much buying before there is certainty from the Fed regarding monetary policy.

Article by profitconfidential.com