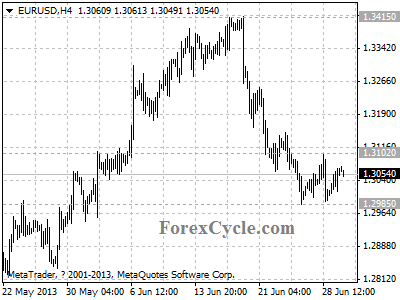
EURUSD stays in a trading range between 1.2985 and 1.3102

EURUSD stays in a trading range between 1.2985 and 1.3102. Key resistance is at 1.3102, as long as this level holds, the price action in the range could be treated as consolidation of the downtrend from 1.3415, one more fall to 1.2900 area is still possible after consolidation. On the upside, a break above 1.3102 resistance could signal completion of the downtrend from 1.3415, then the following upward movement could bring price back towards 1.3600.

eurusd

Forex Signals

Why Economic Models Have Gone Out of the Window

By MoneyMorning.com.au

I had a good economics teacher at school, so I went on to study the subject at university – but by the end of the first year I was lost. Gone were conversations about how people as a group might or might not behave in any given situation and the stories of the emotions behind the graphs; in their place were endless lessons on econometrics and statistics backed up with increasingly complicated graphs and equations.

This stuff is pretty important – there’s no point in being an economist if you can’t manipulate statistics and, of course, an excellent grounding in mathematics is vital in every area of life. But it’s also only half the story. Economics is as much about behaviour as numbers, and economic models of all sorts can be destroyed by changes in the way people behave – as we have discovered in the past few years.

Andrew Smithers, of Smithers & Co, is good on this. He makes the point, for instance, that we have so changed the incentives for senior management over the last few decades that their behaviour no longer fits with the traditional modelling of corporate behaviour. They are hopelessly short-term, not very nice to their staff and devoted to the manipulation of the value of their options.

You might once have expected something like quantitative easing (QE) to encourage companies to borrow cheaply to invest; certainly, that’s what central bankers hoped it would achieve. But instead it just encourages them to push up earnings per share by borrowing to buy back shares, something that then holds up the stock market at levels that make no real sense. Again, a change in behaviour – that can’t be easily input into models – suggests it isn’t so easy.

Demographics and private debt levels can do this too. There was a time when cutting interest rates automatically made people spend more. But if large parts of the population are past peak spending age and the rest already spend their evenings staring blankly at their credit card statements, it just can’t. People change faster than economic models – which is why the models don’t always work very well.

The same goes for financial models. History is littered with the wreckage of black box hedge fund strategies. This week brought us a few more. Particular mention must go to Cantab Capital Partners; its main fund rose 15% last year, but has reportedly lost 14% this month alone. Its excuse is that ‘it’s unusual for one to see a sell-off in risk assets and a sell-off in bonds at the same time‘. That’s true – it is unusual. But it wasn’t entirely unexpected. If prices in the bond markets are artificially high thanks to the existence of the central banks as the biggest buyers of debt, why should other asset prices move in the same way relative to them as they have in the past?

Look at the point on buybacks above and you can see why rising bond yields (falling bond prices) might hit equity prices: fewer cheap loans mean fewer buybacks pushing markets up. People kill economic models. If only Mr Kirk (the founder of Cantab) had been more familiar with Mr Smithers.

Investing has always been tricky, but at least in the past there was a straightforward basis to it. You figured out roughly what you thought a company or a sector’s earnings were likely to be and then made a stab at guessing whether those earnings were reflected in its price. There were derivatives of this, of course – you might also spend some time guessing what other people thought earnings might be so you could buy or sell before they did (the economists among you will recognise this as Keynes’s ‘beauty parade’ theory of markets).

But now to get things right in the short term, we have to second-guess the big central banks. Then we have to second-, third- and fourth-guess other people’s guesses on the central banks. I have a tiny bit more sympathy than usual for the losses of professional investors in this world of model failure.

But it still seems to me that the best thing for us ordinary investors to do is just to step back, make a few long-term assumptions and look at long-term valuations. The former probably means behaving as though the bond bubble is over and inflation is the end game, while the latter at the very least means avoiding the US stock market. It currently trades on a cyclically-adjusted price/earnings ratio of 23 times which, as Peter Bennett at Walker Crips points out, is ‘historically a straight sell‘.

My own portfolio is currently in sensible investment trusts and cash, so I’m not changing it before the summer. However, I can’t go on holiday without mentioning the free-falling gold price. Gold isn’t an investment in the way that it was when it was so gloriously underpriced a decade ago, and it is worth remembering that it hates rising interest rates. But it is still something you should hold as insurance. So falls in its price shouldn’t bother you much.

Think of your car insurance. Let’s say you pay £500 a year for it. Six months into the year, you haven’t crashed. Your insurance remains unused. You are effectively down £250. Do you mind? You might be mildly irritated, but you also know that should you back into another car while parking in a frantic effort to arrive at the end-of-term play in time, you’ll get value. So it is with gold. If there was no risk at all of another major financial crisis in our investing lifetimes, you’d want to sell it. But now? When the only thing keeping crisis at bay is an artificial boom in asset prices caused by experimental central bank policies? You don’t.

Merryn Somerset Webb
Contributing Editor, Money Morning

This article first appeared in the Financial Times and Money Week on 1 July, 2013

Join Money Morning on Google+

From the Archives…

Why Your Financial Advisor Won’t Like This Investment Advice…
28-06-2013 –  Kris Sayce

Is This Your Last Chance to Sell Before the Stock Market Sinks?
27-06-2013 – Murray Dawes

Is This the Ultimate Contrarian Opportunity…Or a Death Wish?
26-06-2013 – Dr Alex Cowie

How Central Bank Zombies Control the Stock Market
25-06-2013 – Dr Alex Cowie

Why The ‘Asia-Zone’ Crisis Makes Australian Stocks a Buy…
24-06-2013 – Kris Sayce

They Just Rang A Bell On Gold – The Lows Are In!

They Just Rang A Bell On Gold-The Lows Are In!

By David A. Banister – www.markettrendforecast.com

As they say on Wall Street, “They don’t ring bells at the top” and for sure they usually don’t give you a phone call at the bottom either. Many heads have rolled trying to call this recent near 2 year downdraft in Gold in terms of bottom callers, me included. I thought we would never get much below 1440 or so from the 1923 highs, but alas we all know we did.

What makes me think that last week put in the final Gold low for the bear cycle? Too many things to mention, but based on the work I do enough to give me some chutzpah to make this call now. The 1180’s are very close to a classic ABC 61.8% Fibonacci retracement of the prior 34 month bull cycle. That cycle ran from October 2008 to August 2011 with a rally from $681 to $1900’s area. The most recent 21 plus month decline dropped right into the 61% pivot retracement of that entire move, and over a Fibonacci 21 month period as well! Human behavior does repeat over and over again, and as we all know in hindsight at the tops everyone is bullish and at the bottoms everyone is bearish.

I think it’s pretty much as simple as that. Investors get overly optimistic and exuberant in all kinds of asset classes and finally at the highs everyone believes the rally can only go on and on forever. At the opposite near the bottoms nearly everyone is calling for lower prices and further catastrophe ahead. Stocks in the sector are priced for near bankruptcy. Newsletter writers are universally bearish, and the small trader has a big short position. Only a few weeks ago the Bullish Percentile index measurement on the Gold Stock Index was at 0! That means nobody was bullish on the Gold stocks by the measure that is used. We quickly had an 8% rally in the index after that reading, then in the last few weeks we came all the way back down again to even lower levels!

If you watched the action last Thursday as Gold was melting down below $1200 a curious thing happened. The gold miners were ignoring the move and going green! On Friday, as Gold reversed to 1234 they went ballistic with one of my favorite miners going up 16% on Friday alone on the highest volume in 5 years! Those are the signals I’ve been waiting for to call the capitulation lows. My guess is some money managers are front running the coming 3rd quarter rotation they see in Gold and Gold Miners, Copper, Coal, and other commodity stocks.

So below is my basic GLD ETF multiyear chart using very simple monthly views to see the big picture. You can see a classic ABC pattern of bear market correction and now a near 61.8% perfect Fibonacci retracement of the prior leg up. I’d say enough is enough, pick your spots and start buying.

629 gold

By David A. Banister – www.markettrendforecast.com


Romania cuts rate to boost economy, sees lower inflation

By www.CentralBankNews.info     Romania’s central bank cut its policy rate by 25 basis points to 5.0 percent, as expected, to boost economic activity and ensure medium-term price stability.
    It is the first rate cut this year by the National Bank of Romania (NBR), which previously cut its rate in March 2012. The central bank also cut the rate on its Lombard facility by 25 basis points to 8.0 percent and the deposit rate to 2.0 percent from 2.25 percent.
    The NBP expects inflation to ease further in July and hit the target range in September/October. The NBR targets inflation of 2.5 percent, plus/minus 1.0 percentage point.
   “The decisions convey a positive signal to the banking system, the business community and households, by prompting a gradually downward trend in domestic currency lending costs and fostering economic activity,” the NBR said.
    “Such a monetary policy configuration is further aimed at achieving the objective of ensuring medium-term price stability while preserving financial stability and cushioning the adverse impact of domestic and external factors on the recovery of the Romanian economy.”
    The central bank added that the major risks to the short-term inflation outlook was the volatility of capital flows, given the “current global picture” and structural rigidities in Romania’s economy.

    The central bank said the negative output gap in the economy had persisted and annual consumer price inflation rose marginally to 5.32 percent in May from 5.25 percent in March.
    Based on the EU-harmonised inflation measure, May inflation was 4.38 percent, down from 4.45 percent in March.
    Romania’s Gross Domestic Product rose to an annual 2.2 percent in the first quarter from 1.1 percent in the fourth quarter of 2012 due to higher manufacturing output.
   The central banks said the leu currency had posted wider wings due to the “heightened volatility of investors’ risk appetite, as well as to the persistence of uncertainty surrounding economic activity in Europe and elsewhere.”
 
    www.CentralBankNews.info

BlackBerry After the Rout: Worth a Look?

By The Sizemore Letter

BlackBerry ($BBRY) shares fell off a cliff on Friday morning, down more than 25% after 1st quarter earnings were released, and through mid-morning on Monday they hadn’t recovered much.  It appears that the “make or break” BB10 operating system is looking like more of a break than a make.

BlackBerry sold 2.7 million BB10 devices in the quarter…which was about a million short of Wall Street estimates.  And BB10 phones made up only 40% of total phone sales…meaning that the company is still having to lean heavily on its older, lower-margin models to keep volumes up.

When a stock loses a quarter of its value in one day, it’s tempting to go bargain hunting.  After all, this is a company with half of its market cap in cash trading for just 57% of book value…a book value that may be understated based on the value of BlackBerry’s patent portfolio.  And after a rout like this, surely all of the bad news is already priced in, right?

If you want to play a dead-cat bounce here, be my guest.  But view this for what it is: a short-term contrarian trade and not an investment.

Let’s step back and consider BlackBerry’s plight.  The company has sunk into that nightmare scenario of being “stuck in the middle.”  Its high-end phones are not selling well vs. Apple’s ($AAPL) iPhone or the top-line Samsung Galaxy line running Google’s ($GOOG) Android operating system.  And at the low end, it is getting out-priced in both developed and emerging markets by a flood of cheap, entry-level Android devices.

As for the enterprise market—an area I once considered a “moat” for BlackBerry—BlackBerry’s device management still remains one of the best options.  But this clearly hasn’t arrested the decline of handset sales, and the company’s overall subscriber base is falling.  Meanwhile, government and corporate clients who once valued the security of BlackBerry’s network have over the past five years of subpar product offerings found ways to accommodate iPhones and Androids.

Sadly, BlackBerry’s network infrastructure—once the envy of the mobile world—has now arguably become as much of a liability as an asset.  Remember that week in 2011, when BlackBerry’s network went down? That was a turning point for many buyers for whom the “reliability” of the network was a selling point.  By today, BlackBerry has sunk so far in terms of relevance, a major service outage earlier this year barely made the news.

So, BlackBerry’s captive enterprise customer base continues to shrink even while its handsets are bombing with the general public.  This would be a tough situation for any company, let alone one in a fast-changing industry dominated by fickle consumers.  And when you consider that they are fighting for third place with a newly-assertive Microsoft ($MSFT)—one of the biggest and best-capitalized companies in the world –BlackBerry’s chances of success get even slimmer.  Microsoft, though still a small player in mobile, can offer a phone that complements its ubiquitous Windows PC operating system and the expanding Microsoft ecosystem.  Microsoft can also afford to throw money at its mobile platform until it gets traction…even if it takes years.  BlackBerry cannot.

This is all a long way of saying that, while appearing cheap on paper, BlackBerry is not an attractive investment.  It is a value trap that gets weaker with each passing quarter.

At some point, BlackBerry would be worth buying for its cash and patents alone.  At, say, $5-$6 per share, a corporate raider could potentially buy the company, chop it up, and sell it for spare parts at a handsome profit—assuming Canadian regulators let that happen.  Or, a larger tech company could buy BlackBerry and absorb it.

But at today’s price, investors face the prospect of watching management destroy more value trying to resurrect a company that is past the point of fixing.

If you’re a short-term trader, you can try your luck at playing a dead cat bounce.  But longer-term investors should stay away.

Sizemore Capital is long MSFT.


Chinese manufacturing growth rate falls

By HY Markets Forex Blog

The Chinese manufacturing growth rate fell in June, going through a slowdown in the Chinese economy, according to reports. The Purchasing Managers’ Index declined to 50.1 from previous record of 50.8, marking its lowest in four months, according to the National Bureau of Statistics.

The PMI from the HSBC Holdings Plc and Markit Economics dropped to 48.2, weakest since September. Indicating a weak demand, the sub-index for new orders declined as well.

Meanwhile in the euro region and India, the Markit factory advanced for June .Germany and South Korea remained at a negative territory, with its lowest since November.

The domestic debt sales fell by 48% in June to 190.6 billion yuan ($31 billion), while the Shanghai Composite index advanced 0.8%.

The Chinese exporters, manufacturers and investors have raised concerns regarding the slowdown in the key markets from the US and euro zone.

The Goldman Sachs Group Inc. and HSBC holdings pared their growth projections this year blow the government’s goal of 7.5 to 7.4 last month.

The Chinese economy expanded in the first quarter by 7.7%, down from the previous quarter record of 7.9%.

According to the official PMI report released , the reports indicates a fall in new orders ,input prices ,employment and other sub-categories.


The post Chinese manufacturing growth rate falls appeared first on | HY Markets Official blog.

Article provided by HY Markets Forex Blog

Stocks in Europe advances on positive PMI data

By HY Markets Forex Blog

Stocks in Europe climbed higher on Monday, after the final manufacturing data for euro zone’s largest economies were released.

The Euro Stoxx 50 advanced 0.89% to 2,625.64 at mid-day in London, while the German’s DAX climbed 0.62% to 8,008.21 at the same time. The French CAC 40 gained 0.92% 3,773.90, while the UK FTSE 100 rose 0.99% to 6,277.30 .Beverage company Pernod Ricard rose 2.55%, while retailer Henner & Mauritz gained 3.63%.

According to the Manufacturing Purchasing Managers’ Indices (PMI) data released by the Markit Economics, the estimate of manufacturing in euro zone rose to 48.8 in June from previous record of 48.3 in May.

The final PMI for Spain rose to 50 points in June, compared to previous record of 48.1 in May. In Italy the final manufacturing PMI advanced to 49 in June, exceeding previous predictions of 47.6.  The French final manufacturing PMI rose to 48.4 in June from 46.4 in May, while the German’s final manufacturing PMI dropped to 48.6 in June from 49.4 in May.

The final manufacturing PMI in China was at 50.1 in June, analysts forecasted a slow-down in activity from previous reading of 50.8 in May.

In New York, the institute for supply management index advanced to 50.5 in June from previous reading of 49 in May, while Siemens gained 2.6% to 79.66 euros, after the companies concluded to bring the telecommunication-equipment to an end.


The post Stocks in Europe advances on positive PMI data appeared first on | HY Markets Official blog.

Article provided by HY Markets Forex Blog

Gold Rally “Only Technical” But Short-Selling Now “a Crowded Trade”

London Gold Market Report
from Adrian Ash
BullionVault
Monday, 1 July 08:05 EST

The PRICE of gold rose hard in Asian trade Monday morning, extending Friday’s strong rally, but slipped back in London to start the third quarter of 2013 with an AM Fix of $1243.50 per ounce.

 That was 26% below New Year for US Dollar investors, 21% down in Sterling, and 25% lower in Euros.

 Silver also spiked before pulling back, dropping below Friday’s finish at $19.69 per ounce.

 Commodity prices rose, major government bonds slipped again, and European stock markets reversed an early fall.

 “Friday’s [rally] strikes us as being technical in nature,” says one analyst in a note today, repeating his view that gold bullion fell too hard, too fast and was due a sharp bounce.

 “For gold to regain the trust of investors,” Reuters quotes a Hong Kong trader, “it needs at the very least to consolidate for a few days.”

 Swiss investment and London bullion bank Credit Suisse last week called the drop in gold prices “shattering” for long-time investors.

 Clients of hedge-fund manager David Einhorn’s Greenlight Capital lost nearly 12% in June, according to Reuters, thanks to the fund’s large position in physical gold.

 Sales of American Eagle gold bullion coins meantime sank to a 10-month low in June, down more than 80% from the sudden 3-year record set in April, data from the US Mint show.

 Gold trust funds traded on stock markets in the developed West last week shrank for the 20th week running, taking the net outflow of bullion for 2013 to nearly 600 tonnes – over one fifth of their holdings at the start of the year.

 “There is still room for liquidation should sentiment remain averse,” writes Marc Ground at Standard Bank. But in the futures and options market, “shorting the metal is becoming a crowded trade,” he adds.

 Speculative bets against the gold price increased again last week, data from US regulator the CFTC showed late Friday, hitting fresh record highs.

 Accounting for bullish and bearish bets amongst those ‘Large Speculators’ using Comex gold futures and options, the so-called “net long” position shrank to a new multi-year low equal to just 102 tonnes by value – down by 79% from New Year and almost 90% below the peak of summer 2011.

 “So extreme has the price move been,” says a note on gold bullion from Australia’s Macquarie Bank, “we’re tempering our bearishness.

 “Financial markets, and in particular the gold market, appear to have got ahead of themselves on QE tapering and the potential for higher interest rates.”

 Friday this week will bring the latest US non-farm payrolls employment report, typically a key data point for analysts and traders.

 Before that, both the Bank of England (under new chief Mark Carney) and European Central Bank will vote on their monetary policy Thursday.

 “We believe that an interim low is now in place,” says Germany’s Commerzbank in a chart analysis of gold bullion prices today.

 “A corrective move higher towards the $1321.50 April low is now underway.”

 “We could see gold move back toward $1100 an ounce in the short term,” counters Mark Pervan at ANZ Banking Group, speaking to Bloomberg TV.

 “[But] I don’t think it’s sustainable at that level. Lower prices will induce strong demand in Asia.”

 New data from China – set to overtake India in 2013 as the world’s #1 gold consumer according to some analysts – today showed manufacturing activity shrinking at the fastest pace since September on the unofficial Purchasing Managers’ Index compiled by HSBC and Markit Economics.

 Turkey meantime imported 44 tonnes of gold bullion in June, widening the country’s trade deficit and further extending the rise in gold demand in the world’s fourth largest consumer.

 Over in India, and putting aside the recent duty hikes and import restrictions, households could buy 10% more gold at current world prices, The Hindunewspaper reports, if it weren’t for the Indian Rupee’s sharp drop to record lows on the currency markets.

 Vietnamese capital Hanoi yesterday saw customers “flood gold stores to purchase gold bullion”, official daily newspaper the Saigon Giai Phong reports, thanks to the continued fall in prices.

 “In Tran Nhan Tong Street where dozen gold stores locate, many local gold buyers gathered causing traffic congestion.”

 Adrian Ash

BullionVault

Gold price chart, no delay | Buy gold online


Adrian Ash is head of research at BullionVault, the secure, low-cost gold and silver market for private investors online, where you can buy gold and silver in Zurich, Switzerland for just 0.5% commission.


(c) BullionVault 2013

Please Note: This article is to inform your thinking, not lead it. Only you can decide the best place for your money, and any decision you make will put your money at risk. Information or data included here may have already been overtaken by events – and must be verified elsewhere – should you choose to act on it.
 

The Senior Strategist: Important week ahead

Important week ahead for investors with the release of keydata from the US: Jobfigures for June (Friday) as well as the industrial confidence indicator ISM (Monday).

On top of that investors will look to Frankfurt Thursday and the centralbank meeting in ECB.

Senior Strategist Ib Fredslund Madsen with his take on this weeks most important financial events.

Legal information

Video by en.jyskebank.tv


Central Bank News Link List – Jul 1, 2013: China’s central banker says cash crunch reminder for banks-paper

By www.CentralBankNews.info Here’s today’s Central Bank News’ link list, click through if you missed the previous link list. The list comprises news about central banks that is not covered by Central Bank News. The list is updated during the day with the latest developments so readers don’t miss any important news.