Why the Australian Share Market is Heading Even Higher

By MoneyMorning.com.au

Well, what did we tell you?

If you need a reminder, we told you not to panic.

We told you not to sell stocks…in fact, we told you to buy stocks.

And it’s a good thing too. The main Aussie index has regained about half the ground it had lost from the May peak.

So, are you paying attention yet?

When we say not to panic, and to focus on the important things, we don’t say it for fun. We say it because we know what we’re talking about. We’ll take you back to the Winter/Spring of 2005 to explain what we mean…

By the middle of 2005 we had been bullish on crude oil for well over a year. It was why we had advised our clients at the time to buy oil stocks.

It was a good move. Oil stocks were going through a purple patch. At the time, crude oil was around USD$50 per barrel. That was almost double where it was two years earlier.

Our view was that oil had a big risk premium built into the stock price and that was only likely to increase as political risk worsened in the Middle East, and demand for crude oil increased from the US and China.

What we hadn’t banked on was the advent of a ‘little storm’ called Hurricane Katrina and the impact it would have on oil production in the Gulf of Mexico. Few others understood the impact either.

Would that be good news for oil and oil stocks? Or would lost production time harm the earnings of oil stocks and cause the sector to fall?

You’d think it would be easy to figure that out and move on. But investors can be funny souls. The only thing on investors’ minds during the next year was when the next hurricane would arrive and if it would cause as much damage.

We remember at the time that CNBC almost turned into the Weather Channel as pundits eyed-off the next major storm. There seemed to be disappointment every time the weather guys downgraded a potential Category 5 storm to a puny 2 or 3.

On it went. Even after the hurricane season finished, all the talk was of a repeat in 2006. For many investors it became an obsession…

Lightning Didn’t Strike Twice Here

Anyway, to cut a long story short, as you know there wasn’t a repeat of Hurricane Katrina. The 2006 Gulf of Mexico hurricane season came and went without another terrible storm.

Maybe it’s just a coincidence, but from that point – once investors realised Hurricane Katrina Mk II wasn’t on the way – stock prices took off. They barely looked back as the bull stock market rallied to the November 2007 peak:


Source: Google Finance

So, what does this have to do with today’s stock market action?

From late 2005 through to mid- to late-2006 investors were almost literally waiting for lightning (or a hurricane) to strike twice.

They remembered the last disaster that had buffeted stocks about and wanted to make sure they were prepared in case a similar disaster struck again. They sure didn’t want another hurricane to catch them out…only, the hurricane never came.

Not the ‘Big One’ anyway. And you know what? With the 2006 hurricane season over, investors weren’t about to wait on the sidelines for another hurricane that might not come.

As we see it, investors are about to make a similar switch. For the most part they’re still looking back at 2008, afraid that another subprime style catastrophe is about to hit…but not for long. For the past year, while they’ve focused on bond yields and interest rates, they’ve missed out on some great investment opportunities.

And they won’t want to make that mistake again…

Why You Can’t Afford to Sit on the Sidelines of the Stock Market for too Long

Look, we aren’t saying everything is fine. But it’s also important to keep things in perspective.

Sure, higher bond yields and interest rates could have an impact on the economy. We get the thinking behind that. But we also know there’s no guarantee you’ll see the impact this week, next month or even next year.

Think about it this way. Most people think the US subprime disaster was a product of the 2000′s. But it wasn’t. It all kicked off in the mid-1980s. In other words it took over 20 years for the full impact of subprime mortgages to wreak havoc on the US and world economies.

Or go back further. Some economists pin the blame for the 2008 crash on the manipulation of interest rates by the US Federal Reserve. Well, the Fed has manipulated rates ever since its creation in 1913.

If the 2008 crash really was the ultimate fault of the Fed, then it took 95 years for it to finally filter through to the markets. So who’s to say it won’t take 95 years for the current crisis to wreak havoc? OK, it doesn’t seem likely, but you can’t tell for certain until it happens.

All this is why we don’t want you hanging around waiting for lightning to strike twice.

It’s OK to be cautious. That’s why we don’t want you investing all your savings in stocks. But as we’ve explained many times in Money Morning, you’ve got to have some exposure to the stock market.

For all its faults, the stock market is still the best place to build wealth.

Yes, there are risks. But while most others have fretted over the supposed dangers of rising bond yields, we’ve kept on telling you to buy stocks. And a good job too as the Australian share market has rallied over 300 points in just three weeks.

So the next time you’re tempted to panic and sell the market, just stop for a moment and think. We’re still betting on the Australian stock market finishing the year at a level much higher than it is at today. We’d hate to think you missed out due to a rash decision.

Cheers,
Kris+

Join Money Morning on Google+

From the Port Phillip Publishing Library

Special Report: The Sixth Revolution

Daily Reckoning: Why You Should Back Your Own Personal Gold Standard

Money Morning: Money Weekend’s Technology FutureWatch 13 July 2013

Pursuit of Happiness: Make Sure You’re Not a Property Investing ‘Loser’

What if the Price of Oil Collapses This Year?

By MoneyMorning.com.au

Could the price of oil fall to $50? Jan Stuart and Stefan Revielle of Credit Suisse think so. Just think about the implications here: it would touch just about every industry on the planet; many speculators would be ruined; hordes of drillers and prospectors would go out of business.

Drivers, meanwhile, would be thrilled. And it would be a boon for companies struggling to keep their fuel costs down, such as hauliers.

But is it likely to happen? According to these two analysts, investors are becoming increasingly concerned about an oil price collapse. ‘How bad can things get?’ is the question, and their answer is ‘very bad!’

But only if the global economy implodes once again…

The argument runs like this: global imbalances have not been fixed; indeed, in some cases they have got worse ‘and much of the available political and real capital has merely been squandered in the interim‘.

The cost of fixing things has now escalated, and the inevitably painful process of cutting debt has merely been postponed. But the painful reckoning cannot be put off forever.

For its doomsday scenario, Credit Suisse assumes ‘a repeat of the collapse in trading and global activity that accompanied the Great Financial Recession of 2008‘. ‘It could happen [very soon] and a recovery would be decidedly sluggish‘.

Oil demand would deflate sharply, there would be plentiful supply and a recovery would be ‘halting, fragile, and painfully slow‘.

The US dollar would strengthen and oil prices would fail to recover to much beyond $80 a barrel in the next few years.

The World is Awash With Oil

Part of the problem (if you see it as such) is the increase in supply from the USA. Francisco Blanche, head of commodity research at Merrill Lynch, has said that ‘nobody expected output to grow by a million barrels per day last year‘.
Thanks to fracking, oil is starting to flow from onshore fields in the USA. This technological breakthrough has already crushed the price of natural gas and the drill rigs have moved over to the oil fields.

Unlike with natural gas, this has a global impact. Because gas is best transported through pipelines, it tends to serve only the local market – although investment in liquefied natural gas is increasingly creating a global natural gas market.

But oil is already a global market. There is an international price for oil and this is now being affected by what Credit Suisse calls ‘stunning large exports streams from the US Gulf that are finding their way into Europe, Latin America, and Africa‘.

The bottom line is that supply is tending to increase and, as this is taking place outside the Middle East, it is weakening OPEC’s grip on the market. As ever, the picture is complicated. The Chinese economy is at best in transition, but at worst is facing a severe contraction.

The troubles in Egypt, which controls the Suez Canal, are a further sign of tension in the Middle East. And while I would not dispute that many European leaders are doing good ostrich impressions with their heads buried firmly in the sand, other countries are starting to tackle deficits without doing much harm to growth prospects.

Who Would Win and Who Would Lose?

The future of energy prices is important, however. While nervous traders might fear a falling oil price, consumers around the world would welcome it hugely. Except for those countries that rely upon oil production, a lower oil price would surely boost activity, free up cash to be spent elsewhere and, by cutting inflation, allow interest rates to remain low.

I can imagine the joy of hard pressed road hauliers, but I can also envisage anxiety elsewhere.

Government and corporate policy assumes a high oil price. Oil is not only dirty, but it is expensive and in declining supply. For the last decade, countries have been trying to wean themselves off their dependence on oil.

Alternative energy projects from wind to wave have been promoted; nuclear looks cheap, if dangerous; underground coal gasification has been touted.

Above all, natural gas is enjoying a renaissance.

Here’s another complication: whole industries have been built around the need to cut oil consumption. Vehicles are being modified to use less of it, or are being powered by electricity or gas. Innovative technologies can convert gas into liquid fuel. Waste-to-energy projects look increasingly appealing.

But all of these trends have one motivation – the high price of oil. A collapse of the oil price might please you and me as we refuel at the petrol station, but it would wreck the plans of many. Having just got used to the shock of $100 oil, a sudden price slump would cause fresh consternation.

Tom Bulford
Contributing Editor, Money Morning

Publisher’s Note: This article originally appeared in MoneyWeek.

Join Money Morning on Google+

From the Archives…

Quantam Computers – Why It’s Time to Believe the Unbelievable
12-07-2013 – Sam Volkering

Red Alert: Why This Stock Market Rally is a Trap
11-07-2013 – Murray Dawes

Why Oil Could be the One Commodity to Defy the Doom…
10-07-2013 – Dr Alex Cowie

Gold Breaks A Record
9-07-2013 – Dr Alex Cowie

Time to Plan for the Year-End Stock Rally?
8-07-2013 – Kris Sayce

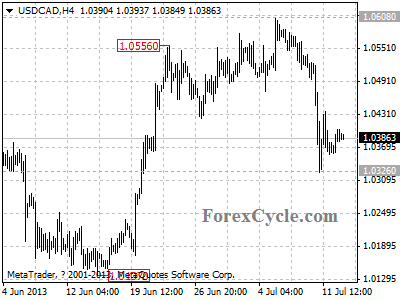
USDCAD remains in downtrend from 1.0608

USDCAD remains in downtrend from 1.0608, the rise from 1.0326 is treated as consolidation of the downtrend. Resistance is at 1.0440, as long as this level holds, the downtrend could be expected to resume, and next target would be at 1.0300 area. On the upside, a break above 1.0440 resistance will suggest that the lengthier correction of the downtrend is underway, then the target would be at 1.0480 – 1.0500 area.

usdcad

Provided by ForexCycle.com

EUR/USD – Will The Mighty Jump Survive?

By ForexAbode

EUR/USD had a very strong upward jump during last week when the pair moved up from 1.2755 to 1.3207 i.e. 452 pips in a matter of a single day. This move broke above the 200-day moving average resistance but could not sustain and the price action fell below this resistance once again.

EUR/USD and 200-day moving average

As we see that a decisive break over 1.3121 is needed once again to indicate that this resistance has been overcome.

Not only the 200-day moving average but we may need to keep an eye on the daily Ichimoku cloud also. The last week’s resistance also came just below the upper edge level of the daily Ichimoku cloud. Please note that the price action is no more within the cloud but fell below the cloud once again.

EUR/USD with daily Ichimoku cloud

While the above chart indicates that any decisive break over 1.3230 will be the end of this resistance but the story does not end there. Quite interestingly the resistance was also below the weekly Ichimoku cloud and till a break of 1.3300 resistance takes place we need to consider any upward gains just as a consolidation and not reversal of any kind.

EUR/USD with weekly Ichimoku cloud

Connect to the Author at Google +Himanshu Jain or at ForexAbode.com.


EURUSD Was Not Yet Ready for…

Article by Investazor.com

In the first week of June, Mario Draghi said that ECB will keep the interest rates at record low for an extended period of time and there are arguments for it to be cut even more. In the same week, on Friday the Non-Farm Payrolls surprised the market with a value above all forecasts. The dollar got stronger and stronger, managing to get the EURUSD quotation under 1.2800.

The story does not end here. Last week, the second week of the month, were published the FOMC Meeting Minutes and Ben Bernanke had a speech titled “A Century of US Central Banking: Goals, Frameworks, and Accountability”. Investors were disappointed to see that, in the minutes, there was no date from which Fed will start tapering the monetary easing program. The full attention was moved to Ben’s speech, but nothing was said about any dates. This time the dollar started to lose and in several hours EURUSD got back over 300 pips.

Next week Ben Bernanke will testify on the Semiannual Monetary Policy Report before the House Financial Services Committee, in Washington DC

eurusd-was-not-ready-for-a-breakout-14.07.2013

Chart: EURUSD, Daily

Looking at the price action of EURUSD we can say that it wasn’t ready to break out from the consolidation pattern, which is actually a symmetrical triangle.  The lower boundary is around 1.28 level while the upper one sits at 1.34. The main axis, as it can be seen on the chart, is 1.3200. This level seems to be the equilibrium one.

If the price breaks above 1.32 we can expect for it to test the upper line of the triangle, while if it drops or remains under the pressure rises on the lower line of the pattern.  This currency pair will remain sensible to the economic data published from the United States and will the volatility will increase during the speeches of Mario Draghi and Ben Bernanke.

The post EURUSD Was Not Yet Ready for… appeared first on investazor.com.

Monetary Policy Week in Review – Jul 8-12, 2013: 2 major banks raise rates, 2 cut as markets yo-yo over Fed policy

By www.CentralBankNews.info
    This week two major emerging market central banks raised rates while two minor banks cut rates as global financial markets continued to yo-yo in response to the U.S. Federal Reserve’s valiant attempts to be transparent over its plan to normalize monetary policy and exit quantitative easing.
    It was always clear that the process of winding down asset purchases would be tricky, not only because financial markets have grown accustomed to the steady supply of free money but also because there is no road map for central banks to follow.
    But to observe Federal Reserve Chairman Ben Bernanke’s heroic attempts to explain the difference between a “highly accommodative” policy stance (a reference to the exceptionally low federal funds rate) and “increased policy accommodation” (a reference to asset purchases) is bordering on the surreal.
    While there are many benefits to investors and financial markets from central banks’ move toward more open communication, greater asset price volatility seems to be one of the drawbacks when policy makers are navigating unchartered waters and basing decisions on real-time economic data.
    As a general rule, financial markets typically overreact to unexpected changes in central banks’ policy so the sharp rise in bond yields in May and June – probably an excessive rise – was entirely rational as Bernanke’s consistent message was that the days of ultra-easy U.S. monetary policy are on the wane.
    But to ensure that the rise in bond yields doesn’t derail the economic recovery – a fear already voiced by the Bank of England and the European Central Bank – Bernanke then reminded markets that the “highly accommodative monetary policy” (i.e. short-term rates) will be needed for the foreseeable future, and the Fed would respond if financial conditions tighten too much – a clear reminder that the “Bernanke Put” is still alive and well.
    The spillover from the change in U.S. monetary policy to emerging markets has been widespread since early May, triggering intervention in foreign exchange markets and contributing to at least one rate hike to dampen the outflow of capital and a sharp decline in currencies.
    This week the central banks of South Korea, Mexico and Serbia – which all held their rates steady  – referred to the tapering of U.S. asset purchases as a downside risk to growth due to the rise in local bond yields and currency depreciation.
    But it was interesting that Mexico described the rise in bond yields and a decline in its currency as taking place in “orderly fashion” and this would not lead to inflationary pressures due to the slack in the economy.
    By downplaying the impact of the fall in the peso in May and early June – the peso rebounded in late June – the Mexican central bank confirmed that the impact on emerging markets from an eventual tightening of U.S. monetary policy is unlikely to be as dramatic as in the 1980s and 1990s when financial crises followed.
    The Bank of Thailand, which also held rates steady this week, looked at the other side of the coin of an expected tapering of U.S. asset purchases, noting improvements in the U.S. economy from better housing and labour market conditions.
    Another central bank to look at the bright side was the Bank of Japan, which for the first time in two years used the word “recovery” to describe its economy. And while it is clear that the economy is strengthening, it is still early days and prices are still falling. The BOJ’s confidence may be growing, but it still adds the adjective of “moderate” to the describe the recovery.
    But while the U.S. and Japanese economies appear to be strengthening, the slowdown in China has hit economies worldwide. The Bank of Korea, which also held rates steady, and Thailand specifically pointed to the negative impact of China while the central banks of Malaysia, Chile and Russia – which also maintained their rates – merely referred to the weak global environment.
    The surprise of the week came from the Bank of Indonesia, which raised rates by 50 basis points – markets had expected a 25 point rise – signaling that it will go to great lengths to contain inflationary expectations and stop any second-round effects from the government’s long-awaited rise in fuel prices.
    The Central Bank of Brazil also hiked rates by 50 basis points, a move that was largely expected, illustrating the same determination to avoid a further rise in inflation, an even more present danger due to the recent depreciation of Brazil’s real and Indonesia’s rupiah.
    This week’s two rate cuts came from Latvia and Tajikistan, with both central banks taking advantage of low inflation to stimulate growth. Latvia, which cut its rate by 50 basis points to 2.0 percent, also needs to slowly narrow the gap to the European Central Bank’s 0.50 percent refinancing rate, before becoming the 18th nation to use the euro from January 1, 2014.
    Through the first 28 weeks of this year, central bank policy rates have been cut 69 times, or 24.8 percent of the 274 policy decisions taken by the 90 central banks followed by Central Bank News, slightly down from 25.4 percent last week and 24.9 percent the previous week.
    While the global trend remains firmly toward lower policy rates, the number of rate rises has been inching up ever so slowly. Policy rates have been raised 14 times this year, accounting for 5.1 percent of all decisions, up from 4.6 percent last week.
     Last week 10 central banks maintained their rates, including the central banks of Thailand, Kenya, Japan, Korea, Serbia, Malaysia, Peru, Mexico, Russia and Chile.

    LAST WEEK’S (WEEK 28) MONETARY POLICY DECISIONS:

COUNTRYMSCI    NEW RATE          OLD RATE       1 YEAR AGO
THAILANDEM2.50%2.50%3.00%
KENYAFM8.50%8.50%16.50%
TAJIKISTAN6.10%6.50%6.80%
BRAZILEM8.50%8.00%8.00%
JAPANDM                N/A                N/A0.10%
KOREAEM2.50%2.50%3.00%
SERBIAFM11.00%11.00%10.25%
INDONESIAEM6.50%6.00%5.75%
MALAYSIAEM3.00%3.00%3.00%
LATVIA2.00%2.50%3.00%
PERUEM4.25%4.25%4.25%
MEXICOEM4.00%4.00%4.50%
RUSSIAEM8.25%8.25%8.00%
CHILEEM5.00%5.00%5.00%

    Next week (week 29) is quiet on the monetary policy front, with only two banks scheduled to hold policy meetings: Canada and South Africa. On Friday the 19th, finance and labor ministers from the Group of 20 meet in Moscow.

COUNTRYMSCI             DATE              RATE       1 YEAR AGO
CANADADM 17-Jul1.00%1.00%
SOUTH AFRICAEM18-Jul5.00%5.00%

    www.CentralBankNews.info

Why a Recession for the U.S. Economy Within the Next 12 Months Is Inevitable

By Profit Confidential

120713_PC_lombardiOne fact has become quite clear: if we want to see robust growth in our gross domestic product (GDP), then there needs to be a significant change in consumer spending.

But current consumer spending in the U.S. economy is looking bleak, and it makes me skeptical about the GDP growth ahead. We’ve already seen GDP in the first quarter revised lower due to consumer spending; and it won’t be a surprise to me if something similar happens in the second quarter.

Don’t just take my word for it. Look at what the CEO of Family Dollar Stores, Inc (NYSE/FDO), Howard R. Levine, said about consumer spending while presenting his company’s corporate earnings for its fiscal third quarter (ended June 1, 2013):

“Our consumables sales remained strong and we continued to gain market share. However, our discretionary sales remained challenged as our customers have been forced to make spending choices between basic needs and wants. Consistent with market trends, we expect that our customers will continue to face financial headwinds…” (Source: “Press Release; Family Dollar reports Third Quarter Results,” Family Dollar Stores, Inc. web site, July 10, 2013.)

Remember: retailers like Family Dollar Stores see the patterns of consumer spending first-hand—their opinions shouldn’t be taken lightly.

More proof that consumer spending (which makes up a major portion of our GDP) isn’t as robust is the fact that wholesale trade sales are down and inventory figures are up. Inventories at wholesalers in May were up 3.3% as compared to a year ago. And inventories of durable goods were up 4.8% in the same period. (Source: U.S. Census Bureau, July 10, 2013.)

Inventory build-up is an indicator suggesting consumer spending isn’t what it was expected to be. In addition, surging durable goods inventories also suggest that consumers are not spending on their wants, but instead focusing on their needs for now.

Consumer spending on nondurable goods—goods that don’t last for long periods of time, like clothing—isn’t great either. From the fourth quarter of 2012 to the first quarter of 2013, real personal consumption—consumer spending adjusted for price changes—increased by just $14.6 billion, or 0.7%. (Source: Federal Reserve Bank of St. Louis web site, last accessed July 11, 2013.)

I can’t stress this enough: consumer spending won’t improve and the GDP will remain depressed until the average Joe American feels confident spending money.

Nothing has changed in the U.S. economy. The daily struggle for many Americans continues. Following the financial crisis, many Americans are now working at jobs that pay minimum wage or have part-time positions, while others are losing their skills the longer they are out of work.

That’s why I’m predicting the opposite of what so many analysts and economists are forecasting: they see growth, while I see the U.S. headed back to a recession within the next 12 months.

Michael’s Personal Notes:

Did the Federal Reserve just tell us it wants much higher inflation?

In the most recent meeting minutes from the Federal Open Market Committee (FOMC), it said:

“Most [members], however, now anticipated that the Committee would not sell agency mortgage-backed securities (MBS) as part of the normalization process, although some indicated that limited sales might be warranted in the longer run to reduce or eliminate residual holdings. A couple of participants stated that they preferred that the Committee make no decision about sales of MBS until closer to the start of the normalization process.” (Source: “FOMC Minutes,” Federal Reserve, July 10, 2013.)

Simply put, the majority of the members of the FOMC think the Federal Reserve shouldn’t sell the MBS it has accumulated on its balance sheet through its multiple rounds of quantitative easing.

While the key stock indices rally, and stock advisors continue to say we are going much higher, if the Federal Reserve doesn’t go ahead with this action and keeps the MBS on its balance sheet, this move could have serious implications ahead.

Mark my words: the biggest problem will be inflation.

This is how it works: if the Federal Reserve keeps the MBS it has bought from banks for the sake of providing liquidity to the financial system, then that will increase the money supply—which always causes inflation.

Take a look at the chart below. This chart sums up the relationship between the money supply and inflation. It compares M2 money stock (a measure of money supply and the consumer price index as indicated by the black line) and the “official” measure of inflation (marked by the red line).

M2-Money-Supply-Index

   Chart courtesy of www.StockCharts.com

Clearly, the correlation between money supply and inflation is very high and shouldn’t go unnoticed.

My problem is that the Federal Reserve still hasn’t stopped quantitative easing. The damage has already been done—through quantitative easing, the Federal Reserve has inflated its balance sheet to more than $3.0 trillion, and the money supply has increased significantly. Just like throwing more fuel on a fire, the continuation of quantitative easing will only make inflation soar higher.

We are already seeing some inflation, even if the official numbers suggest otherwise. Some mainstream economists are even saying we may see deflation ahead. They will soon find out they are wrong.

Dear reader, I am a consumer, and I go out and shop. I notice that the price of gas has increased substantially, and containers of our favorite foods are shrinking in size with a “no price change” tag slapped on them. Inflation will get much worse, and possibly even get out of control, unless the Federal Reserve starts pulling back on its $85.0 billion-a-month printing program.

Article by profitconfidential.com

Why the Federal Reserve’s Latest Announcement Should Worry You

By Profit Confidential

Did the Federal Reserve just tell us it wants much higher inflation?

In the most recent meeting minutes from the Federal Open Market Committee (FOMC), it said:

“Most [members], however, now anticipated that the Committee would not sell agency mortgage-backed securities (MBS) as part of the normalization process, although some indicated that limited sales might be warranted in the longer run to reduce or eliminate residual holdings. A couple of participants stated that they preferred that the Committee make no decision about sales of MBS until closer to the start of the normalization process.” (Source: “FOMC Minutes,” Federal Reserve, July 10, 2013.)

Simply put, the majority of the members of the FOMC think the Federal Reserve shouldn’t sell the MBS it has accumulated on its balance sheet through its multiple rounds of quantitative easing.

While the key stock indices rally, and stock advisors continue to say we are going much higher, if the Federal Reserve doesn’t go ahead with this action and keeps the MBS on its balance sheet, this move could have serious implications ahead.

Mark my words: the biggest problem will be inflation.

This is how it works: if the Federal Reserve keeps the MBS it has bought from banks for the sake of providing liquidity to the financial system, then that will increase the money supply—which always causes inflation.

Take a look at the chart below. This chart sums up the relationship between the money supply and inflation. It compares M2 money stock (a measure of money supply and the consumer price index as indicated by the black line) and the “official” measure of inflation (marked by the red line).

M2-Money-Supply-Index

               Chart courtesy of www.StockCharts.com

Clearly, the correlation between money supply and inflation is very high and shouldn’t go unnoticed.

My problem is that the Federal Reserve still hasn’t stopped quantitative easing. The damage has already been done—through quantitative easing, the Federal Reserve has inflated its balance sheet to more than $3.0 trillion, and the money supply has increased significantly. Just like throwing more fuel on a fire, the continuation of quantitative easing will only make inflation soar higher.

We are already seeing some inflation, even if the official numbers suggest otherwise. Some mainstream economists are even saying we may see deflation ahead. They will soon find out they are wrong.

Dear reader, I am a consumer, and I go out and shop. I notice that the price of gas has increased substantially, and containers of our favorite foods are shrinking in size with a “no price change” tag slapped on them. Inflation will get much worse, and possibly even get out of control, unless the Federal Reserve starts pulling back on its $85.0 billion-a-month printing program.

Article by profitconfidential.com

How to Make the Current Oil Situation Work for You

By Profit Confidential

How to Make the Current Oil Situation Work for YouThe spot price of oil is worth keeping a sharp eye on. With West Texas Intermediate (WTI) oil having jumped past $105.00 a barrel, oil stocks are moving again.

Geopolitical tensions certainly have added a bit of a premium to oil prices, but there’s been resilience in spot well over the last couple of months, and it’s based on the prospects of a stronger U.S. economy.

And that strength in oil prices, while never helpful for consumers, is happening in the face of the highest amount of U.S. crude oil production in 20 years.

The primary consequence of stronger oil prices for the consumer is obviously the bill at the pump. But it’s also in the infrastructure that is struggling to keep up with the production boom. U.S. oil production has overtaken pipeline capacity and railroads are making up for the transportation gap.

In the first half of 2013, 356,000 carloads of crude oil and refined petroleum products were moved by rail, according to the Association of American Railroads (AAR). This equates to 1.37 million barrels of oil being shipped every day, according to the U.S. Energy Information Administration (EIA).

There is now a 60,000-car order backlog for oil railcars in the U.S. market.

Based on the latest 2013 monthly output numbers, the EIA says the U.S. is producing 7.2 million barrels of crude oil per day. The majority of the increase in rail transportation of the commodity is due to the huge growth in Bakken oil production, mostly in North Dakota—which doesn’t have enough pipeline capacity. (I’ll be travelling to the Bakken oil region shortly for a first-hand account of the production boom.)

The EIA recently noted that the increased transport of Bakken oil by rail has narrowed the difference in oil prices between Bakken crude and international benchmark Brent crude oil to less than $5.00 a barrel. According to the agency, a declining spread between benchmarks reduces the incentive to ship oil to coastal refineries.

So the numbers are very clear: U.S. oil production is rising, along with the fast-growing trend of transporting oil by rail; but oil prices are not falling with the increased supply. The consumer is paying more, while investors reap the profits.

And oil stocks are moving commensurate with stronger oil prices. I still maintain the view that most investors should definitely consider some exposure to the large-cap oil and gas energy industry as part of a long-term equity portfolio.

Alternative energy is also attractive, but definitely more speculative and often without dividend income. (See “How Rising Oil Prices Can Help Your Portfolio.”)

Keep in mind that WTI oil prices are up approximately $20.00 per barrel from this time last year. With the summer driving season in full swing and lasting geopolitical tensions in the Middle East, oil prices are likely to stay high.

Solely from the investor’s perspective, it should continue to be a good year for the large, integrated energy companies. But it’s not one consumers will enjoy.

Article by profitconfidential.com

Why This Cold Prairie State Is an Investment Hotspot

By Profit Confidential

Why This Cold Prairie State Is an Investment HotspotWhen it comes to petro-dollars, North Dakota isn’t the first place you might think of—but soon it will be. The aggressive efforts to develop shale oil have turned North Dakota into one of the top states for growth and employment nationwide.

Since oil first started to be processed from shale formations, the development has been rapid. And today, the amount of oil produced from shale via the fracking technique (the breaking of shale formation using a water, sand, and chemical mixture to access the commodity below) has intensified.

In fact, if you add the proposed oil from Canada’s oil sands, the U.S. will become much less dependent on oil from the volatile Middle East. Texas oil magnate T. Boone Pickens is probably giddily thinking of the investment opportunities, as he has long been an opponent of oil from the Organization of the Petroleum Exporting Countries (OPEC), the largely Middle Eastern oil cartel.

A clear indication of the impact of shale oil can be seen in the monthly report from OPEC. According to the report, OPEC predicts a decline in its market share due to the influx of shale oil (Source: Lawler, A., “OPEC to lose market share to shale oil in 2014,” Reuters, July 10, 2013.)

The growth of shale oil will likely only quicken as new sites are developed and related technology improves. In fact, after Texas, North Dakota is the next biggest producer of oil nationwide—accounting for roughly 10% of the U.S.’s current daily production. (Source: Austin, S., “North Dakota Oil Boom,” Oil-Price.net, August 13, 2012, last accessed July 11, 2013.)

And while there are numerous players in the production of shale oil, one of the key ones in North Dakota’s Bakken oil fields is Continental Resources, Inc. (NYSE/CLR). The company controls nearly one million net acres in the region.

Continental Resources Inc Chart

Chart courtesy of www.StockCharts.com

In the first quarter, Continental Resources reported net production of about 121,500 barrels oil equivalent (BOE) daily, which included 76,900 BOE from its Bakken shale play in North Dakota and Montana. And the projections are extremely bullish, as the company has targeted a whopping 603,000 BOE for its North Dakota wells, along with 430,000 BOE for its wells in Montana. (Source: “Continental Resources Reports First Quarter 2013 Results,” Yahoo! Finance, May 8, 2013, last accessed July 11, 2013.)

If these numbers pan out, it would become one of the world’s top oil-producing areas, accounting for around 3.3% of OPEC’s current total daily production.

Another key player in the Bakken region is Whiting Petroleum Corporation (NYSE/WLL), with close to 600,000 net acres in North Dakota.

So while OPEC will continue to dominate the global oil market, the state of North Dakota is becoming the biggest big-oil sensation in North America since the tar sands in Alberta. That’s bad news for OPEC, but good news for investors.

Article by profitconfidential.com