USDJPY broke above 100.00 resistance

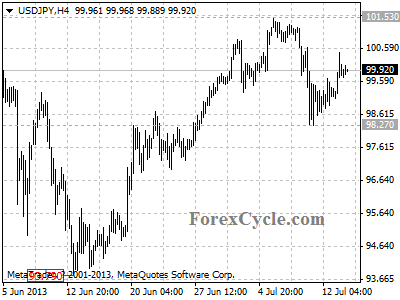
USDJPY broke above 100.00 resistance and reaches as high as 100.48, suggesting that the downward movement from 101.53 had completed. Further rise to test 101.53 resistance could be expected in a couple of days, a break above this level will indicate that the uptrend from 93.79 has resume, then the following upward movement could bring price to 110.00 area. On the downside, as long as 101.53 resistance holds, the rise from 98.27 would possibly be correction of the downtrend from 101.53, one more fall to 95.00 to compete the downward move is still possible.

usdjpy

Provided by ForexCycle.com

The Arabic World, Nuclear Discussions?

Article by Investazor.com

One month ago, Hassan Rowhani was elected president in Iran raising hopes for the beginning of a more stable and peaceful period. A clarification concerning the nuclear dispute with the West represented one of the main expectations. Today, Iran comes again to the attention of the world, being suspected about never interrupting its nuclear program, even more, developing it at considerable proportions. The doubts were given by the weak collaboration of Iran with IAEA (International Atomic Energy Agency).

Israel is threatening to step in, without waiting for a possible intervention of the U.S., understanding the risks to which it is subject. The third actor of the Arabic world, Saudi Arabia, is perceiving both Iran and Israel as possible dangers. In this regard, it is suspected to prepare a military attack over the two countries. The Arab states are trying to prevent each other from building nuclear weapons. This not only that would start a new trend concerning the acquisition of weapons among the Arabic countries, but it would also increase the risk of a nuclear war that would be devastating for the entire planet.

The post The Arabic World, Nuclear Discussions? appeared first on investazor.com.

The Turkcell Fiasco: What Can We Learn?

By The Sizemore Letter

It’s been a long couple of years, but the three-ring circus that is Turkcell’s ($TKC) boardroom power struggle is finally (sort of) coming to an end.

Queen Elizabeth’s Privy Council—which had jurisdiction because the holding company in question was domiciled in the British Virgin Islands (LONG story there…)—ruled last week that Mehmet Karamehmet may reacquire control of the company if he pays the $1.56 billion owed to a Russian-backed investor group.  This little spat dates back to the 2007 default on a loan in which the Turkcell shares were used as collateral.

Turkcell’s board of directors has been paralyzed by this squabble between its two biggest shareholder groups to the point that it hasn’t paid a dividend since 2010.  The company never actually cut its dividend, mind you.  Turkcell’s underlying operations have chugged along just fine, and it has plenty of cash available.  The dividend hasn’t been paid because the board of directors is so dysfunctional, they can’t sit in a room together long enough to declare it.

But while Mr. Karamehmet is busily getting the funds together to repay the debt,  the story doesn’t end here.  To start, Karamehmet was recently sentenced to seven years in Turkish prison due to completely unrelated charges dating back to the financial crisis of 2000-2001.  And even with the shift in controlling ownership, the board is still deadlocked…at least pending intervention by the Turkish government.  Turkish regulators have promised to appoint new directors and effectively take over control of the company to break the impasse.

While this story may have comedic value, there are actually some valuable lessons we can learn.

In InvestorPlace’s Best Stocks of 2012 contest, I came within a single percentage point of winning with my selection of Turkcell—which returned 37% on the year.  A major plank in my bullish argument was that a resolution of the boardroom crisis—which I expected in early 2012, over a year too soon—would mean a major short-term boost to the share price and the possibility of a massive, multi-year dividend payment.

I was dead wrong about that.  Yet Turkcell still had a great year.  Why?

It comes back to that old concept of margin of safety—or what Warren Buffett and Charlie Munger playfully call a “belt and suspenders” approach.  If an investment is strong enough and offers enough value, you can afford for large parts of your investment thesis to be wrong or for some unexpected bump in the road to happen.  If the belt fails, the suspenders will keep your pants from falling down.

Turkcell’s corporate governance at the board level was a joke.  But operationally, its management team was led by top-notch, Western-educated professionals.   Turkcell had (and still has) a dominant position in a critical industry in one of the fastest-growing emerging markets, and is a major player across Eastern Europe and the Middle East.  And the company consistently ranks as one of the highest-quality telecom providers in Europe—meaning it compares favorably with international giants like Spain’s Telefonica ($TEF) and Britain’s Vodafone ($VOD).

Furthermore, Turkey was an underrated emerging market at the time.  In early 2012, “emerging markets” meant the “BRIC” countries of Brazil, Russia, India and China.  But as that investment theme was looking a little long in the tooth to me, I expected investors to expand into lesser-followed markets like Turkey.  And until the recent Taksim Square political crisis, that is exactly what happened.

I expected a quick (ha!) resolution of the boardroom crisis to be the catalyst that caught investors’ attention but that the great underlying fundamentals would be what ultimately drove the stock higher.  I was wrong about the catalyst…but in the end, it didn’t matter.  Often, a quality stock trading at an attractive price creates its own catalyst.

DDAIF

My choice in InvestorPlace’s 2013 Best Stocks contest is German automaker Daimler ($DDAIF).  And again, it looks like I am wrong about the catalyst (strong Chinese growth) but right about the stock.

China’s growth continues to slow—and Europe is in outright recession—yet Daimler has cruised to 27% returns year to date, including dividends.

When I first recommended Daimler, a third of its market cap was in cash and it traded at a single-digit price earnings ratio.  At its then-current valuation, it was hard for me to imagine a scenario whereby I could lose money in Daimler over any reasonable time horizon.

Again, a quality stock trading at an attractive price has proved to be catalyst enough.

Sizemore Capital is long TEF and DDAIF.

SUBSCRIBE to Sizemore Insights via e-mail today.

Why Great Stocks Drop Hard and Reverse

By David Banister – Chief Strategist- ActiveTradingPartners.com

Institutional sell programs and bots cause disruptions:

One thing that will always over rule charts and technical analysis is fundamentals in the long run.  To be sure, I love technical analysis but I always combine my work there with fundamental research. I rarely if ever buy a stock just because the chart looks nice, that is almost always a recipe for disaster.

With that said, how many times have you seen a good company with strong fundamentals and a seemingly great looking chart break down over 1-2 weeks and take everyone out of the trade?  Then for sure, the stock reverses right back up all the way back to where the decline began?  To make matters worse, this happens without any real news or any bad news as it were.  What is it that causes these crazy down the mountain and up the mountain moves anyways?

Insitutional Sell Programs— sometimes referred to as “Bots” or “Algo” program trading

How does it work?

In an apparently strong fundamental growth stock with no apparent issues, an institution will have a pre-defined price at which point instructions are triggered to liquidate the entire position almost at any price once that price point is hit. They protect themselves ahead of time with Puts, which give them profits if the targeted stock drops hard while they are selling out of the position, thereby locking in their targeted sell price.

Lets take several examples below with 3 month charts to show you exactly how they look on paper. If you can learn to spot these moves you will be more likely to add to positions on big declines rather than selling out at a loss as all the stops trigger along with the margin calls:

The stocks we will chart out here are AMBA, DATA, DECK, and GILD.  All strong companies with good growth profiles:


715 amba


715 data


715 deck


715 gild


So what have we learned?  In a Bull cycle buy the dips on the stronger fundamental stories when the Algo and Institutional programs start kicking in.  Don’t panic out of your position at a loss, study the fundamentals and trust your instinct.

Join us at ActiveTradingPartners.com as we take advantage of exactly these types of swings all the time. Learn more at www.activetradingpartners.com


Continuous Commodity Index Points to Rally in Gold & Silver

By Chris Vermeulen, GoldAndOilGuy.com

During the recent weeks we have seen commodities especially precious metals continue to drop in value. Market participant sentiment has become more bearish on commodities and couple that with a rising dollar it’s no wonder why we continue to see commodities as a whole fall in value.

Money has been flowing out of bonds at record levels this summer telling us most of market participants are feeling bullish on the stock market. This shift in sentiment of the masses are typical as they move their money from the risk on safer assets (bonds & commodities) and rotate into risk-on assets like stocks. While this is a bearish (contrarian sign) stocks could easily continue to rally for an extended period of time and possibly several more months before they actually top out.


Let’s take a look at the financial market business cycle diagram:

Bond prices have been falling for months and they typically lead the stock market lower. I feel we are starting to enter the phase where stocks will soon top and head lower also. Once this starts money will naturally flow into safer assets that are more tangible like commodities.

Keep in mind this cycle is very slow moving and rotation from one phase to another takes months. This is a process not an event but it is still very tradable.

JMCycle


Now let’s fast forward to precious metals both gold and silver are likely to do in the next couple months. If you review the charts below you will see gold and silver bullion prices are looking primed for a bounce/rally from these deep oversold levels.


Gold Weekly Price

gold


Silver Weekly Price

sil;ver

Take a look at a basket of commodities through the GCC ETF.

GreenHaven Continuous Commodity Index Fund (GCC) is an Exchange-Traded Fund (ETF) that provides an innovative and efficient way to deliver broad based, diversified commodity exposure. It aims to achieve this by using futures contracts to track the Thomson Reuters Equal Weight Continuous Commodity Total Return Index (CCI). The CCI-TR is an equal weighted index of 17 commodities plus an additional Treasury Bill yield. Because of the equal weighting, GCC offers significant exposure to grains, livestock, and soft commodities and a lower energy weighting than many of its peers. In addition, GCC is rebalanced every day in order to maintain each commodity’s weight as close to 1/17th of the total as possible.

So, knowing metals are 24% of the index it bodes well for a bounce in the overall commodity index. Keep in mind this report is only focusing on precious metals, but many other commodities look ready to rally also like natural gas.

GCC-H


GCC – Continuous Commodity Index Fund Weekly Trading Chart

The chart below shows a very bullish 4 year chart pattern. At the very minimum a bounce to the $29 is highly.

gcc


Commodity Basket Trading Conclusion:

In short, commodities as a whole remain in a down trend. Until they show signs of real strength I will not be trying to pick a bottom. Several commodities are starting to look oversold and ready for a bounce like sugar, coffee, copper and natural gas.

Last month I talked about how a major market top is likely to unfold during the second half of this year. I still believe this to be true. But keep in mind these major market tops which only happen every few years are a MAJOR PROCESS. They take time to form and often we will see a series of new highs followed by quick sell offs as the market gets more people long as they big money distributes their shares/contracts into the new money rotating into the market.

If you want more reports and trade ideas join me at www.GoldAndOilGuy.com

Chris Vermeulen


China’s Surging Demand “Supporting Gold” as Retail Sales Defy GDP Slowdown

London Gold Market Report
from Adrian Ash
BullionVault
Monday, 15 July 08:05 EST

LONDON prices for physical gold held little changed Monday morning, edging lower from the best weekly finish in three as new data showed China’s economic growth slowing but retail sales rising sharply.

 Asian and European stock markets ticked higher, but commodity prices fell back, with crude oil dropping 0.7%.

 A rise in the US Dollar saw gold for Euro and UK investors briefly touch three- and four-week highs respectively.

 Silver prices ticked down to $19.84 per ounce, some 3.4% higher from Monday lunchtime last week.

 “There’s support from Asian interest in gold,” says Standard Bank’s weekly market positioning note, citing reports of “strong physical buying in China.

 “Reportedly, some retailers ran out of gold bars and gold jewellery. Confirming this are the physical flows we have seen in Asia.”

 “Investors here remained big buyers this year,” says strategist Fu Peng at the state-owned Galaxy Futures Co. brokerage in Beijing, commenting to Bloomberg on strong deliveries of physical gold from the Shanghai Gold Exchange.

 New data Monday showed the SGE supplying 1,098 tonnes of gold in the first half of 2013, more than 94% of last year’s entire total.

 China’s economy meantime grew by 7.5% in the second quarter, the official data agency said this morning, the slowest rate in three years.

 Industrial production slowed to 8.9% growth.

 Retail spending, in contrast, grew faster than analysts forecast at 13.3% year-on-year.

 “Household consumption is very low as a proportion of GDP,” said China specialist and Peking University professor Michael Pettis in an interview with the Financial Times last week.

 “There’s a myth this is because households save a large proportion of their income,” he explained. “But it’s because the household share of GDP is very low.”

 To rebalance away from exports and government investment without causing civil strife, Pettis believes, Beijing has to keep household income growing strongly whilst total GDP slows towards 3% annual growth.

 “It’s possible but difficult.”

 For Renminbi buyers, the price of gold fell 24% in the second quarter of 2013.

 Shanghai premiums on gold bullion today held more than $30 per ounce above the international benchmark set by London pricing.

 “The strength in China and India gold premiums,” says a note from bullion market-makers Deutsche Bank, “[plus] the recent move higher in gold lease rates and central bank gold buying indicate physical demand for gold may provide some support in the near term.”

 Lease rates to borrow gold have risen this month, whilst the “swap rate” – offered by large gold holders in exchange for cash, which can earn them interest and then be swapped back at the end of the contract – has gone negative, also forcing would-be borrowers to pay more.

 But whether “from miners’ hedges or from investors rolling short positions,” says a note from another London market maker’s trading desk, “the move on gold rates (swaps down, lease up) have been well documented and is clearly the result of that activity involving bearish strategies.”

 “Although gold lease rates [have] moved moderately higher,” adds Jonathan Butler at Japanese conglomerate Mitsubishi, “the effect of this is insignificant in an historical context and reflects a short term rebalancing of ‘paper’ and physical gold demand.”

 Latest data from US regulator the CFTC showed Friday that speculative traders cut their bullish position to new multi-year lows as a group.

 Taking all professional traders’ bearish bets away from their bullish bets, so-called “net speculative length” fell below the equivalent of 87 tonnes in the week-ending last Tuesday.

 That’s a drop of 82% from the start of the year, and more than 90% below the record peak of August 2011 – hit just before the gold price reached its record high of $1920 per ounce.

 This latest drop in speculative length came after stronger-than-expected US jobs data, says Standard Bank’s commodity team, calling the 11.1 tonnes lost a “more muted reaction” than previous “Fed-related” sell offs

 “[This] points to a market that is becoming more comfortable with the prospect of a paring of Fed quantitative easing.”

 Meantime in Turkey today – the world’s 4th largest gold buying nation – central bank chief Erdem Basci it will consider raising Lira interest rates at its next meeting, as well as extending easier credit to export companies, to defend the country against sharp outflows of foreign investment cash.

 Last Monday alone, the State Bank sold dollars to buy $2.25 billion of Lira – spending some 5% of its FX reserves – as the Turkish currency fell to new record lows, down 20% since February.

 With Basci blaming “elevated global uncertainty and volatility” today, the Lira rose from fresh all-time lows.

 Since late 2011, Turkey has risen from 26th to 13th place amongst central-bank gold bullion holders by allowing commercial banks to hold some of their reserve requirements in physical gold, gathered in turn from household gold depositors.

 The domestic gold price for Turkish investors has dropped 19% so far in 2013.

Adrian Ash

BullionVault

Gold price chart, no delay | Buy gold online


Adrian Ash is head of research at BullionVault, the secure, low-cost gold and silver market for private investors online, where you can buy gold and silver in Zurich, Switzerland for just 0.5% commission.


(c) BullionVault 2013

Please Note: This article is to inform your thinking, not lead it. Only you can decide the best place for your money, and any decision you make will put your money at risk. Information or data included here may have already been overtaken by events – and must be verified elsewhere – should you choose to act on it.


Europe stocks climbs on China’s GDP

By HY Markets Forex Blog

Markets in Europe rose, as the Chinese economic growth for the second quarter matched the analysts’ forecasts of 7.5%.

The pan-European Euro Stoxx 50 advanced 0.59% higher 2,690.67, while the French CAC 40 gained 0.76% to 3,884.29. The German DAX added 0.61% to 8,263.52 and the UK FTSE 100 climbed 0.74% higher to 6,592.30. Standard & Poor’s 500 Index rose 0.2 %, as the MSCI Asia Pacific gained 0.1 %..

Earlier, reports released from the National Bureau of Statistics (NBS) showed that the Chinese gross domestic product (GDP) for the second quarter expanded by 7.5% as predicted by the analysts, down from the economic growth 7.7 % for the first quarter.

NBS spokesman Sheng Laiyun said he had a positive prospect on the Chinese economic growth and the economic fundamentals behind the world’s second biggest economy.

According to Sheng Laiyun, the National Bureau of Statistics (NBS) carried out a survey with over 200,000 Chinese companies, which showed more than two-thirds of the companies that took part of the survey had a positive outlook for the Chinese economy.

Stocks in the Asian market were also seen higher, after the Chinese GDP matched analysts’ predictions, while the markets in Japan were closed for public holiday.

The Chinese Shanghai Composite advanced 0.80%, closing at 2,059.39, while the Hong Kong Hang Seng gained 0.01% to 21,280.51.


The post Europe stocks climbs on China’s GDP appeared first on | HY Markets Official blog.

Article provided by HY Markets Forex Blog

China stocks climbs as GDP matches forecasts

By HY Markets Forex Blog

In Asia, stocks were seen opening green on Monday, after the Chinese gross domestic product (GDP) for the second quarter corresponded with analysts’ predictions, expanding by 7.5 percent. However, the GDP reports showed the Chinese economy was growing at a slower pace compared to the first quarter.

The Markets in Japan were closed for a public holiday.

The Chinese Shanghai Composite gained 1.07% to 2,069.16 at the time of writing, while the Hong Kong Hang Seng advanced by 0.43% to 21,310.95.

The Australian S&P/ASX 200 rose 0.12% at 4,979.80, as the South Kospi advanced 0.28%, closing at 1,875.98.

The Chinese gross domestic product (GDP) advanced 7.5%, compared to previous quarter’s economic growth of 7.7 %, according to reports from the National Bureau of Statistics (NBS). Indicating a slow growth in the past three months, due to the low international and domestic demand.

Sheng Laiyun spokesman to NBS said that the National Bureau of Statistics (NBS) carried out a survey with over 200,000 Chinese firms and companies, which indicated more than two-thirds of the people that took the survey, had a positive outlook on the Chinese economy.

The Chinese economy is expected to grow to an average 6.9% next year, compared to previous forecast of 7.8%, according to the financial group.

The Chinese industrial sector, showed an average year-on-year growth of 8.9% in June, down from previous forecast of 9.1%, according to the National Bureau of Statistics.

The post China stocks climbs as GDP matches forecasts appeared first on | HY Markets Official blog.

Article provided by HY Markets Forex Blog

Central Bank News Link List – Jul 15, 2013: China central bank chief says growth under downward pressure

By www.CentralBankNews.info Here’s today’s Central Bank News’ link list, click through if you missed the previous link list. The list comprises news about central banks that is not covered by Central Bank News. The list is updated during the day with the latest developments so readers don’t miss any important news.