WTI futures drops on low US stockpiles record

By HY Markets Forex Blog

The West Texas Intermediate crude futures declined on Thursday despite the fall in US oil inventories. Prices remain high as analysts warn that current price level may be weak. However, Brent futures were seen trading lower, but still above the $108 level.

The West Texas Intermediate delivery for August, as the New York’s NYMEX were seen traded slightly fell 0.25% lower to $106.09 a barrel on Thursday. The Brent futures declined 0.13% to $108.47 a barrel.

WTI futures rose on Thursday, when it reached $107.45 a barrel, reaching a five-month high after the US stockpiles fell for the second week.

WTI gained 0.5% after falling in response to the US Energy Information Administration’s (EIA) report showing a drop in the US crude inventories.

The reports released on Wednesday indicated that the stockpiles dropped by 6.9 million barrels to 367 million in the previous week ending July 12.

Reports from the EIA showed that the US refineries processed the most crude in 8 years, as the high-on-demand season is peaking in the Northern Hemisphere.

On Thursday, American Petroleum Institute (API) was leaked showing the readings were in line with EIA. The leaked report suggests that the API may report supplies up 3.8 million barrels.

Saudi Arabia shipped 7.79 million barrels of oil a day in the month of May, highest since last year June, according to reports from the Joint Organization Data.

The post WTI futures drops on low US stockpiles record appeared first on | HY Markets Official blog.

Article provided by HY Markets Forex Blog

Europe market expected to open negative

By HY Markets Forex Blog

The Markets in Europe are expected to open negative on Thursday after the Federal Reserve (Fed) Chairman Ben Bernanke said the bank’s monthly asset-purchase program is depending on the economic and financial progression, which are currently not strong enough. While in Spain, the auction for the benchmark bonds is expected to proceed.

The European Euro Stoxx 50 fell 0.32% lower at 2,671.50, while the German DAX futures were 0.26% down. The French CAC 40 futures were seen 0.36% lower at 3,858.50, while the UK FTSE futures declined 0.15% to 6,514.50.

Fed Chairman Ben Bernanke stated on Wednesday that the central bank are targeting  cutting down its bond-buying program by the end of this year ,however  he added the labor mark outlook could worsen if  inflation goes below the banks 2% aim .

“I emphasize that, because our asset purchases depend on economic and financial developments, they are by no means on a preset course,” Bernanke said to the House Financial Services Committee.

He said even though the central bank may slowdown its bond-buying program earlier than expected, Fed Chairman Bernanke mentioned if the financial and economy condition don’t show any further improvement, the bank would push back any plans or development for cutting down the bond-buying program.

According to the Beige book report from the Fed meeting, the US economy is continuing to grow at a moderate pace in the past month since first week of June.

The euro zone current account is expected to show a sum of 21.3 billion for May on a seasonally adjusted basis, compared to previous record of 19.5 billion for the month of April.

While in Spain, the governments are expected to sell Treasury bonds maturing in 3, 5 and 10 years with coupons of 3:30%, 3.75% and 4.40%.


The post Europe market expected to open negative appeared first on | HY Markets Official blog.

Article provided by HY Markets Forex Blog

Read This Before You Buy Another Stock or Bond…

By MoneyMorning.com.au

US Federal Reserve chairman Ben Bernanke fronted up to Congress for his testimony to the House Financial Services Committee last night our time. After his comments last week sent stocks skyrocketing, everyone was waiting to see if he would continue with his dovish tone.

He didn’t disappoint when he said ‘I emphasize that, because our asset purchases depend on economic and financial developments, they are by no means on a pre-set course.

Financial markets began to rally on these words, but it was a muted rally. As Goldman Sachs said in their round up as reported on ZeroHedge: ‘despite having ample opportunity, the Chairman did not significantly push back on expectations that tapering would begin in the next few FOMC meetings.

So it looks like tapering is still well and truly on the table later in the year, but the goal posts could be shifted if worse data than expected starts coming in…

Thus begins the twilight zone of good is bad and bad is good. If data continues to improve at a faster pace than expected then tapering may be brought forward and increased and stocks and bonds could suffer. If data falls off a cliff then tapering will be delayed and stocks and bonds may rally.

Forget spending years at university studying macroeconomics and fundamental analysis of stocks. The US Fed is the only game in town and that’s all you need to know about.

I will be interested to see how markets react over the next few days to the slightly less dovish tone of Bernanke’s testimony. After a very sharp rally over the last month the S&P 500 is retesting all-time highs. I would expect to see a pullback from overbought levels if the market is disappointed by Bernanke’s comments.

ASX 200 Diverging From AUD/Yen

There have been some interesting developments in the relationship between the ASX 200 and the Aussie/Yen in the past month. I’ve mentioned how closely the two have tracked each other over the past few years on many occasions.

ASX 200 vs Aussie/Yen

I’m still amazed when I look at the above chart and see how strong the relationship is between the two.

There is little doubt that the relationship has broken down on this most recent rally in the ASX 200. When you look at the rally in the ASX 200 within the ellipse it is quite clear that the Aussie/Yen isn’t coming along for the ride.

What could this mean?

Investors have borrowed in Yen and invested money in Australia which has caused the Aussie/Yen to rise along with the stock market as those investors bought stocks and bonds.

As a result it may not be so far-fetched to say that the current rally isn’t being caused by carry traders loading up on risk again. If it was, then you would expect to see the currency rising alongside the stock market.

If this rally isn’t being caused by the thing that has been so instrumental in our stock market rally of the past year then what is causing it? Perhaps the rally is just a bout of short covering and soon enough the buying will peter out and the ASX 200 will turn down and reconnect with the Aussie/Yen.

Of course the Aussie dollar may be nearing the end of its current downtrend and we may see the Aussie/Yen jump to meet the ASX 200, in which case we could become more confident of the staying power of the rally. But at the moment I think the large divergence that has opened up between the two brings the current rally into doubt.

Another thing that I have my eye on is my ATR indicator.

The ATR indicator shows the average true range (including overnight gaps) of a stock/index over a certain period of time. It’s a quick gauge of price volatility. I like to tweak the indicator by taking the ATR value and then dividing it by the price of whatever I’m studying so that you end up with a percentage of the price as the average true range number. I use the 10 period ATR.

I then overlay the indicator and invert the scale so that you can see the relationship between changes in price and volatility.

ASX 200 and ATR Per Cent Indicator

This indicator is most useful when looking for divergence between prices and volatility. You can see from the above chart that there have been a few instances over the past few years where the indicator gave a great warning sign about an impending decline.

In early 2011 (inside the first circle) you can see where prices and volatility diverged. The stock market shot to new highs but the ATR indicator didn’t go along for the ride.

In other words volatility was still high even though you would expect volatility to fall during market rallies that are sustainable. (Remember the scale for the ATR indicator is inverted so when the indicator rises in the chart it is saying that volatility is falling).

Sure enough, the stock market made a new high but then promptly fell over and began what was a 1300 point dive over the next five months.

Fast forward to May this year and you can see that the same thing happened again. Prices rallied from the end of April to the middle of May but the ATR indicator didn’t go along for the ride. Yet again, prices topped out and then fell in a straight line to 4700. That set-up was one of the reasons why I predicted the fall in the ASX 200 at the time.

The current rally is not being confirmed by the ATR indicator, so I’m sticking to my guns and saying that this rally is a bull trap and will soon enough run out of puff and turn back down.

Murray Dawes+
Editor, Slipstream Trader

Join Money Morning on Google+

From the Port Phillip Publishing Library

Special Report: The Sixth Revolution

Daily Reckoning: A Structurally Sick Economy

Money Morning: With Gold, Don’t Miss the Top

Pursuit of Happiness: The Dark Side of Technology

Rising Oil Prices Are All About Egypt…Or so Some People Say

By MoneyMorning.com.au

The price of oil is rising lately, due to ‘events in Egypt’, as the saying goes. Well, yes. Despite being home to modest oil output with zero net oil exports, Egypt owns the Suez Canal. Thus, disruptive events in Egypt can move oil prices, at least in the short term while oil operators reroute large tankers.

Indeed, here’s the recent oil price chart, showing a rise of $8 or so per barrel (via the Brent crude benchmark) in the past few weeks:

When you fit the oil price chart to recent news events, it’s not hard to determine that something happened somewhere. No doubt that, say, the Saudis are pleased that their daily oil exports now yield another $80 million to the royal family bank accounts with which to pay for princely perks.

The Egypt Oil Story

Of course, as you doubtlessly know, in mid-June, about 14 million angry Egyptians took to their local streets. Poor and hopeless beyond most outsiders’ ability to comprehend – and really, you’ve got to visit Egypt to see how badly off the people are! – the (literally) starving, jobless masses protested the year-old government run by elected ideologues of the Islamist Muslim Brotherhood.

In response to evident repudiation of a ‘democratically elected’ government (long story there…), the well-fed Egyptian military guys answered the call by removing the clerical fascists who were and are, by most metrics, utterly incompetent to govern. Judge not, lest ye be judged, I suppose.

So that’s the recent Egypt oil story, or so some people say. Rising oil prices are all about Egypt, or so some people say.

Long-Term Oil

Then again, let’s step back and look at how Egyptian events fit into the long-term oil picture. Here, for example, is the oil price chart since the year 2000:

As you can see, long-term trends in oil prices follow a path of their own. That short, tight price spike in 2001 was – you know this – the oil market’s response to the Islamist terror attack on the US on Sept. 11 of that year.

A few years later, the big oil price run-up in 2007 and 2008 was due to the global financial melt-up. The price crash of 2008 was due to…well, the Crash of 2008.

Oil prices recovered in 2009-2011. This was not due to any significant economic recovery in the West, to be sure. Neither North America nor Western Europe was the world’s ‘economic locomotive’, to use a term from the olden days of the 1980s.

No, rising oil prices in 2009-2011 were due to energy demand growth across global emerging markets – certainly China, but also India and a host of other smaller economies.

Indeed, Western oil demand has fallen in recent years across the US, Canadian and Western European economies. Meanwhile, fast-growing, emerging markets bid up the price for marginal barrels.

The oil price plateau of 2011 through now – that $95-115 range for the Brent Crude posting – was due to a combination of extreme economic distress in Japan (Fukushima meltdown) and Europe (eurozone meltdown) plus lingering recession in North America.

Now add in the evolving slowdown in China growth. (One acquaintance just got back from Beijing and stated categorically that ‘Everything big has stopped in China.‘ Uh-oh.)

Finally, of course, add in the oil supply increase from US and Canadian fracking. There’s your lack of significant oil price movement over the past two years, one way or the other.

Egypt’s Background Noise

So let’s get back to the first point I made in this note. Where do events in Egypt fit into this oil price picture?

Egyptian issues are important to people who are caught up in the day-to-day matter. It’s arguable that Egyptians – in both the street and the halls of the general staff – did what they had to do to remove a government that was on the verge of totalitarian rule while tipping the ancient nation into economic collapse, if not mass starvation.

(And note that post-takeover, the Russians and Chinese immediately offered food aid to Egypt, while the US promised four more F-16 fighter-bombers to the generals.) In the large picture, however, recent events in Egypt are background noise to long-term energy trends.

The Oil War Scenario

Of course, those same recent events in Egypt might presage a looming cultural clash across the Middle East, with wider impact on future energy prices. That’s another story, and it’s part of the ‘oil wars’ scenario that we’ve developed here over the past few years.

It’s not that Egyptian oil is so important to the world. Egypt’s oil – what the nation produces and what it imports – is not a big number to world markets. You can see how exports to the global market (green) have been declining for years, here:

But the short version of ‘oil wars’ is that religious-based turmoil anywhere in the Middle East has the potential to disrupt oil flows and drive prices in a big way.

When nations fall apart in the Middle East, oil volumes get disrupted almost by definition. The disrupted oil could be anything from a few hundred thousand barrels per day (as with the Libyan civil war of 2011) to 10 million and more barrels per day (imagine the Strait of Hormuz closing). It can be enough to move prices.

So Egypt’s politics could affect other nations in the region. Thus, my view is to stay away from investments that are too exposed to turmoil in the Middle East. Focus more on producers far from the Middle East, as well as the drillers and service companies that make the oil wells happen.

Byron King
Contributing Editor, Money Morning

Publisher’s Note: This article originally appeared here.

Join Money Morning on Google+

From the Archives…

Quantam Computers – Why It’s Time to Believe the Unbelievable
12-07-2013 – Sam Volkering

Red Alert: Why This Stock Market Rally is a Trap
11-07-2013 – Murray Dawes

Why Oil Could be the One Commodity to Defy the Doom…
10-07-2013 – Dr Alex Cowie

Gold Breaks A Record
9-07-2013 – Dr Alex Cowie

Time to Plan for the Year-End Stock Rally?
8-07-2013 – Kris Sayce

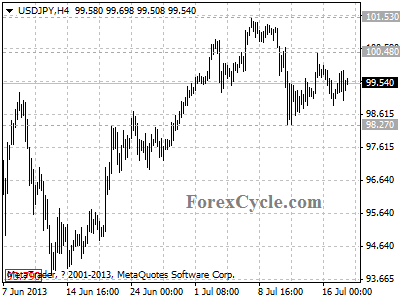
USDJPY moves sideways between 98.27 and 100.48

USDJPY moves sideways in a range between 98.27 and 100.48. Resistance is now at 100.48, as long as this level holds, the price action in the range could be treated as consolidation of the downtrend from 101.53, and another fall to 95.00 to complete the downward movement would likely be seen after consolidation. On the upside, a break above 100.48 will indicate that the uptrend from 93.79 has resumed, then the following upward movement could bring price to 110.00 area.

usdjpy

Provided by ForexCycle.com

FED, Took No Decision Today

Article by Investazor.com

Ben Bernanke had a very clean speech, emphasizing all the possible scenarios and the correspondent solutions. He didn’t said that the QE3 is going to be ended at a certain point for sure but neither he said that QE3 will continue for an undetermined period. The key factors of this equation are the signals of the American economy, especially the labor market and inflation. Lately, the U.S. enjoyed positive results and the rising star that lead to such positive news is the housing market.

As for the rest of the year, “a highly accommodative monetary policy will remain appropriate for the foreseeable future”. At a certain point, trying to soften the effects of its last speaking, Ben Bernanke gave the impression that the indulgent measures are of need so the QE3 program and the “forward guidance” represent the main 2 tools which need important reasons before being removed (key levels are expected in the labor market <<6.5%>> and inflation <<near the 2% target>>).

In order to properly end his speaking, Ben Bernanke wanted to notify that “the Committee would be prepared to employ all of its tools, including an increase in the pace of purchases for a time, to promote a return to maximum employment in a context of price stability.”

If we are to compare the pro QE3 attitude of Ben Bernanke today and the contra QE3 ideas that yesterday Esther George transmitted as a representant of half of the FOMC members, which would be the most probable scenario? We wait the tomorrow’s report where the chairman of Fed is expected to take a more clear position.

The post FED, Took No Decision Today appeared first on investazor.com.

USD or JPY what would Investor choose?

Article by Investazor.com

usd-or-jpy-which-investors-will-choose-17.07.2013

Chart: USDJPY, H4

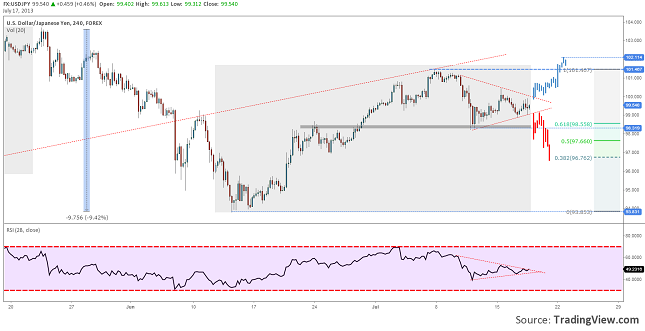
From the top of this year, hit in May, the US dollar lost about 9.5%. It managed to recover about 78% of this fall after Federal Reserve announced that it will start tapering the QE program this year and stop it in 2014.

Yen is becoming a week currency because of the monetary easing started by BoJ. The program already shows an improvement in Japan’s economy so the Central Bank will maintain it a current values until the end of the year. They are targeting deflation and the devaluation of the currency, in their opinion, is just the effect.

During the past 7 days USDJPY has consolidated in a symmetrical triangle right under the 78.6 retrace of the latest impulse of the main uptrend. This means that investors are not yet convinced in which currency to invest. While they are waiting for further signals from the Central Banks, we can look for technical signals to understand in which they will invest next.

If the price will break the upper line and close on a 240 minutes time frame above it could trigger a new rally for the US dollar and target the 102.00 price. On the other hand, if the price will close under the lower line we might witness a drop to 96.70 (the 61.8 Fibonacci retrace of the uptrend).

The post USD or JPY what would Investor choose? appeared first on investazor.com.

Is Canada’s Oil Charm Offensive Yesterday’s News?

By OilPrice.com

Canadian oil production is expected to be in a boom cycle for the next 20 years or so, fed largely by oil sands production in Alberta. Smaller players in the vast oil sands region are already making a splash with new operations while majors like TransCanada and Enbridge are quickly getting back to work following last month’s flooding. Canadian Prime Minister Stephen Harper said parts of Quebec look like a “war zone” following last weekend’s train wreck. With a fight on his hands to counter the dirty oil narrative, his administration, and those invested in the energy sector, may face more combat in the future if the oil sands engine runs out of track.

The Canadian Association of Petroleum Producers expects national oil production to hit 6.7 million barrels per day by 2030, more than double the production level from last year. North American oil production is so strong that it’s too much for existing pipeline capacity to handle. Canadian energy company Enbridge just got its pipeline services back on stream following devastating floods in oil-rich Alberta. It aims to build the mega Northern Gateway pipeline to British Columbia for energy-hungry Asian markets. On the other side of the country, Harper was forced to deal with the “war zone” left over when an oil train derailed in a Quebec town near Maine, refueling the oil debate on both sides of the border.

CAPP said oil production from Alberta is expected to make up about 75 percent of the production gains through 2030. While no secret to those in the industry, oil sands production has been in the public’s eye for the past few years because of the debate surrounding TransCanada’s planned Keystone XL pipeline from Alberta through the United States. In the shadow of giants like Enbridge and TransCanada are juniors like Aroway Energy, which said Wednesday it got the nod from the Alberta Energy Regulator to increase production from its Kirkpatrick Lake operations in the province. CEO Chris Cooper said the approval “could not have come at a better time” because oil prices are at all-time highs for the year. The boom from Alberta is such that even OPEC stood up and took notice in reporting this year.

Harper spent last month trying to woo European investors to the Canadian economy. European leaders are considering legislation that would put a black mark on Alberta’s oil sands because they’re seen as more polluting than other types of crude oil.  Canadian Natural Resources Minister Joe Oliver said the Harper administration didn’t want its “reputation sullied” over oil sands.

Aroway in February said it had almost doubled production from 600 to more than 1,000 barrels of oil equivalent per day in quick fashion thanks to Alberta oil sands. Rival majors like Talisman Energy, however, are slashing their spending already because of higher operating costs. The U.S. oil boom in states like Texas and North Dakota, meanwhile, may leave Canadian companies in the dust. Harper, for his part, was in enemy territory in a European community already debating how it can outdo renewable energy goals it hasn’t even met yet. The mid-term outlook for even marginal players in Canadian oil sands, like Aroway, looks optimistic. The energy tides may be shifting, however, suggesting that while production may gain steam, Canada’s heavy reliance on heavy crude may run off the rail.

By. Daniel J. Graeber of Oilprice.com

Source: http://oilprice.com/Energy/Crude-Oil/Is-Canadas-Oil-Charm-Offensive-Yesterdays-News.html


Unequivocal Proof That the Housing Uptrend Has Staying Power

By WallStreetDaily.com

One aspect of the housing market recovery that no one can quite agree on is its staying power.

In fact, some pundits believe the burst of this so-called Housing Bubble of 2013 is imminent. It makes for great headlines and head-turns, but not much sense.

For proof, let’s go back in history to August 2006, when homeowners basked in the glory of a 132% rise in home prices over an 11-year span – and, oddly enough, every Tom, Dick and Harriet could afford and qualify to buy at these pie-in-the-sky prices.

The Housing Bubble: Then and Now

Financial institutions – and the government – took turns playing “Let’s Make a Deal.” (Behind the curtain: No money down! Under the box: 0% interest for five years! In the sealed envelope: Bad credit? No income? No problem!)

To add to the insanity, the Fed lowered rates 11 times, from 6.5% to 1.75%, between 2001 and 2004. This was to ensure the American Dream stayed alive and well. But it wasn’t long before the nightmare on Wall Street (and every street in the country) played out.

You know all the gory details… By the first quarter of 2009, home prices had fallen by more than 32% from their 2006 peak, and they continued to slide (until now).

Everything is different this time around, though…

  • Inventories today are at record lows, due in part to fewer foreclosures and homeowners stuck with little or no equity in their homes. Yet back then, inventory was sky-high, and homeowners plowed through equity quicker than you could say “bankruptcy.”
  • Today, banks are Scrooge-like, demanding down payments exceeding 20% – even with squeaky clean credit. Back then, buyers often borrowed without any down payment, and banks were more than willing to accommodate them with introductory teaser rates… and dire consequences.
  • Today, the ratio of home prices to income is relatively low. At the end of 2012, house payments represented just 12.6% of monthly income. (Remember, in the pre-bubble period of 1985 to 1999, mortgages took 19.9% of homeowners’ monthly incomes.)

While CoreLogic estimates that home prices have increased 12.1% year-over-year, it’s not exactly fodder for celebration – or bubble labeling, for that matter. As Louis Basenese mentioned in this month’s issue of WSD Insider, “Higher prices alone… promise to help keep the bubble in check… [As this will] encourage more homeowners to list their properties.”

And even if Bernanke pulls the trigger on interest rates, he will move so slowly and cautiously that you may not even notice.

Three ETFs That Speak Volumes

In the end, the housing market is poised to continue its upward momentum unabated. And three ETFs in particular clearly illustrate the upward trend in housing.

The iShares Dow Jones U.S. Home Construction Fund (ITB) has a 62% exposure to the largest homebuilders in the market. The ETF boasts one-year returns of 33.7% and recently moved back above its 200-day moving average.

Then there’s the SPDR S&P Homebuilders ETF (XHB). XHB has less exposure to homebuilders than ITB and invests in companies like Bed Bath & Beyond and La-Z-Boy. XHB has shot up 38.6% in the past 12 months and 10.7% year-to-date. This one is trading north of both its long- and short-term moving averages.

And lastly we have the PowerShares KBW High Dividend Yield Financial (KBWD), which focuses on the financial sector and banks. I know, that dirty, “too big to fail” word again. No worries, though. These days, KBWD holds mostly REITs or other companies in the mortgage financing arena, like American Capital Agency (AGNC), BGC Partners (BGCP) and Annaly Capital Management (NLY). It boasts an 8.13% annual yield and 11.8% year-to-date gain. It, too, is trending above the 200- and 50-day moving averages.

Bottom line: Though housing stocks may ebb and flow in the coming months, it appears that the long-term trend will remain up. And those who took (or take) cover under presumably falling skies may learn this particular history lesson the hard way.

Good investing,

Karen Canella

The post Unequivocal Proof That the Housing Uptrend Has Staying Power appeared first on  | Wall Street Daily.

Article By WallStreetDaily.com

Original Article: Unequivocal Proof That the Housing Uptrend Has Staying Power