The Technology Revolution Begins in Four Days…

By MoneyMorning.com.au

It’s Thursday.

On Thursday’s you expect to read Slipstream Trader Murray Dawes’ top technical analysis (he picked the recent market sell-off like a peach).

So you may be surprised to see me (Kris Sayce) here manning the stall. If you’ve tuned in just to read Murray, don’t panic. Murray will give you his latest key analysis on the markets below.

But before you scroll down, I want to make sure you’re aware of an important development. Because this could be the most important issue of Money Morning I’ve published all year…

By now you probably know that I’ve spent the last six months working on a special project. That included pitching an idea to my publisher and the executive team here in Australia.

It was a tough pitch. After all, I was asking my publisher to spend a lot of money supporting this idea – including hiring a new full time technology analyst.

Anyway, it worked. And the culmination of those six months of effort will come to a head on Monday 17 June with the official launch of Revolutionary Tech Investor.

Revolutionary Tech Investor is a ground-breaking service in Australia…there’s nothing else like it. So, what is it?

Perhaps I can best explain by putting it in context…

Despite what you read every day in the mainstream press about banker bailouts, government debt crises, and central bank money printing, the world is on the cusp of a revolutionary moment in history

I don’t use the word revolutionary lightly. I agree with futurist Ray Kurzweil, who says the 21st century will see more advances in technology than the world has seen in the last 20,000 years.

It will be a world where killer diseases such as heart disease and cancer could become a thing of the past as scientists use high-tech cell treatments to rebuild damaged organs.

It will be a world where electric cars generate more energy than they use. (Sound impossible? It’s not. One prototype has already achieved this.)

And it will be a world where space travel becomes as commonplace as a trip from Melbourne to the Gold Coast or Sydney to Wollongong.

To put this in perspective, you can take the Industrial Revolution and the Internet Revolution, roll them into one and it will still only be a fraction of the technological change you’ll witness over the next 20 years of your life.

To show you what I mean in more detail, last week I sat down with our new technology analyst, Sam Volkering, to discuss the key events and innovations that will herald the beginning of what I call the Molecular Revolution.

We recorded this conversation, and tomorrow you’ll receive part one of this three-part video series. Each video is 10-minutes long.

  • In part one you’ll learn about the advances in artificial intelligence (AI) and immersive technology. If you don’t know what that is, you will (and understand its importance) after you’ve watched the video.
  • In part two you’ll hear Sam talk about the results of his DNA analysis, including the measures he can take to combat his newly-discovered heightened risk of atrial fibrillation.
  • In part three, Sam explains why commercial space travel is no longer science fiction. In fact, holiday trips to the Moon and Mars could happen well within your lifetime.

I’m really excited about this project. It’s truly like nothing else we’ve ever published. If like me you’re sick of reading about central bankers and government bailouts, and you’d rather read about technology and biotechnology breakthroughs, Revolutionary Tech Investor will be a refreshing change.

It will be a banker-free zone. Think about it. What’s more important to your future? Federal Reserve chairman Dr Ben S Bernanke, or some of the amazing revolutionary technologies I’ve hinted at here?

Anyway, you’ll see what I mean soon. Until then, enjoy the rest of today’s Money Morning, and look out for the first of the three-part series in your inbox starting from tomorrow…

Cheers,
Kris

Join me on Google+

Six Revolutionary Technology Trends for the Next 20 Years
6-06-2013 – Sam Volkering

The Incredible World of Graphene
5-06-2013 – Dr Alex Cowie

After the Correction: Gold Stocks Set for the Biggest Gains
4-06-2013 – Dr Alex Cowie

The Single Best Way to Build Wealth: Invest in Business…
3-06-2013 – Kris Sayce

The NSA May Know Your Hat Size, but They Can’t Take Your 3D Printer

By MoneyMorning.com.au

The dominant technology story on everyone’s screen this week has been cyber security and the PRISM scandal. There’s a high chance any data you’ve put online, including email, video, and Facebook posts, has gone through a filter and been analysed by government spy agencies.

This has come glaringly to light thanks to a young chap, Edward Snowden. Edward leaked to the world that the US National Security Agency (NSA) had been monitoring and looking at data from some of the biggest technology companies in the US.

These technology companies include Microsoft, Google, Facebook, Yahoo and Apple.

Now interestingly enough every one of these tech giants has denied being a willing volunteer. Apparently they didn’t freely hand over their databases and customer information to the NSA…hmmm.

NSA: Bigger Stories Are Behind the Headlines

Maybe they’re telling the truth. It’s certainly not the first and won’t be the last time government agencies have sequestered information without due process.

So although the world is up in arms about this complete invasion of privacy and the audacity of the NSA to use and abuse data, what impact has it had on everyone?

Do you now wake up in the morning fearful the email you sent last night with the Grumpy Cat Meme will land you in Guantanamo Bay? I doubt it.

And that’s where the doom and gloom pumped out by media outlets gets confused with the actual impact it has on people.

On a side note, considering the NSA is an almighty powerful government spy agency, you’d think they’d be capable of whacking together a slightly more compelling PowerPoint Presentation.

I’m more concerned they don’t have the skills to create an innovative PowerPoint than the fact they can monitor my Twitter account.

Imagine if the lead analyst on the PRISM project presented that PowerPoint to a Venture Capitalist to pitch the program. The VC’s would have laughed the analyst out of the room!

But NSA and bad PowerPoint’s aside there really isn’t any significant impact on how you live your life day to day. And to be honest, the NSA doesn’t care how many times you watch Gangnam Style on YouTube. And so what if it now knows your shoe size, waist size or hat size because you order clothes online?

Look, I’m not condoning what is going on, and there should be greater transparency as to where our online data goes. But really, there’s much better things to be concerned with in the tech world.

Here’s a perfect example. In the office the one thing that’s rocked our world this week has been the arrival our 3D Printer, the UP Mini.

Now we’ve talked about 3D printing and we’ve seen videos online and no doubt you’ve heard about it too. But what we weren’t prepared for was how mind blowing it really is when it’s happening right in front of you.

Overnight we went from publishers to manufacturers. It was like a goose had laid a golden egg in the office. There were literally 20 people huddled around this printer no bigger than a PC in awe of what was happening right before their eyes.

3D Printed Blue Police Telephone Box


Click to enlarge

Take note; do not underestimate the power of being able to make something from nothing. We’re so pumped by the impact this will have on the world we’ve become unofficial 3D printer groupies.

Today we’re going to print off something very simple. A garden trowel. Now I know that might sound trivial. But think about it like this. It will cost us about 50 cents to make. Why is this important? Because I could go down to Bunnings and pick up the same strength garden trowel, but it would cost me $2.99.

Of course you won’t make up the value of the printer in garden trowels. But the beautiful thing about being able to make things is you can make anything you want, and the opportunities are astounding.

It’s a Technology Revolution Across All Industry

NASA is researching the ability to 3D print in space, doctors are 3D printing life saving devices for people, and scientists are 3D printing food from readily available ingredients. It is truly revolutionary.

The point we’re making here is you will often hear about great tech achievements and sometimes see things on video. But until you experience them first hand like we are, you don’t quite grasp how revolutionary it really is.

3D printing is just one thing that has got us so excited about the potential of new technology to change the world.

It’s not just the world-changing impact these technologies will have, but the revolutionary investment opportunities they also bring. So as these new tech opportunities continue to come we’re making sure you’re the first to know about them through our new tech investment service…Revolutionary Tech Investor.

As Kris mentioned at the top of today’s letter, we’ll send you more details about Revolutionary Tech Investor, including the results of my DNA analysis, soon. Look out for the special emails in your inbox.

Sam Volkering
Technology Analyst

Join me on Google+

From the Port Phillip Publishing Library

Special Report: Buy These Four Yen Dive Stocks Now

Daily Reckoning: The Architecture of Oppression

Money Morning: Zero G for the Australian Dollar is a Shot in the Arm for Miners

Pursuit of Happiness: Government Spies: I Warned of This Trend More Than a Year Ago…

The Secret to Technical Market Analysis

By MoneyMorning.com.au

Kris asked me to spend some time today explaining the way I analyse markets. I’m sure it could become quite confusing if you haven’t had much experience in analysing charts.

The fact is that the underlying principals are actually quite easy to grasp, but they have taken me many years to develop – over 20 years in fact.

The structure of price action can appear mind-bogglingly complex at times. Trying to make sense of the ups and downs is very difficult unless you have a bit of an understanding of a few underlying principles.

I’ll take you through those principles today…

Here’s How to Analyse the Share Market

The first principle of market behaviour that I look at is that false breaks occur far more often than real break outs. A lot of amateur traders spend their time trying to capture break outs and invariably get whipped out of their positions when prices don’t keep going in the desired direction.

Another principle is that traders place their stop losses outside the extremity of the current range. Other traders like to gun for these stop losses so you will end up seeing what I call a ‘widening distribution’ as prices oscillate from one edge of a range to the other, having false breaks of the range.

This lures in traders who are searching to capture breakouts and also stops out any traders who had their ‘stoppies’ placed in the most obvious spot.

Before the market is ready to start trending again you’ll often see between three to seven false breaks of either edge of the range. Obviously as the number of false breaks increase the probability that the current false break could turn into a larger move outside of the range increases.

Another important point to make is that uptrends will begin from a false break of the bottom of the range and vice versa. The best risk/reward spots to join a trend is buying false breaks of the bottom of a range in an uptrend and selling false breaks of the top of the range in a downtrend.

The final point I’ll make is that the point of control which is the middle of the initial range should be seen as a gravitational point around which the rest of the price action oscillates. It will often act as support and resistance, but when it can’t hold a move there is a very high probability that prices will continue in a straight line to the other side of the range.

I use the above principles on widening distributions and then overlay my trending indicators to build up a picture of the current state of the market.

So, What Indicators Do I Use in my Analysis?

My trending indicators are the 10, 35 and 200 day moving averages. I use an exponential 10 day and a simple 35 day and 200 day moving average.

A short term trend is defined by prices being above or below the 10 day moving average. The intermediate trend is when the 10 day moving average is above or below the 35 day moving average and the long term trend is when the 35 day moving average is above or below the 200 day moving average (I also use the 10 week/35 week moving average crossover for this purpose).

It’s the combination between all of these factors that describes the state of the market.

Now that I have outlined some of the basic principles let’s have a look at a live example and make a concrete prediction about what is coming next.

Hang Seng Weekly Chart


Click to enlarge

The above chart is a weekly chart of the Hang Seng, which is the Hong Kong stock market index. If you think the Hang Seng is an obscure chart to pick, it isn’t. Most of the major global indices are easy to trade if you use CFDs. That means it’s just as easy to trade the Hang Seng, the S&P500 or the FTSE 100 as it is to trade the ASX 200 index.

This chart goes back to mid-2009. The initial range which all of the calculations are made off is between about 19,400 and 23,100 and was completed by early 2010. In other words all of the price action that has taken place since then can be understood from this initial range.

The point of control sits at 21,300. (Where we are right now! More on that later.) You can see how the price action has developed over the past few years in relation to what I told you at the start of the article.

We have seen two major false breaks of either edge of the range with the reversal in both false breaks occurring about 0.618 (Fibonacci) outside of the initial range. Prices either found resistance or support at the point of control (February 2012, April 2013) but when the POC was breached we saw a quick move to the other side of the range (early 2010, mid-2011, mid-2012).

The blue line in the chart is the 10 week moving average and the red line is the 35 week moving average. As I said above I use the 10/35 week crossover as a long term trend indicator.

The long term trend has shifted to down only three times in the past four years (the black circles in the chart) and on two out of three occasions we saw a sharp decline with one of them being the beginning of a 30% fall (early 2011).

The Hang Seng is about to send the fourth long term downtrend signal and is busting down through the point of control on a weekly chart.

When you add up the principles above it seems pretty clear that there is a high risk we are about to see the Hang Seng fall all the way to the bottom of the range at 19,400. That would be a 9% fall from here. A weekly close above the 10 week moving average would negate that view in the short term.

I hope I have gone some way towards removing any confusion when I write my articles about the state of the market and where I see the opportunities. Combining my trending indicators with my theories about distributions can be a powerful way to stay in tune with the market.

But if you’re still a little unsure of how it works, don’t worry. Remember, I study charts every day, and have done for the past 20 years. It can take time to identify key patterns that appear in stock and index charts.

Murray Dawes
Editor, Slipstream Trader

Join me on Google Plus

From the Archives…

Bernankenstein’s Financial Monster
7-06-2013 – Vern Gowdie

Six Revolutionary Technology Trends for the Next 20 Years
6-06-2013 – Sam Volkering

The Incredible World of Graphene
5-06-2013 – Dr Alex Cowie

After the Correction: Gold Stocks Set for the Biggest Gains
4-06-2013 – Dr Alex Cowie

The Single Best Way to Build Wealth: Invest in Business…
3-06-2013 – Kris Sayce

Korea holds rate, to watch impact of May cut on inflation

By www.CentralBankNews.info     South Korea’s central bank held its base rate steady at 2.50 percent, as widely expected, saying it would keep a close eye on the impact of last month’s rate cut, changes in external factors and government policies to keep inflation within the bank’s target.
    The Bank of Korea (BOK), which cut rates by 25 basis points last month, said it expects the global economy to sustain its modest recovery but there are still downside risks to growth from “the uncertainties related for instance to the possibility of an earlier-than-expected tapering off of US quantitative easing policy and to the implementation of fiscal consolidation in major countries.”
    The BOK’s description of risks to global growth this month is slightly less pessimistic than in May when it described the risks as “considerable.”
    Economic growth in Korea continues to remain weak though exports have improved and construction investment has risen, the BOK said, adding that it has not changed its forecast for the domestic economy to show a negative output gap for a considerable time, mainly due to the slow recovery of the global economy.
    South Korea’s Gross Domestic Product expanded by 0.8 percent in the first quarter from the fourth, for annual growth of 1.5 percent. The BOK has forecast 2013 growth of 2.6 percent, up from 2012’s 2.0 percent.
    Korea’s headline inflation rate eased to 1.0 percent in May, down from 1.2 percent the previous month, and continuing a declining trend since mid-2011.  The drop was mainly due to lower prices for agricultural and petroleum products and core inflation, which excludes those items, rose to 1.6 percent from 1.4 percent.
    The central bank forecasts that inflation will remain low, repeating its phrase from May. The BOK targets inflation of 2.5-3.5 percent.
    The BOK noted that domestic financial markets had declined due to the possibility of an earlier-than-expected tapering of U.S. quantitative easing and that long-term interest rates had risen while the Korean won had depreciated “to a considerable extent.”
    The won has risen over 10 percent against the Japanese yen this year, putting Korea’s exporters at a disadvantage against Japanese competitors. Korea’s government has drawn up a 17.3 trillion won supplementary budget to boost economic activity.
   
   www.CentralBankNews.info

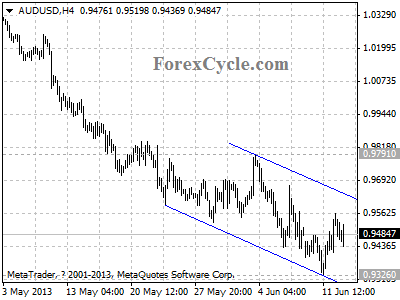
AUDUSD remains in downtrend from 1.0582

AUDUSD remains in downtrend from 1.0582 (Apr 11 high), the bounce from 0.9326 is likely consolidation of the downtrend. Key resistance is located at the upper line of the price channel on 4-hour chart, as long as the channel resistance holds, the downtrend could be expected to resume, and another fall towards 0.9000 is still possible after consolidation. On the upside, a clear break above the channel resistance will indicate that the downtrend from 1.0582 had completed at 0.9326 already, then the following upward movement could bring price back to 1.0700 zone.

audusd

Daily Forex Forecast

New Zealand holds rate, still sees same rate through 2013

By www.CentralBankNews.info     New Zealand’s central bank held its Official Cash Rate (OCR) steady at 2.5 percent, as widely expected, and repeated that it expects to keep the rate “unchanged through the end of the year.”
    The Reserve Bank of New Zealand (RBNZ) also repeated that the New Zealand dollar remains overvalued despite having fallen over the past few weeks and continues to cause headwinds for the tradeables sector, restricting export earnings and encouraging demand for imports.
    In April the RBNZ, which has held its policy rate steady since March 2011, also said it expected to keep the OCR rate steady through this year and that the currency, known as the kiwi, was overvalued.
    The kiwi bottomed out in March 2009 against the U.S. dollar at $0.49 and has been rising steadily since then, hitting $0.83 at the beginning of this year. But since early May the kiwi has been falling from $0.85 to below $0.80 today. The RBNZ has confirmed it has intervened in markets.
    The RBNZ said economic growth was picking up but remained uneven with consumption rising and reconstruction in Canterbury gathering pace and this will be reinforced by a broader recovery in construction, helping support overall activity and eventually easing the housing shortage. Fiscal consolidation, however, will also constrain demand.
    “As previously noted, the Reserve Bank does not want to see financial or price stability comprimised by housing demand getting too far ahead of the supply response,” the bank said, quoting its governor, Graeme Wheeler.

    The RBNZ said its expects annual Gross Domestic Product growth to accelerate to about 3.5 percent by the second half of 2014 and inflation to rise toward the midpoint of the bank’s 1-3 percent target.
    New Zealand’s inflation rate was stable at 0.9 percent in the first quarter, the same as in the fourth quarter and only marginally higher than 0.8 percent in the third quarter.
    New Zealand’s Gross Domestic Product rose by 1.5 percent in the fourth quarter from the third quarter for annual growth of 2.5 percent, up from 2.0 percent in the third quarter.

    www.CentralBankNews.info

The Nicaragua Canal: China’s Secret Motive

By The Sizemore Letter

I first saw the Panama Canal in action in 2002.  Though nearly 90 years old at time (and soon to be 100 years old at time writing), it was an impressive piece of engineering to behold even by modern standards.  A series of locks lifts ships 85 feet above sea level and then lowers them again on the other side.  And it does it through some of the least hospitable terrain on the planet.

You absolutely cannot underestimate the importance of the Panama Canal to the modern global economy.  The existence of the Canal has done more to promote free trade and globalization than all of the international summits in history.  It has massively reduced costs and transit times and allowed for much tighter economic integration between the countries of the Americas and between the Americas and the Old World.

The Canal currently handles about 5% of all worldwide shipping traffic—and it would be substantially higher were it not for the fact that the Canal is currently running at maximum capacity, pending the opening of a new, wider lane set to open in 2014.  The new lane will accommodate significantly larger ships and is expected to double the Canal’s current capacity.

Note: The Canal is something that would make any red-blooded American proud.  It was started by the French—who ended up giving up on it due to engineering difficulties and a high mortality rate for their workers.  It took American innovation and engineering prowess to get the job done.

Proposed Nicaragua Canal Route

Proposed Nicaragua Canal Route

Yet recent moves by China add a new wrinkle to this story.  Even while the capacity of the Panama Canal is being doubled, a Chinese company is in serious discussions with the Nicaraguan government to build a rival canal.

The cost?  $40 billion and 11 years of construction.

Based on economics alone, it’s hard to understand the Chinese motivation.  Panama nets about $1 billion per year in tolls on its Canal and has the ability to undercut any potential rival on price.  The Canal expansion—which, again, doubles capacity—cost just $5.2 billion.

China may be betting that world trade will be high enough to justify two Central American canals by the year 2025, but I believe their motivation is less economic and more geopolitical.

The Panama Canal has been under the control of the Republic of Panama since 1999.  But under the original treaties, negotiated by the Carter Administration, that ceded control to Panama, the United States retained a permanent right to defend the Canal if its openness and neutrality were ever at risk.  The Canal may belong to Panama, but the United States still considers it a vital asset necessary for national defense.

Could China have similar motives in Nicaragua?  It would appear so to me.

In Nicaragua, China has the potential to essentially bribe one of the poorest countries in the Western hemisphere into being a loyal ally.  By some estimates, a new canal could double the country’s GDP per capita.  And Nicaragua is not a country known for being friendly to the United States.

Will the canal happen?  Maybe, maybe not.  We’ll see.  But if it does, it should benefit the world economy by increasing capacity, speeding up transit times, and, presumably, forcing Panama to lower its tariffs in order to compete.

SUBSCRIBE to Sizemore Insights via e-mail today.

Central Bank News Link List – Jun 12, 2013:ECB’s OMT conditionality could be middle ground, says German judge

By www.CentralBankNews.info

Here’s today’s Central Bank News’ link list, click through if you missed the previous link list. The list comprises news about central banks that is not covered by Central Bank News. The list is updated during the day with the latest developments so readers don’t miss any important news.

Iceland holds rate steady and maintains tightening bias

By www.CentralBankNews.info     The Central Bank of Iceland held its benchmark seven-day collateralised lending rate steady at 6.0 percent and repeated that its accommodative policy stance would have to be tightened as spare capacity in the economy disappears with the degree of normalization hinging on inflation.
    The central bank, which has maintained rates this year after raising them by 125 basis points in 2012, said the outlook for inflation had changed little since its May forecast and underlying inflation and expectations had declined but remained above the bank’s inflation target.
    Iceland’s inflation rate was unchanged at 3.3 percent in May and April, above the bank’s 2.5 percent target. In May the bank forecast that inflation would hit its target in the first half of 2014.
    Iceland’s economic growth appears to have been somewhat weaker than the bank forecast in May’s monetary bulletin, but the central bank said it was too early to “asset that the growth outlook for the whole year has deteriorated” as output figures are often revised upwards and the most recent indicators suggest that the economic recovery is developing broadly in line with forecasts.
    In May the central bank cut its 2013 growth forecast to 1.8 percent from a previous 2.1 percent due to weaker than expected investment. In 2012 the economy expanded by 1.6 percent.

    Iceland’s Gross Domestic Product was estimated to have expanded by 4.6 percent in the first quarter, up from 0.5 percent in the fourth quarter, for annual growth of 0.8 percent, down from 1.4 percent in the fourth quarter.
    In May the central bank had forecast first quarter annual growth of 1.5 percent.
    For 2014 the bank has forecast growth of 3.0 percent and for 2015 growth of 3.5 percent.
    The exchange rate of the Icelandic krona has been broadly unchanged since the last meeting by the central bank’s monetary policy committee in May and the bank said its “intervention policy formula” appears to have contributed to “greater exchange rate stability and is therefore conducive to providing a firmer anchor for inflation expectations and promoting more rapid disinflation that would occur otherwise.”
    At the May meeting the krona was quoted at 122.9 to the U.S. dollar and today it was quoted higher at 120.5, up 4 percent since the start of the year when it was trading at 128 to the dollar.
    In May the central bank said it would take a more active role in the foreign exchange market to reduce fluctuations and the current exchange rate level was sufficient to bring inflation back to target.
    Prior to the global financial crises, the krona was roughly twice a strong at around 60 to the U.S. dollar but Iceland’s three largest banks collapsed in 2008 and currency controls were imposed in November 2008 to the protect the krona after it plunged in mid-2008.
    Iceland’s new government plans to unveil by September a plan on how to ease currency and capital controls that is likely to include some restrictions to avoid that $8 billion of funds trapped in the country don’t suddenly disappear, leading to another plunge in the krona. Iceland has already asked creditors in the three banks to forgive some $3.6 billion.
    Iceland’s central bank appealed to the new government to bring its finances into balance as soon as possible so the policy mix can contribute to the country’s external balance, economic stability and help bring inflation close to target “at the lowest possible cost.”
    “It is still the case that as spare capacity disappears from the economy, it is necessary that slack in monetary policy should disappear as well,” the central bank said, repeating a phrase that is has used for many months.
    It added that the degree to which such normalisation takes place through changes in central bank rates will depend on on inflation, which in turn depends on wages and the exchange rate.

    www.CentralBankNews.info

“Tug of War” in Gold and Silver, “Blame Bernanke” for Recent Volatility in Markets

London Gold Market Report
from Ben Traynor
BullionVault
Wednesday 12 June 2013, 08:45 EDT

GOLD PRICES hovered just below $1380 an ounce Wednesday morning in London, with silver trading around $21.80, after the metals failed to break through $1380 and $22 respectively.

European stock markets ticked higher by lunchtime – with the exception of Germany’s DAX – regaining some of yesterday’s losses, which were followed by sell offs in the US and Asia.

Commodities ticked higher this morning while US Treasury bond prices fell ahead of an auction of 10-year debt later today.

“The gold price is unable to recover despite a weaker US Dollar and falling equity markets,” says this morning commodities note from Commerzbank.

“The dominant subject on the gold market continues to be the possibility of a premature withdrawal of bond purchases by the US Federal Reserve…in our view, the figures available so far do not constitute any reason to scale back QE3 in the near future.”

“There’s a tug of war between investors putting money into gold and taking it out,” adds Bernard Sin, head of currency and metal trading at Swiss refiner MKS, who also cited concerns among investors “worried about is if there’s no more quantitative easing”.

“With the Chinese out [on holiday] until Thursday,” adds a note from ANZ, “the [gold] market is lacking a key stabilizing factor.”

Since falling sharply in April, gold has swung either side of $1400 an ounce, with the gold price falling as low as $1337 and as high as $1478. Silver has also oscillated, while stock markets have retreated after hitting multi-year, or in some cases record, highs last month, with Japan’s Nikkei especially hard hit.

“We think the recent volatility can be mostly traced to [Fed] Chairman Bernanke’s rather unconvincing testimony in front of Congress a few weeks ago when he failed to clarify exactly when the Federal Reserve’s bond buying program will be pared back,” says a note from INTL FCStone metals analyst Ed Meir.

“Markets have been on edge ever since, with the global bond market in particular getting hammered.”

An auction of 10-year US Treasury bonds later today is set to see benchmark yields above the inflation rate for the first time in 18 months, the Financial Times reports.

The market yield on 10-year Treasuries has risen from 1.6% at the start of last month to nearly 2.3% yesterday. Treasury Inflation Protected Securities (Tips), the price of which is linked to inflation, have also seen yields rise sharply in recent weeks. Bond yields move inversely to bond prices, with rising yields indicating investor selling.

“We have known for some time that Tips were overvalued, and the reversal has happened very quickly,” James Evans, senior vice president at Brown Brothers Harriman, tells the FT.

“Rightly or wrongly, the bond market has pulled forward the end of QE and rate hikes coming as early as 2014. It does seem premature.”

“The bond market seems to be missing the point that the Fed’s policy of tapering [i.e. slowing the pace of QE asset purchases] depends on the tone of economic data,” adds Barclays interest rate strategist Michael Pond.

“The market has moved from pricing in less bond buying [by the Fed] to a full-on tightening cycle and we believe that is a different story than what the Fed is trying to communicate.”

“Recent weeks suggest that transparency [from the Fed] doesn’t mean clarity,” says Jim O’Neill, former chairman at Goldman Sachs Asset Management, in a column for Bloomberg View.

“The Fed can talk about ‘tapering’ QE all it likes; it can’t change the basic laws of economics and valuation. A rise in the benchmark yield to 4% would represent normality even if inflation expectations stayed well controlled.”

“While it might be easier to detail the ‘deserved’ casualties of the last month, or more, finding the undeserved casualties might not be quite so obvious,” says this morning’s note from the currencies team at Standard Bank.

“In our view these are assets where the selling has been more a function of position unwinding than any significant change in the fundamentals that underlie the market.”

India’s government does not see the need for any further measures to restrict gold imports, according to the country’s economic affairs secretary Arvind Mayaram.

India, the world’s biggest gold buying nation, raised import duties on gold to 8%last week, and has imposed restrictions on importing on consignment.

Ben Traynor

BullionVault

Gold value calculator   |   Buy gold online at live prices


Editor of Gold News, the analysis and investment research site from world-leading gold ownership service BullionVault, Ben Traynor was formerly editor of the Fleet Street Letter, the UK’s longest-running investment letter. A Cambridge economics graduate, he is a professional writer and editor with a specialist interest in monetary economics. Ben can be found on Google+


(c) BullionVault 2013

Please Note: This article is to inform your thinking, not lead it. Only you can decide the best place for your money, and any decision you make will put your money at risk. Information or data included here may have already been overtaken by events – and must be verified elsewhere – should you choose to act on it.