Chinese Credit Reaches 200% of GDP; Why American Investors Should Care

By Profit Confidential

In just a few years following the Lehman crisis, credit in the Chinese economy has gone from $9.0 trillion to $23.0 trillion. Comparing it to the gross domestic product (GDP) of the country, credit has ballooned to 200% of GDP—it was only 40% before the U.S. subprime bubble burst.

Fitch Ratings’ senior director in Beijing, Charlene Sue, said this week, “…this is beyond anything we have ever seen before in a large economy. We don’t know how this will play out. The next six months will be crucial.” (Source: Evans-Pritchard, A., “Fitch says China credit bubble unprecedented in modern world history,” The Telegraph, June 16, 2013.)

Adding to the credit worries in China, just like the U.S. economy, consumers in the Chinese economy are shying away from spending. According to the China Association of Automobile Manufacturers, car sales in the Chinese economy in May grew at a slower pace than the previous month’s. The car sales growth rate registered at nine percent in May, compared to 13% in April. (Source: Financial Times, June 9, 2013.)

Furthermore, manufacturing in the Chinese economy has been witnessing a slowdown. Exports from the country have fallen victim to anemic demand in the global economy. Sadly, this year, as per government estimates, the Chinese economy is expected to grow at the pace of only 7.75%—much slower than China’s past double-digit growth rates.

The troubles in the Chinese economy continue to mount, but with the optimism seen in the key stock indices, investors are ignoring their implications. I can’t stress this enough: growing problems in the Chinese economy will not only hurt the global economy, but the U.S. economy and the rising key stock indices as well.

And I believe the estimates of China’s growth this year may be overly optimistic. The underlying issues in the Chinese economy can take the country down very fast. Think of it this way: the credit in the country has ballooned to a very dangerous level. If only five percent of the loans issued default, there will be significant repercussions.

At the end of the day, the slowing Chinese economy means trouble for the U.S. economy. What many may not realize is that some of the biggest companies based here in the U.S. economy do business in China—companies like Wal-Mart Stores, Inc. (NYSE/WMT), Caterpillar Inc (NYSE/CAT), and the biggest car makers in the U.S. economy, like General Motors Company (NYSE/GM) and Ford Motor Company (NYSE/F), all do a significant amount of business there.

The combination of China’s credit reaching 200% of GDP, manufacturing slowing, consumers reducing spending, and GDP growth declining rapidly could be a huge risk for American multinational companies and our stock market.

Where the Market Stands; Where It’s Headed:

It’s become a joke.

The stock market no longer trades on the fundamentals of an improving economy or rising corporate profits. We have a stock market obsessed with the actions of the Federal Reserve—will it continue to print money or will it pull back on quantitative easing?

When you have a stock market so focused on artificial factors, such as money printing, as opposed to fundamentals, like economic growth and corporate profits, the end for the market cannot be far off.

What He Said:

“Investors have been put into an unfair corner. Those who invested in stocks because they got caught in the tech boom (1999) have seen their investments gone. Now, those who have leveraged heavily to play the real estate game, because it is the place to be (2005), could see the same fate as the stock market investors. Thanks again, Mr. Greenspan.” Michael Lombardi in Profit Confidential, May 27, 2005. Michael started warning about the coming crisis in the U.S. real estate market right at the peak of the boom, now widely believed to be 2005.

Article by profitconfidential.com

Why Investors Should Be Worried About the Sharp Rise in Bond Yields

By Profit Confidential

U.S. Bond Market CollapsingWhile government data continue to show a lack of inflation in the U.S. economy, the bond market screams the opposite.

The Consumer Price Index (CPI), the most commonly quoted measure of inflation, increased only 0.1% in May after declining 0.4% in April. Since the beginning of the year, from January to May, inflation in the U.S. has edged higher by only 0.2%. (Source: Bureau of Labor Statistics, June 18, 2013.)

But the bond market says this isn’t true.

Since May, we have seen yields on U.S. bonds skyrocket. Take a look at the chart below; it shows the change in yields on 30-year U.S. bonds (indicated by the red line) and 10-year U.S. notes (marked by the blue line). Note the circled area.

US bonds skyrocket chart

Chart courtesy of www.StockCharts.com

In a matter of a few weeks, yields on 30-year U.S. bonds have jumped about 19% and 10-year note yields have skyrocketed almost 35%.

This is dangerous for bond investors. As the yields on bonds climb higher, their prices slide lower, bond investors face losses…and they’re fleeing the bond market.

For the week ended June 5, long-term bond mutual funds witnessed an outflow of $10.9 billion. Looking at it on a monthly basis, the long-term bond mutual funds haven’t seen an outflow since December of 2008. This month may just be the first since then. (Source: Investment Company Institute, June 12, 2013.)

Even the foreigners, who have been providing credit to the U.S. economy, seem to be running toward the exit. According to Treasury International Capital Data, in April, foreign residents were net sellers of long-term U.S. bonds. Private foreign investors accounted for net sales of $17.8 billion in U.S. bonds, and foreign official institutions’ net sales of U.S. bonds were $6.9 billion. (Source: U.S. Department of the Treasury, June 14, 2013.)

Dear reader, inflation is the biggest enemy of the bond market. When inflation increases, bond prices decline and yields soar.

Over the past four years, the yields on U.S. bonds have declined and bond prices have risen due to the Fed’s rigorous easy monetary policy. With massive amounts of money printing and interest rates being kept artificially low, inflationary pressures are now building up. Food and energy prices, which the government inflation figures ignore, are increasing. The rise in bond yields and the collapsing bond market mean inflation lies ahead.

Michael’s Personal Notes:

In just a few years following the Lehman crisis, credit in the Chinese economy has gone from $9.0 trillion to $23.0 trillion. Comparing it to the gross domestic product (GDP) of the country, credit has ballooned to 200% of GDP—it was only 40% before the U.S. subprime bubble burst.

Fitch Ratings’ senior director in Beijing, Charlene Sue, said this week, “…this is beyond anything we have ever seen before in a large economy. We don’t know how this will play out. The next six months will be crucial.” (Source: Evans-Pritchard, A., “Fitch says China credit bubble unprecedented in modern world history,” The Telegraph, June 16, 2013.)

Adding to the credit worries in China, just like the U.S. economy, consumers in the Chinese economy are shying away from spending. According to the China Association of Automobile Manufacturers, car sales in the Chinese economy in May grew at a slower pace than the previous month’s. The car sales growth rate registered at nine percent in May, compared to 13% in April. (Source: Financial Times, June 9, 2013.)

Furthermore, manufacturing in the Chinese economy has been witnessing a slowdown. Exports from the country have fallen victim to anemic demand in the global economy. Sadly, this year, as per government estimates, the Chinese economy is expected to grow at the pace of only 7.75%—much slower than China’s past double-digit growth rates.

The troubles in the Chinese economy continue to mount, but with the optimism seen in the key stock indices, investors are ignoring their implications. I can’t stress this enough: growing problems in the Chinese economy will not only hurt the global economy, but the U.S. economy and the rising key stock indices as well.

And I believe the estimates of China’s growth this year may be overly optimistic. The underlying issues in the Chinese economy can take the country down very fast. Think of it this way: the credit in the country has ballooned to a very dangerous level. If only five percent of the loans issued default, there will be significant repercussions.

At the end of the day, the slowing Chinese economy means trouble for the U.S. economy. What many may not realize is that some of the biggest companies based here in the U.S. economy do business in China—companies like Wal-Mart Stores, Inc. (NYSE/WMT), Caterpillar Inc (NYSE/CAT), and the biggest car makers in the U.S. economy, like General Motors Company (NYSE/GM) and Ford Motor Company (NYSE/F), all do a significant amount of business there.

The combination of China’s credit reaching 200% of GDP, manufacturing slowing, consumers reducing spending, and GDP growth declining rapidly could be a huge risk for American multinational companies and our stock market.

Where the Market Stands; Where It’s Headed:

It’s become a joke.

The stock market no longer trades on the fundamentals of an improving economy or rising corporate profits. We have a stock market obsessed with the actions of the Federal Reserve—will it continue to print money or will it pull back on quantitative easing?

When you have a stock market so focused on artificial factors, such as money printing, as opposed to fundamentals, like economic growth and corporate profits, the end for the market cannot be far off.

What He Said:

“Investors have been put into an unfair corner. Those who invested in stocks because they got caught in the tech boom (1999) have seen their investments gone. Now, those who have leveraged heavily to play the real estate game, because it is the place to be (2005), could see the same fate as the stock market investors. Thanks again, Mr. Greenspan.” Michael Lombardi in Profit Confidential, May 27, 2005. Michael started warning about the coming crisis in the U.S. real estate market right at the peak of the boom, now widely believed to be 2005.

Article by profitconfidential.com

Timing Is Everything for This Hot IPO

By Profit Confidential

Timing Is Everything for This Hot IPOWhen the stock market is going up, there are always initial public offerings (IPOs). Timing, as they say, is everything.

But with a meaningful trend (like the stock market breakout experienced this year), you can make good money speculating in IPOs, even if you can’t get an allocation on the hottest deals.

One small, but fast-growing company that’s been a hot performer is SolarCity Corporation (SCTY) out of San Mateo, California. It’s been one of the best-performing IPOs since listing. The company’s timing could not have been more perfect.

This business is more than just a solar panel company. It is a full service installer and repair service company that guarantees electricity production to customers.

With net proceeds of approximately $95.0 million from the sale of approximately 13.2 million shares at $8.00 per share, this growing company is in full expansion mode.

It has also had fantastic stock market success so far, and it’s worth keeping an eye on (especially since Elon Musk from Tesla Motors, Inc. [TSLA] is the company’s chairman).

Before listing, the company raised over $100 million in private equity to fund its growth. The company has a burgeoning customer base among large corporations and the U.S. Armed Forces.

By May, $8.00 a share quickly became $50.00 a share, which isn’t bad for six months’ work. Extreme overvaluation is part of the game with IPOs, especially the ones that become immediately successful right after listing. (See “How Peter Lynch Got It Right 20 Years Ago.”)

Extreme price momentum with IPOs is very much a stock market reality when the key stock indices are ticking higher. The market bids the shares to astronomical levels in anticipation of the company delivering on growth. In a rising market, it definitely pays to research new IPOs.

SolarCity’s stock chart is featured below:

SolarCity Corporation Chart

Chart courtesy of www.StockCharts.com

In terms of its business model, SolarCity generates a considerable portion of its revenues through the leasing of its solar energy systems with power purchase agreements. What’s great about leasing is that it requires long-term contracts (typically 20 years according to the company’s form 10-Q) and provides a recurring revenue stream.

Before listing on the stock market, the company used to just sell its solar energy systems on an outright purchase basis. The company began offering leasing and power purchase agreements in mid-2008; this boosted the company’s business considerably.

The majority of residential energy customers enter into leasing arrangements, while commercial and government customers enter into power purchase agreements. The company’s total customer base grew 14% to 57,416 as of March 31, 2013, up from 50,532 on December 31, 2012.

In the three months ended March 31, 2013, SolarCity’s total revenues were about $30.0 million, of which $15.1 million was due to operating leases. This compares to total revenues of $24.8 million, of which $8.14 million was operating leases, on December 31, 2012.

Without question, SolarCity’s stock market valuation is off the charts and the company isn’t even profitable. IPOs like this are as much about the concept as they are the business.

SolarCity is just the kind of company that can help revitalize the U.S. economy. The company is hiring, it’s expanding across the U.S. market, and Wall Street loves the idea of it.

Stock market IPOs are typically overpriced, but that doesn’t mean they can’t make money. And SolarCity just might be the perfect example of this.

Article by profitconfidential.com

Why the Best Companies Expand Internationally

By Profit Confidential

Best Companies Expand InternationallyThere are only two methods to drive revenues: a company can increase its price to the consumer (but this doesn’t always come across as being prudent, especially given the current low interest rate and inflation period), and then there’s the more viable way, which is to expand into foreign markets.

Companies can expand nationwide or internationally like many of the world’s multinational companies. Just take a look around and see how many American companies are found outside of our borders and spread across Europe, Asia, and Latin America.

Whole Foods Market, Inc. (NASDAQ/WFM) has the majority of its stores in the United States, but also has a small presence in Canada and the United Kingdom. The company just made its first foray into Detroit, Michigan. Now at first glance it doesn’t seem odd but, as my stock analysis suggests, given that the “Motor City” has a massive unemployment rate of 17.5% (source: U.S. Bureau of Labor Statistics, last accessed June 18, 2013) and Michigan has more people looking for work than the national average, you have to wonder why the company has decided to expand there. While there may be more economically viable places for expansion, the reality is that the company is searching far and wide for places to expand, as it doesn’t want to face growth issues down the road, as my stock analysis indicates.

The need to expand internationally has made many American companies into global brands and has rewarded shareholders along the way, as my stock analysis suggests.

Expansion is what companies need to do in order to grow and become much bigger companies. Maintaining a market within America’s borders alone means limiting your market to 300 million people and ignoring the other 500 million people in the eurozone and 2.4 billion people spread across China and India, based on my stock analysis.

My stock analysis indicates that U.S. companies tend to expand internationally into our neighbor to the north, Canada, as a first move.

McDonalds Corporation (NYSE/MCD) is now a global powerhouse and one of the most recognizable brands in the world, according to my stock analysis. The company first moved into Canada in 1967. (Read “The Secret to Success in the Fast Food Sector.”)

In the home supplies sector, The Home Depot, Inc. (NYSE/HD) expanded into Canada in 1994, which was followed by Lowes Companies, Inc. (NYSE/LOW) in 2007.

Retail giant Wal-Mart Stores, Inc. (NYSE/WMT) expanded into Canada in 1994 via its acquisition of Woolco Canada. The company has become a retail icon in Canada and is expanding aggressively into China and Brazil to drive revenues, based on my stock analysis. And it’s odd that it took nearly two decades before Wal-Mart’s rival Target Corporation (NYSE/TGT) launched its first stores in Canada this past April. Target still doesn’t have any exposure outside of North America, which makes the company an inferior stock to Wal-Mart and its aggressive foreign exposure, based on my stock analysis.

I favor companies that look outside of their base country’s borders for growth. As my stock analysis suggests, other stocks that fit this profile include The Gap, Inc. (NYSE/GPS), Starbucks Corporation (NASDAQ/SBUX), Chipotle Mexican Grill, Inc. (YSE/CMG), and YUM! Brands, Inc. (NYSE/YUM).

Article by profitconfidential.com

Gone Are the Days When Municipal Bonds Were Safe

By Profit Confidential

National Debt for the U.SMunicipal bond investors beware!

On June 14, it was announced that Detroit will not make a $39.7-million payment on unsecured municipal bonds worth $2.0 billion. This makes Detroit the most populated city to default on its debt, after Cleveland, since 1978.

The Emergency Manager, Kevyn Orr, who was sent by Michigan state to look over Detroit’s budget deficit told reporters in a news conference on June 14, “We have to strike a balance between the legacy obligation to our creditors, our employees and our retirees, and the duty we have as a city to 700,000 residents to give them lights, police, fire, emergency management, clean streets.” (Source: “‘We’re Tapped Out’: Detroit Emergency Manager Proposes Plan to Creditors,” CBS Detroit web site, June 14, 2013.)

As horrific as this news may be to the mainstream media and the politicians who say the U.S. economy is getting better, it shouldn’t be a surprise to Profit Confidential readers in any way. I have been harping on about the growing problem of cities and municipalities in financial trouble in the U.S. economy, and their effects on the municipal bond market, for some time now.

The “Motor City” defaulting on its debt obligation is certainly a big issue, but it isn’t the only place where municipal bond holders are facing losses. Cities like Stockton, California have already filed for bankruptcy due to their inability to control their budget deficits.

Jefferson County, Alabama, which previously filed for bankruptcy, recently came to a decision with its municipal bond holders. It has decided that the largest creditors will only receive 60% of what the city owed.

Gone are the days when municipal bonds were considered a great investment with significant tax advantages. The $3.7-trillion U.S. municipal bond market is facing threats. Detroit defaulting on its debt obligations is just adding fuel to the fire.

Dear reader, as it stands, cities across the U.S. economy are posting higher budget deficits. Remember: the main source of a city’s income is usually property taxes. With the housing market still depressed, I doubt many troubled cities will be able to get out of their rut anytime soon. The impacts of this on municipal bonds will be harsh.

I am looking at this situation from a different level.

Moody’s Investors Services has downgraded the general obligation debt issued by Illinois to A3 from A2—a lower investment grade—and maintained a negative outlook. (Source: Moody’s Investors Services, June 6, 2013.) The reason for the downgrade: staggering pension liabilities.

Now, consider what happens if some major city in Illinois runs into troubles. Will the already struggling state come to help? My take is that as more and more cities run deeper budget deficits and states continue their struggle, the federal government will eventually be asked to step in to save them. If the federal government helps them, the budget deficit of the U.S. government will obviously increase and any hopes of getting its annual deficit under a trillion dollars will be crushed.

An official national debt in excess of $20.0 trillion could happen a lot sooner than the end of this decade, as was originally forecast.

Article by profitconfidential.com

WTI drops second day by Fed’s QE-cut hint

By HY Markets Forex Blog

West Texas Intermediate crude futures fell after the Fed chairman hinted the central bank could cut back its bond purchases later this year and end by 2014 depending on the economy growth.

The West Texas Intermediate crude slid as much as 1.74%, standing at $96.78 per barrel as of 6:10am GMT, at the same time, the Brent crude oil fell dropped 1.54%, trading at $104.50 per barrel.

“We’re still some distance from that happening. Scale-backs in the asset purchasing program will only happen if the economic data gets better, while interest rate hikes are still far in the future,” Bernanke said at the press conference , after the two-day policy meeting .

The employment rate is predicted to rise between 7.2% and 7.3% by the end of the year, according to the latest forecast.

The U.S economy is expected to grow between 2.3% and 2.6% as well as next year’s GDP is expected to enlarge from 3% to 3.5%, according to statements released from the central bank.

Crude inventories data received by the API lost by 669,000 barrels to 48.6 million during the week ended June 14, the lowest since December.

Gasoline inventories rose by 183,000 barrels during the week ended June 14, according to the EIA.  Reports from the Energy Information Administration (EIA), stockpiles climbed by 0.313 million barrels in the previous week.

China the second-largest oil consumers, are accounting for 11% of the global demand, while the U.S is the biggest user with 21 %, according to data released from the BP Plc.

The post WTI drops second day by Fed’s QE-cut hint appeared first on | HY Markets Official blog.

Article provided by HY Markets Forex Blog

Bernanke hints possible cut in bond-buying program this year

By HY Markets Forex Blog

According to reports from the Fed two-day policy meeting, the US Federal Reserve are still going to maintain the rate of its bond-buying program at $85 billion a month, however with the positive outlook from the US economy and the employment rate, the Fed hints possible cut down by the end of the year and stop the monthly bond purchases by 2014.

The Federal Reserve kept its interest rate between zero and 0.25%.

The Fed predicts the economy growth the rise as well as the employment rate. Policymakers are expecting inflation to increase to its longer term target of 2%.

The US market declined in the afternoon trading. Dow Jones fell 206 points to close at 15,112, shortly after the statement from the Fed Chairman was released.

The central bank has managed to increase its balance record to approximately $3.3 trillion to bring the borrowing costs down and increase hiring.

“Inflation that is too low is a problem.  We expect inflation to come back up. That’s our forecast. But we are concerned about it. We would like to get inflation up to our target. And that will be a factor in our thinking about the thresholds. It will be a factor in our thinking about asset purchases.” Fed Chairman Mr Bernanke told the press conference after the Fed’s two-day meeting.

Federal Reserve board members, financial and bank chairmen present at the meeting did not agree with the suggestion of increasing the interest rates until 2015.


The post Bernanke hints possible cut in bond-buying program this year appeared first on | HY Markets Official blog.

Article provided by HY Markets Forex Blog

The US Economy Butterfly Effect

By MoneyMorning.com.au

The Bernank has spoken. All hail the Bernank. 

According to Ben Bernanke, Chairman of the US Federal Reserve, the US is doing swimmingly and he will be able to start lowering Quantitative Easing (QE) towards the end of the year. 

The key news points that came out of the press conference, as reported on ZeroHedge, were:

‘BERNANKE SAYS JOB GAINS, HOUSING INCREASED CONSUMER CONFIDENCE’

‘BERNANKE SAYS MONETARY POLICY WILL CONTINUE TO SUPPORT RECOVERY’

‘BERNANKE SAYS FOMC `MAY VARY’ PURCHASE PACE ON ECONOMIC DATA’

‘BERNANKE: FOMC MAY `MODERATE’ PACE OF PURCHASES LATER IN 2013′

‘BERNANKE SAYS FED MAY END PURCHASES AROUND MID-YEAR 2014′

‘BERNANKE SAYS FED WILL EASE QE PACE IF ECONOMY IMPROVES’

‘BERNANKE SAYS PURCHASE REDUCTION REPRESENTS FOMC CONSENSUS’

Credit markets reacted swiftly to the news and sold off aggressively. US 10 year Treasury rates increased by 16 or so basis points to a yield of 2.36%. That’s the highest level in over a year. Stocks plummeted, with the S+P 500 falling by 22 points or 1.4% to 1629.

How markets react over the next few days will be very interesting to watch. If the initial knee jerk reaction to sell gathers steam and the S+P 500 falls below the last couple of weeks’ low of 1598 my conviction levels will increase dramatically that further large falls are in the offing…

I have to say I’m surprised by Bernanke’s comments that the US economy is healing and will be strong enough within the next few months to withstand a tapering of QE. It doesn’t really stack up against the flow of soggy data we’ve seen in recent weeks.

As you can see in the chart below the current flow of macro data is far from rosy:

US Macro Data Still Weak


Source: ZeroHedge.com

I can’t see how Bernanke could justify tapering based on a strengthening in the US economy. My view is that the Fed is scared stiff it has created a monster by blowing so many bubbles all over the world. So they have decided that the sooner they take some steam out of the markets the better.

I’m sure their main aim is to ensure they don’t create a crash, but instead engineer a slow deflation from lofty levels.
The first act in this saga involved hinting loud and clear to the market that tapering was on the table as an option.

The hugely volatile swings we saw across all markets as a result, with carry trade unwinds leading to a large rise in rates and massive currency swings, are sure to have frightened the hell out of them.

Watch These Two Countries

The carry trade has become an incredibly crowded trade. It has been the catalyst for the big rallies we’ve seen over the past year. The mere hint that this game was going to become riskier saw punters heading for the door. And we know what happens when everyone wants out at the same time.

The interesting things to watch from here are the reactions in Japan and China. Japan’s bond markets have been under increasing pressure due to the crazy money printing policies of the Bank of Japan.

They have somehow managed to keep rates below the 1% threshold after intervening in the markets the last time that level was tested a few weeks ago.

But a large rise in US rates will necessarily place upward pressure on Japanese rates as investors switch out of JGB’s and into US bonds.

You also need to watch China closely from here due to the large cracks appearing in their shadow banking system.

We’re starting to see the initial signs of stress in the Shibor (Shanghai Interbank offer rate) with the rate spiking towards 10% recently.

Shibor Rate Spikes


Source: Shibor.org

The Shibor is the Chinese equivalent of the Libor (London interbank offered rate) which is the rate banks charge each other for overnight loans. It’s an important rate which shows signs of stress within the banking system when it shoots higher.

An article in the Age on Tuesday by Ambrose Evans-Pritchard has caused quite a stir. It arrived in my inbox from multiple sources.

The opening line says, ‘China’s shadow banking system is out of control and under mounting stress as borrowers struggle to roll over short-term debts, Fitch Ratings has warned.

Apparently Bank Everbright (unfortunate name really…) defaulted on an interbank loan a couple of weeks ago amid the big spikes in the Shibor that you can see in the chart above. I’m sure they’re not feeling so bright after all. According to the article:

Fitch warned that wealth products worth $US2 trillion of lending are in reality a "hidden second balance sheet" for banks, allowing them to circumvent loan curbs and dodge efforts by regulators to halt the excesses.

This niche is the epicentre of risk. Half the loans must be rolled over every three months, and another 25 per cent in less than six months. This has echoes of Northern Rock, Lehman Brothers and others that came to grief in the West on short-term liabilities when the wholesale capital markets froze.

The other very interesting point made in the article was the potential for an exodus of hot money out of China once the US Fed starts tightening monetary conditions.

In the article it states that China’s security journal said ‘foreign withdrawals from Chinese equity funds were the highest since early 2008 in the week up to June 5, and withdrawals from Hong Kong funds were the most in a decade.

So with US rates spiking higher on the fear of a withdrawal of monetary morphine by the US Federal Reserve, we may see the unintended consequences of their actions unravelling fragile markets all over the globe.

Murray Dawes
Editor, Slipstream Trader

Join me on Google Plus

From the Port Phillip Publishing Library

Special Report: The Sixth Revolution Has Just Begun

Daily Reckoning: The Holden Moment

Money Morning: Beware The Federal Reserve’s Deadly Game of Poker

Pursuit of Happiness: Calming a Property Market Storm

How Rising Oil Prices Could Derail the Global Economy

By MoneyMorning.com.au

The price of oil is, perhaps, the single most important price in the world. The cost of almost everything we do at home, at work and at play is affected by it.

Cheap oil made much of the economic growth and progress of the 20th century possible.

If the cost of oil is high, the cost of food goes up, the cost of manufacturing goes up, and the cost of transportation goes up. That leaves us with less to spend on everything else – whether it’s food, accommodation, goods and services, or investment.

A rising oil price also tends to mean rising inflation, which puts pressure on interest rates to rise as well. So the last thing policy-makers need right now is a high oil price.

But they’d better brace themselves. That could be just what’s coming.

The Oil Price is Warming Up for a Major Move

Oil appears to have dropped off the radar somewhat over the last couple of years.

In the volatility of 2007-08, the words ‘Peak Oil’ were on everybody’s lips and the price of light crude (the West Texas Intermediate – WTI – benchmark) went all the way from $50 up to $147 then back down to $35 a barrel.

There was then a two-year bull market, which began in the spring of 2009 at $33 and ended in the spring of 2011 at $115.

Since then light crude oil has been fairly settled. Over the last two years, it has been making a series of higher lows: $75, then $77, then $84, then $85 last month.

But at the same time the highs have been getting lower: $115, then $110, then $100, then $97. In other words, its trading range has been getting narrower and narrower. And it’s discreetly crept off the headlines.

A long period of consolidation – such as this – can portend a sustained move. As the saying goes, ‘The bigger the base, the higher in space’.

Here’s a chart showing oil over the last seven years. The narrowing trading range that I am speaking about is quite clear.

And as you can see, the price has just moved above the red falling trend line, so there is a hint that it is ‘breaking out’. For now, I don’t think this is too significant. It’s largely a function of the US dollar weakness we have seen over the last month.

And I wouldn’t be at all surprised to see oil fall back to $95 or so within the next few days – back within those two red lines. But I do see this long-term base we are building as very significant.

The Best Ways to Bet on the Oil Price

Let’s zoom in now and look at a shorter-term chart, taken over the past year. As well as the price of WTI (in black), I have drawn three moving averages. The way these averages are aligned has got me excited.

The red line shows the 252-day moving average (252 dma – the average price of the last 252 days). I use this because there are around 252 trading days in a year. The amber line shows the 55 dma. And the green line shows the 21 dma.

When a sustained uptrend is in place, you would expect to see the price above all three dma lines, and with all of the lines sloping upwards. As you can see from the chart, that’s how oil is aligned now.

The committed chart-reader might even be able to detect an inverted head-and-shoulders pattern, which would be another sign that a low is in place.

You can see oil is just trying to break above that line of resistance at $97, where I have drawn the dotted blue line. It might not get through on this occasion, but a pullback to around $95 would mean a further bunching of those moving averages, which, from a technical point of view, looks even better.

If I’m right and we are getting set for a move, the base it is coming of is high. From the mid $90s a run to $105, then $110 and even $115 really isn’t such a big deal – a 10-20% move.

As I have said before, trends are very powerful things, which can continue for longer than people expect. If oil moves steadily to $110 or $115, we’ll have a nice trend in place, and that could be enough to push us over $115 after a couple of attempts. Once $115 is passed, the 2008 highs of $147 come into the frame.

Think about the implications for a second: this wouldn’t be some mad speculative run as in 2008, rather it would be a run built on a market whose foundations at higher prices are very much set. Take $75 oil, for example – we haven’t seen $75 oil since summer 2010. I’m wondering if we’ll ever see it again.

I could be completely wrong about this set-up, of course. These patterns don’t always work – I spotted a similar one in the sterling-gold chart last autumn which didn’t work out. This is why I always recommend the use of stop-losses to limit risk.

What a Surge in Oil Prices Would Mean for Your Money

If we do get a sustained rise in the oil price, it’ll be another nail in the coffin of the already-struggling bond market, because it pushes up inflation, while dragging down growth.

Everything gets more expensive for users of oil (just about everyone, directly or indirectly) and because more money is spent on energy costs, there’s less available for anything else, which hits growth.

When costs rise but wages do not, you often get political unrest. Policy-makers then have a choice to make between tolerating inflation – which makes them unpopular – and higher interest rates, which also make them unpopular. It’s a vicious cycle.

In his book The Big Flatline: Oil and the No-Growth Economy, economist Jeff Rubin notes that:

From 2004 to 2006, US energy inflation ran at 35%…In turn, overall inflation… accelerated from 1% to almost 6% [as measured by the consumer prices index]. What happened next was a fivefold bump in interest rates that devastated the massively leveraged US housing market. Higher rates popped the speculative housing bubble, which brought down the global economy.

In other words, the high oil price led to rising rates, which exposed, as Warren Buffet might put it, who was swimming naked. Could it happen again? We may soon find out. I’m predicting $115 oil before year-end. And if we get to that, 2014 could be another year of $147 light crude.

Dominic Frisby
Contributing Writer, Money Morning

Join Money Morning on Google+

Publisher’s Note: This article originally appeared in here.

From the Archives…

Don’t Make Investing a Chore… Invest in an Innovative Business
14-06-2013 – Kris Sayce

The Technology Revolution Begins in Four Days…
13-06-2013 – Kris Sayce

Zero G for the Australian Dollar is a Shot in the Arm for Miners
12-06-2013 – Dr Alex Cowie

There’s More to Technology Than Facebook and Spying
11-06-2013 – Sam Volkering

Four Great Australian Technological Achievements
10-06-2013 – Sam Volkering

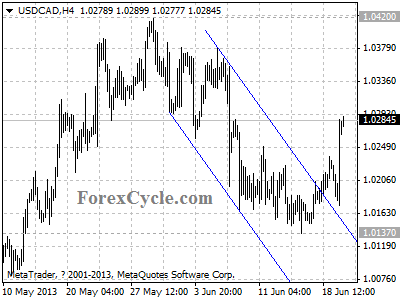
USDCAD broke above channel resistance

USDCAD broke above the resistance of the upper line of the price channel on 4-hour chart, and is now in uptrend from 1.0137, and the rise extends to as high as 1.0290. Further rise could be expected, and next target would be at 1.0350 area. Support is at 1.0200, only break below this level could trigger another fall towards 1.0000.

usdcad

Provided by ForexCycle.com