Australian Dollar on the defensive vs US Dollar, Euro, Japanese Yen prior to RBA decision

By CountingPips.com

The Australian dollar has been on the decline today in Forex trading action ahead of Tuesday’s Reserve Bank of Australia (RBA) policy meeting and interest rate decision. The Aussie has fallen against the US dollar, Japanese yen and the European common currency in foreign exchange trading as data published today showed that Australian retail sales unexpectedly contracted in March by 0.4 percent.

Bloomberg data, based on overnight-index swap rates, shows a 53% chance of an interest rate reduction on Tuesday while large money traders, including possibly George Soros, are rumored to be betting on a rate cut.

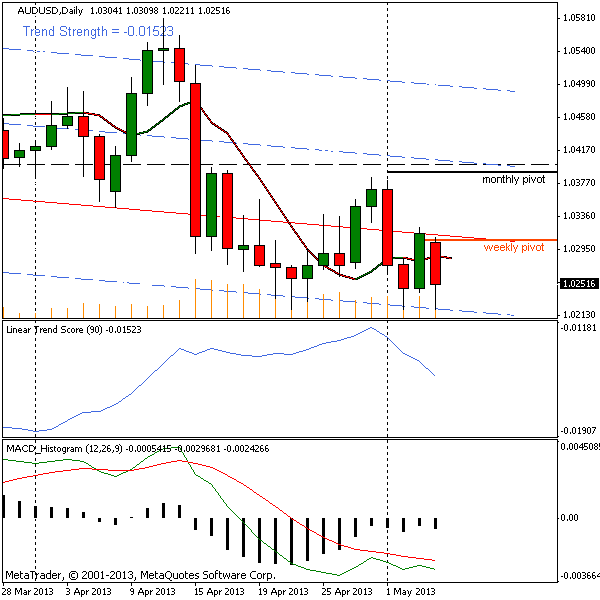
The AUD/USD in trading today declined and ended the day near the 1.0251 exchange rate level at the New York close of business. This was a decline of approximately 50 pips on the day. The Australian dollar, meanwhile, showed more modest declines against the Japanese yen and the euro today of approximately 25 pips and 30 pips, respectively.


AUDUSD forex chart
AUDUSD


AUD/USD Support & Resistance Levels:

The AUD/USD currency pair trades right near the 1.0250 exchange level at the current time with a downside support level coming into play at 1.0220. This level has provided support numerous times since February while a close below this level would be the lowest close since the beginning of March. Lower downside targets would bring 1.0200 and then 1.0165 to 1.0150 which would be bringing the pair to the lowest levels of 2013.

Upside targets may be capped at the 1.0300 major resistance level that has been an obstacle in the past and features the weekly pivot point very close by. If the pair can get by that obstacle the 1.0325 to 1.0350 resistance will likely come into play.


AUD/USD Changes & Ranges: Past 6 Weeks

DatePct ChangeTrue Range
2013.03.31-0.3510.0142
2013.04.071.3060.0234
2013.04.14-2.1440.0255
2013.04.21-0.0240.0118
2013.04.280.3540.0163
*2013.05.05-0.5640.0089

* current week so far


Pivots and Trends Data:

Weekly Pivot Point: 1.0295
Monthly Pivot Point: 1.0390


Linear Regression Indicator Trend / Strength Data:

30-day current trend is BEARISH / Trend strength of -230.4 pips
60-day current trend is BULLISH / Trend strength of 52.9 pips
90-day current trend is BEARISH / Trend strength of -36.1 pips
180-day current trend is BEARISH / Trend strength of -49.7 pips
365-day current trend is BULLISH / Trend strength of 239.6 pips


Article by CountingPips Forex Blog, News & Analysis


New Wyoming Lithium Deposit could Meet all U.S. Demand

By OilPrice.com

The U.S. currently imports more than 80% of the lithium it uses, with the silvery metal winding up in batteries from cell phones to electric cars.

According to a United States Geological Survey publication on lithium, “The only commercially active lithium mine in the United States was a brine ope ration in Nevada. The mine’s production capacity was expanded in 2012, and a new lithium hydroxide plant opened in North Carolina. Two companies produced a large array of downstream lithium compounds in the United States from domestic or South American lithium carbonate, lithium chloride, and lithium hydroxide. A U.S. recycling company produced a small quantity of lithium carbonate from solutions recovered during the recycling of lithium ion batteries.”

The bad news?

Last year virtually all of the major brine and mineral-based lithium producers increased their prices, which in turn has spurred prospecting. In the U.S. exploration has been largely centered in Nevada, but the growing worldwide market for lithium has also spurred exploration in Argentina, Australia, Bolivia and Canada.

And now, the good news.

University of Wyoming researchers found the lithium while studying the idea of storing carbon dioxide under ground in the Rock Springs Uplift, a geologic formation in southwest Wyoming. University of Wyoming Carbon Management Institute director Ron Surdam stated that the lithium was found in underground brine. Surdam estimated the located deposit at roughly 228,000 tons in a 25-square-mile area. Extrapolating the data, Surdam said as the uplift covered roughly 2,000 square miles, there could be up to 18 million tons of lithium there, worth up to roughly $500 billion at current market prices.

As a yardstick, the lithium reserves at Silver Peak, Nevada, the largest domestic producer of lithium total 118,000 tons in a 20-square-mile area. The University of Wyoming stated that in a best-case scenario, the Rock Springs Uplift’s 18 million tons of potential lithium reserves is equivalent to roughly 720 years of current global lithium production. UW researchers suggest that the lithium mining could be part of a carbon dioxide sequestration operation, since the lithium-bearing brine must be pumped to the surface from the underground rock formation to extract the lithium, creating space to store the CO2 in its place. Surdam highlighted the economic advantages to the combined lithium-CO2 storage operation, commenting, “You get paid to put the carbon in the subsurface and that’ll pay for the wells to remove the lithium.”

Carbon Management Institute senior hydrogeologist Scott Quillinan said, “Due to their high salinity, brines from the CO2 storage reservoirs would have to be pumped to the surface and treated – often an expensive process. Recovering and marketing lithium from the brines would produce significant revenue to offset the cost of brine production, treatment and CO2 storage operations .”

Several fortunate factors converge to make the lithium- CO2 storage reservoir concept more than merely feasible. While lithium production from brines requires sodium carbonate (soda ash), transporting soda ash to lithium production facilities is often a significant expense the Rock Springs Uplift CO2 storage site is located 20-30 miles of the world’s largest industrial soda ash supplies, so costs of soda ash delivery would be minor. While magnesium must be removed from brines before they can be used for lithium recovery, the Rock Springs Uplift reservoirs contain much less magnesium than brines at existing, currently profitable lithium mining operations. While brines must be heated and pressurized before lithium can be extracted, the Rock Springs Uplift brines lie so far underground, they are already at a higher pressure and temperature than brines at existing lithium operations, allowing any potential operators largely eliminate the step, furt her lessening costs. Finally, the treated water resulting from the recovery process could benefit local communities, agriculture and industry.

It will be interesting to see if any investment entities step up to the plate on this.

Source: http://oilprice.com/Energy/Energy-General/New-Wyoming-Lithium-Deposit-could-Meet-all-U.S.-Demand.html

By. John C.K. Daly of Oilprice.com


May 2013 Covestor Model Commentary: Long Live Boring!

By The Sizemore Letter

If I could sum up the year-to-date with one line, it would be “long live boring!”

The Dividend Growth Model, which is designed to be a stable, long-term producer of income, is one of the top-performing portfolios on the Covestor platform, with year-to-date returns 23.7%, vs. 13.2% for the S&P 500 (returns through May 3, 2013).

And remarkably, those returns were generated with less volatility (beta of only 0.7% and lower maximum drawdown than the S&P 500).

I would love to say that the investing process is as simple as buying a basket of income-producing stocks and watching them run circles around the market averages.  It has been that simple in recent years, but this is a result of a handful of conditions that we can’t expect to endure forever.

To start, two major bear markets in less than a decade massively shook investor confidence in growth and has led to a very narrow focus on cash dividends.  With years’ worth of capital gains able to evaporate in a matter of days, investors have come to see the wisdom in the old Wall Street saw that a bird in hand in worth two in the bush.

Secondly, with bonds and traditional savings accounts and CDs yielding next to nothing these days, investors have flocked to dividend-paying stocks as bond substitutes.  For long-term investors, I believe this is the right thing to do.  If bought well, a portfolio of dividend-paying stocks will produce an income stream that grows faster than the rate of inflation, meaning your standard of living has the possibility of improving in retirement.  The exact opposite is true of a bond portfolio; even with the modest inflation we have today, your real bond income gets a little smaller each year.

And finally, demographics have played a role here.  The market turbulence notwithstanding, the Baby Boomers—America’s largest and wealthiest generation—are starting to retire, and their focus is on the generation of income.  And companies are responding to their tastes by upping their dividend payouts.

Sizemore Capital believes that each of these trends has further to run and that the outlook for dividend-paying securities continues to be strong.  Additionally, with its heavy allocation to midstream master limited partnerships, the Dividend Growth Portfolio is well positioned to take advantage of another major macro trend, America’s domestic energy renaissance.

Will Dividend Growth’s outperformance relative to the market continue at its blistering pace?  We have no way of knowing, of course, but frankly I hope the answer is “no.”

I consider the securities in the portfolio attractive because, as a group, they pay a strong current dividend that I expect to grow over time.  But if the prices of dividend-paying stocks rise to the point that they are no longer attractively-priced and no longer pay what I consider to be a high current stream of income, then it might be time to explore other strategy options.

We are not there yet, and I consider current market conditions to be very favorable for a dividend growth strategy.  But I encourage investors to view this strategy the way I intend it to be viewed—as a way of building long-term retirement income irrespective of the market’s direction.  This portfolio was never intended to generate market-crushing returns—though we certainly shouldn’t complain during those times when it does!

Disclaimer: All portfolio returns figures are calculated by Covestor, and Sizemore Capital Management believes them to be accurate.  Past performance is no guarantee of future results.

Charles Sizemore is the manager of the Dividend Growth portfolio and three other models on the Covestor platform.

Malaysia Election: Prime Minster Najib Razak’s Barisan Nasional Wins

By HY Markets Forex Blog

Malaysia’s Prime Minister wins election by 133 of the 222 parliament seats which is believed to have been the worst performance ever by Najib Razak while the opposition won 89 seats, up from 82, in Sunday’s election.

Million of Malaysians voted on Sunday and resulted to a record breaking 80 percent of over 10 million were registered voters.

As a result, shares in Energy Group Lynas surged 18% after the National Front coalition retained power in that country’s general election.

The Malaysian Prime Minister Najib Razak and his National Front have had a history of ruling the country since the 1950’s and with the results of this election, it doesn’t seem like they stopping anytime soon meanwhile the defeated opposition –  Anwar Ibrahim accused the ruling coalition of widespread fraud and says the authorities had distorted the results of the election .

The authorities have been accused of election fraud even before the elections took place on Sunday. The election committee tried to prevent these rumors of fraud happening by introducing the incredible ink for the first time.

“We see these irregularities have cost us many seats, particularly those with narrow margins,” he said.

As majority of the Malaysian ethic group are Chinese, the Ethnic Chinese have oppose by its pledge to tackle the end race-bend policies which will eventually favor the country as a whole in terms business , housing and education .

“We have tried our best but other factors have happened…We didn’t get much support from the Chinese for our development plans.” Najib told the reporters at the conference held after majority of the votes were announced.

Right after the election result was announced thousands of Malaysian supporters of the defeated opposition replaced their Facebook profile pictures with black boxes.

The post Malaysia Election: Prime Minster Najib Razak’s Barisan Nasional Wins appeared first on | HY Markets Official blog.

Article provided by HY Markets Forex Blog

Central Bank News Link List – May 6, 2013: With caution, Japan’s neighbors welcome ‘Abenomics’

By www.CentralBankNews.info Here’s today’s Central Bank News’ link list, click through if you missed the previous link list. The list comprises news about central banks that is not covered by Central Bank News. The list is updated during the day with the latest developments so readers don’t miss any important news.

The Key to Becoming a Successful Investor

By MoneyMorning.com.au

You may be familiar with the old saying about London buses, ‘you wait 15 minutes for one and then two come along at once.’

In a similar fashion, investors waited the better part of two years for the Dow Jones Industrial Average to go past its 2007 high. Then, before anyone could take a breath, the old level was history and the market breached the next key level of 15,000 points. Just like that.

On Friday, barely two months after taking out the old high, the Dow broke through 15,000 points to reach a high of 15,009.59. It ended the day just 6.04 points below the key level.

What should you make of it? Isn’t the world’s economy supposed to be on the verge of disaster and collapse? It appears not. Well, not for now anyway…

Central banks printing money. Record low interest rates. High unemployment. China’s slowing economic growth. Budget deficits. Government debt. Personal debt…there’s no end of negative news stories.

You don’t need to look hard to find them either.

Now, don’t get us wrong. We’re not saying you should ignore the bad news, because you shouldn’t. Just in the same way you shouldn’t ignore the warning light in your car that says you’re about to run out of fuel.

What we are saying is that you shouldn’t allow big macro-economic news stories to paralyse your investment decisions. We see it all the time. We call it ‘Paralysis by Macro’.

And to be honest, it’s not good for your wealth.

Stock Market to Rally to New Record

We went on record last year telling you it was a good time to buy stocks. Granted, we didn’t fully expect stocks to rally as quickly as they did…certainly not the dividend stocks.

But they did. Then we went further. We predicted the S&P/ASX 200 index would hit 5,002 points by the end of the year. We got that wrong. The index crashed through that level in February…10 months too soon. So that caught us off guard too.

It forced us to change our view on how the market will behave this year. Rather than the steady rise we had predicted through the year, we’re now banking on stocks providing investors with a volatile year of ups and downs.

And unlike in the past, you shouldn’t see that as a negative. Quite the opposite. Because the next part of our prediction is the best bit – we believe stocks will soon embark on a bull market rally that will take the Aussie index to 7,000 points and the Dow to 20,000 points by 2015.

It’s a big and bold prediction. And there’s no guarantee we’re right. In fact, there’s just as much chance we’re horribly wrong.

But if there’s one thing we’ve learned about investing (we’ve learned many things, but this is one of the most important) it’s that to be a successful investor you’ve got to be flexible.

You’ve got to be flexible enough to admit when something isn’t going as you expected. But even if things go right, you still need to review your position to see if anything has changed. If it has, you need to adapt too.

Memories of the Internet Bubble

And so, despite the negative macro-economic stories that are scary enough to have you hiding under the bed sheets, you’ve got to recognise that at the moment, most investors are shrugging off these problems.

On Friday the US unemployment rate dropped to 7.5%. Can you trust the number? Is the real rate closer to 15%, 20% or higher?

Right now the market doesn’t care. What it cares about is that the official number is 7.5% and this makes people believe that the US economy is improving. And if the US economy is improving that’s good news for businesses…and that’s good news for stocks.

And if things don’t improve, don’t worry, the US Federal Reserve will print more money.

This reminds us in some way of the scenario that played out during the Internet Bubble (dot com boom). The bubble finally burst in 2000. But people didn’t just start talking about the bubble after the crash. Many began warning about the bubble five or more years before that.

And they were right. The Internet Bubble was an investing mirage. The growth, revenues and profits to a large degree just didn’t exist.

But as right as the early internet sceptics were, it didn’t stop the NASDAQ Composite Index surging from 749 points at the start of 1995 to over 5,000 points at the March 2000 peak – a gain of 568%.

Odds are the folks who brag about predicting the dot com bust in 1995 didn’t make a bean from it as the NASDAQ surged nearly five-fold in five years.

Not the Time to Sell

That doesn’t mean the Australian market will gain 568% in two years. Even if we’re right, we’ve only got the index climbing about 35% in two years. And it doesn’t mean you should put all your money into stocks.

But by the same token, we believe you’re making a big mistake if you don’t have some stock market exposure. That’s why even though we believe the market will trade sideways for the rest of this year, we don’t want you to sell out of stocks at this level.

Instead, we believe you should hold at this level and use the expected dips as an opportunity to add to your portfolio.

Just remember, don’t bet your house on the stock market. But if we’re right about Australian stocks hitting a new high point within the next 20 months, this year could turn out to be a great time to buy stocks at what are still relatively cheap levels.

Cheers,
Kris

Join me on Google+

PS. If the Dow Jones Industrial Average makes it to 20,000 points by 2015 that will be 33% above today’s level. Check out the Money Morning Premium Notes in the sidebar to your right to discover one way to play the expected US stock rally. 

To find out more about Money Morning Premium, including how you can upgrade your membership now, click here.

From the Port Phillip Publishing Library

Special Report: TORRENT SIGNAL 3

Daily Reckoning: <a href="” title=”Permanent Link to Forget Investing, Let’s Spend” target=”_blank”>Forget Investing, Let’s Spend

Money Morning: <a href="” title=”Permanent Link to Money Weekend’s FutureWatch” target=”_blank”>Money Weekend’s FutureWatch

Pursuit of Happiness: <a href="” title=”What the Government’s Latest Money Grab Means for You” target=”_blank”>What the Government’s Latest Money Grab Means for You

Australian Small-Cap Investigator:
How to Make Money From Small-Cap Stocks

Cash in on the Second Great American Oil Rush: with Shale

By MoneyMorning.com.au

On 10 January 1901, the first oil ‘gusher’ erupted from a well in Beaumont, Texas. It spewed 80,000 barrels of oil in a day, at a time when 50 barrels was considered a lot.

The production of this one well was greater than the rest of the US put together. It proved beyond doubt that there were huge amounts of oil in the region.

Even though production at Beaumont quickly fell back to 10,000 barrels a day, the oil boom continued.

People flocked to Texas, attracted by the prospect of ‘striking it rich’. Towns in oil drilling areas sprung up overnight, and property values soared. Ever since then, Texas has maintained its position as America’s top oil producer.

But now Texas’ pole position is under threat.

Another great American oil rush is underway. And just like last time, there’s plenty of profit to be made for investors who know where to put their money…

Texas is in Danger of Losing its Oil Crown

Thanks to the shale gas and oil boom, Texas’ status as America’s top oil producer is under threat. In the past two years, North Dakota has moved into second place, overtaking Alaska, and the new oil rush is transforming its economy.

The boom is centred on the Bakken formation. Bakken is a rock formation covering 200,000 square miles (that’s twice the size of the UK) in North Dakota, Montana and Canada.

Oil was first discovered in the rocks in 1950. But experts thought it would cost too much to get the oil from the rock, and that only a tiny fraction would ever be recoverable in any case.

Of course, soaring oil prices helped to change the cost equation. And technological advances – in the form of hydraulic fracturing (‘fracking’) – meant more oil could be recovered.

Starting in 2007, several companies started to use fracking to extract oil cheaply. Others jumped on the bandwagon. As a result, production in North Dakota has shot up.

In January 2007, North Dakota produced a total of 3.56 million barrels of crude oil, according to the US Energy Information Authority. Six years on, this has risen more than sixfold, to 22.87 million.

Meanwhile, estimates of the oil that’s still to be had just keep rising. As late as 2008, the state of Dakota thought that no more than 2.1 billion barrels would be recoverable. That’s impressive, but not game changing. However, the latest official guess, released a few days ago, is that the figure may be more than three times higher.

This has already had a dramatic impact on North Dakota’s economy. Since 2000, nominal (ignoring inflation, in other words) state GDP has gone up by 120%. The labour market has also grown strongly, with wages rising by 80%. Currently, unemployment is only 3.3%, compared to a US-wide figure of 7.6%.

Those are impressive statistics. To get a more human impression of what it’s like on the ground, I talked to Robert Gavin, the managing director of Property Horizons, a company which is investing in accommodation in North Dakota.

The biggest impact has been on the oil industry labour market. Oil rigs don’t run themselves – they require skilled workers willing to work long hours in demanding conditions. As a result, companies are offering high wages for even low-ranking jobs.

Given that much of the rest of the US is in near-recessionary conditions, the promise of decent wages has drawn people from all over the country. Even so, the firms have had to cast their net worldwide. Gavin notes that during his visit to Dakota last year he saw oil workers onsite from as far afield as Brazil, Africa and Japan.

Of course, all these workers need places to stay and places to eat. So the services sector in nearby towns is also booming as the new arrivals start to spend their wages. According to Gavin, local restaurants are packed out from 10am to 4pm.

 Those who work in fast food branches close to the rigs are reportedly being paid up to four times the minimum wage.

The Big Risk: Energy Booms Always Turn to Bust

The big risk is that energy booms have a tendency to turn into busts. North Dakota has gone through this cycle several times over the past few decades, both over coal and then oil during the energy crisis. Last year, there were fears that falling natural gas prices would result in the shale gas industry collapsing.

But while shale gas has certainly battered prices, they are starting to rebound. After hitting a bottom of $2/MMBtu last year, gas prices are now over $4/MMBtu. Robin Batchelor of the BlackRock New Energy Fund thinks that this is a price at which shale gas producers can make a reasonable return.

At the same time, while oil prices may go lower in the future, the US is hardly going to turn its nose up at a ready supply of oil from a reliable domestic source. In short, we think this boom is set to continue.

Matthew Partridge
Contributing Editor, Money Morning 

Join Money Morning on Google+

Publisher’s Note: This is an edited version of an article that originally appeared in <a href="” target=”_blank”>MoneyWeek

From the Archives…

<a href="” title=”Permanent Link to The Market Rebounds, but We’re Still Not Selling…” target=”_blank”>The Market Rebounds, but We’re Still Not Selling…
26-04-2013 – Kris Sayce

<a href="” title=”Permanent Link to Is This the Last Hurrah for the Australian Dollar?” target=”_blank”>Is This the Last Hurrah for the Australian Dollar?
25-04-2013 – Murray Dawes

<a href="” title=”Permanent Link to Here’s Proof the Silver Bullion Market is Alive and Well” target=”_blank”>Here’s Proof the Silver Bullion Market is Alive and Well
24-04-2013 – Dr. Alex Cowie

<a href="” title=”Permanent Link to Stand By for the Recession Rally in Resource Stocks: Take Two” target=”_blank”>Stand By for the Recession Rally in Resource Stocks: Take Two
23-04-2013 – Dr. Alex Cowie

<a href="” title=”Permanent Link to A New Take on Hard Asset Investing” target=”_blank”>A New Take on Hard Asset Investing
22-04-2013 – Kris Sayce

GBPUSD remains in uptrend from 1.5197

GBPUSD remains in uptrend from 1.5197, the fall from 1.5605 is likely minor consolidation of the uptrend. Support is at 1.5465, as long as this level holds, the uptrend could be expected to resume, and next target would be at 1.5700 area. On the downside, a breakdown below 1.5465 will indicate that consolidation of the longer term uptrend from 1.4831 (Mar 12 low) is underway, then deeper decline toward the upward trend line from 1.4831 to 1.5034 could be seen.

gbpusd

Forex Signals

Large Forex Speculators trimmed US Dollar bets to $24.49 billion

Large Traders and Hedge Funds slightly trim USD positions in the Futures Market

By CountingPips.com


cot-usd-values


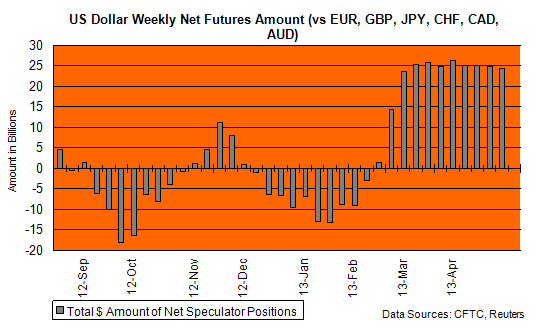
The most recent weekly Commitments of Traders (COT) report, released every Friday by the Commodity Futures Trading Commission (CFTC), showed that large futures traders slightly pulled back on their total bullish bets of the US dollar last week for a second consecutive week.

Non-commercial large futures traders, including hedge funds and large International Monetary Market speculators, totaled an overall US dollar long position of $24.49 billion as of Tuesday April 30th. This was a slight decline from the total long position of $24.94 billion on April 23rd, according to position calculations by Reuters that derives this total by the amount of US dollar positions against the total positions of euro, British pound, Japanese yen, Australian dollar, Canadian dollar and the Swiss franc.

Total US dollar long positions have continued to stay between $23.57 billion and $26.3 billion for the last nine weeks, according to the Reuters calculations. US dollar positions had been in an overall bearish position from November 2012 to February 2012 before turning into a bullish position on February 19th when USD bets equaled $1.481 billion.

What is the COT Report:

The weekly cot report summarizes the total trader positions for open contracts in the futures trading markets. The CFTC categorizes trader positions according to commercial hedgers (traders who use futures contracts for hedging as part of the business), non-commercials (large traders who speculate to realize trading profits) and nonreportable traders (usually small traders/speculators).


Individual Currencies Large Speculators Positions in Futures:

The individual currency net speculator positions last week saw advances for the euro, Japanese yen, British pound sterling, New Zealand dollar and the Canadian dollar while the Swiss franc, Australian dollar and the Mexican peso all had a declining number of net large trader contracts for the week.


Individual Currency Charts: (Please Click on Chart to Enlarge)


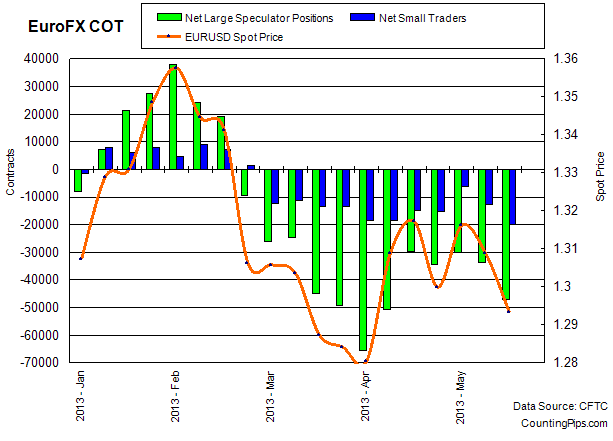
EuroFX: Weekly change of +4,126

EuroFx


EuroFX: Large trader positions for the euro improved last week after showing a decline the previous week. Euro contracts increased to a total net position of -30,149 contracts in the data reported for April 30th following the previous week’s total of -34,275 net contracts on April 23rd.


Last Six Weeks of Large Trader Positions: EURO

DateLg Trader NetChange
03/26/2013-49095-4211
04/02/2013-65701-16606
04/09/2013-5085814843
04/16/2013-2976421094
04/23/2013-34275-4511
04/30/2013-301494126

British Pound Sterling: Weekly change of +1,505

GBP


GBP: British pound spec positions improved last week to advance for a third consecutive week and to the best position since March 12th. British pound speculative positions improved last week to a total of -58,607 net contracts on April 23rd following a total of -60,112 net contracts reported for April 16th.


Last Six Weeks of Large Trader Positions: Pound Sterling

dateLg Trader NetChange Weekly
03/26/2013-66555-5075
04/02/2013-650201535
04/09/2013-69969-4949
04/16/2013-619757994
04/23/2013-601121863
04/30/2013-586071505

Japanese Yen: Weekly change of +8,603

JPY


JPY: Japanese yen net speculative contracts increased last week for the third consecutive week and to the best level since February 26th. Japanese yen positions increased to a total of -71,127 net contracts on April 30th following a total of -79,730 net short contracts on April 23rd.


Last Six Weeks of Large Trader Positions: Yen

dateLg Trader NetChange Weekly
03/26/2013-89149-9156
04/02/2013-7817110978
04/09/2013-77697474
04/16/2013-93411-15714
04/23/2013-7973013681
04/30/2013-711278603

Swiss Franc: Weekly change of -9,443

CHF


CHF: Swiss franc speculator positions declined last week after improving for the previous four consecutive weeks and to the best position since February 12th. Net positions for the Swiss currency futures dropped to a total of -8,264 contracts on April 30th following a total of +1,179 net contracts reported for April 23rd.


Last Six Weeks of Large Trader Positions: Franc

dateLg Trader NetChange Weekly
03/26/2013-12198-1202
04/02/2013-12015183
04/09/2013-100142001
04/16/2013-32536761
04/23/201311794432
04/30/2013-8264-9443

Canadian Dollar: Weekly change of +3,831

CAD


CAD: Canadian dollar positions improved slightly last week for a second consecutive week after falling to a new low level for 2013 on April 16th. Canadian dollar positions improved to a total of -67,848 contracts as of April 30th following a total of -71,679 net contracts that were reported for April 23rd.


Last Six Weeks of Large Trader Positions: CAD

dateLg Trader NetChange Weekly
03/26/2013-626452686
04/02/2013-64544-1899
04/09/2013-71133-6589
04/16/2013-75913-4780
04/23/2013-716794234
04/30/2013-678483831

Australian Dollar: Weekly change of -1,023

AUD


AUD: The Australian dollar large speculator positions fell slightly again last week to decline for a fifth consecutive week. Aussie speculative futures positions decreased to a total net amount of +30,234 contracts on April 30th after totaling +31,257 net contracts as of April 23rd.


Last Six Weeks of Large Trader Positions: AUD

dateLg Trader NetChange Weekly
03/26/20138551531460
04/02/201383971-1544
04/09/201377879-6092
04/16/201353175-24704
04/23/201331257-21918
04/30/201330234-1023

New Zealand Dollar: Weekly change of +1,345

NZD


NZD: New Zealand dollar speculator positions rose last week to just under the 2013 high level of April 16th. NZD contracts increased to a total of +29,050 net long contracts as of April 30th following a total of +27,705 net long contracts on April 23rd.


Last Six Weeks of Large Trader Positions: NZD

dateLg Trader NetChange Weekly
03/26/2013169164439
04/02/2013183871471
04/09/2013251506763
04/16/2013308085658
04/23/201327705-3103
04/30/2013290501345

Mexican Peso: Weekly change of -8,360

MXN


MXN: Mexican peso speculative contracts decreased lower last week for the second consecutive week. Peso positions declined to a total of +138,551 net speculative positions as of April 30th following a total of +146,911 contracts that were reported for April 23rd.


Last Six Weeks of Large Trader Positions: MXN

dateLg Trader NetChange Weekly
03/26/201312816218786
04/02/201314275514593
04/09/2013142542-213
04/16/20131512888746
04/23/2013146911-4377
04/30/2013138551-8360

The Commitment of Traders report is published every Friday by the Commodity Futures Trading Commission (CFTC) and shows futures positions data that was reported as of the previous Tuesday (3 days behind).

Each currency contract is a quote for that currency directly against the U.S. dollar, a net short amount of contracts means that more speculators are betting that currency to fall against the dollar and a net long position expect that currency to rise versus the dollar.

(The graphs overlay the forex spot closing price of each Tuesday when COT trader positions are reported for each corresponding spot currency pair.)

See more information and explanation on the weekly COT report from the CFTC website.


Article by CountingPips.comForex News & Market Analysis