HSBC Almost Double Profits to $8.4bn…

By HY Markets Forex Blog

Europe’s largest and strongest bank HSBC Holding is reported to have doubled their pretax profit to an estimated $8.43 billion from $4.32 billion earlier in the year for the first – quarter profit after the financial crises, bad load charges which is may probably step up its cost reduction targets according to HSBC.

HSBC‘s shares increased by approximately 3.3% to &37.4% which is said to be the highest since mid-March.

HSBC have moved at quite a faster and stronger pace than expected to cut costs after the crises and will continue to do so by cutting almost to 6,000 jobs this year from businesses that’s up for sale. HSBC has closed 52 businesses while 37,000 jobs have gone since late 2010.

HSBC are still facing and looking forward to the challenges ahead according to chief executive Stuart Gulliver. “Clearly you can expect us to continue to focus on our cost base,” says Stuart Gulliver.

The Europe largest bank‘s costs in the first quarter is currently down by 10% and is now saving almost $4bn a year. HSBC are willing to get costs lower than 52% by the end of the year which analyst predict the bank will be able to mark its cost saving target by $1bn a year.

HSBC‘s asset sales have also helped to raise the capital to cover taxpayers from the cost of rescuing banks in the future.


The post HSBC Almost Double Profits to $8.4bn… appeared first on | HY Markets Official blog.

Article provided by HY Markets Forex Blog

Central Bank News Link List – May 8, 2013: New Zealand central bank intervenes in currency market

By www.CentralBankNews.info

Here’s today’s Central Bank News’ link list, click through if you missed the previous link list. The list comprises news about central banks that is not covered by Central Bank News. The list is updated during the day with the latest developments so readers don’t miss any important news.

10 Shocking Earnings Season Trends (Part 2)

By WallStreetDaily.com

In yesterday’s column, I shared the startlingly low expectations analysts had for first-quarter earnings. And, of course, their predictions were rendered totally irrelevant.

For the second consecutive quarter, S&P 500 companies are on pace to grow earnings by about two percentage points more than analysts originally expected.

While their ineptitude may not be all that surprising, here are five more earnings season trends that might be…

Again, take note and invest accordingly…

~Surprise #6: Europe’s Woes Aren’t Sabotaging Revenue “Beat Rates”

Yesterday, I focused on the mildly bullish earnings “beat rate.” Today, it’s time to turn our attention to the revenue beat rate (i.e. – the percentage of companies topping analysts’ expectations for sales).

To put it bluntly, it started off in the tank at a mere 43%. Truth be told, we haven’t witnessed such a terrible reading since the height of the financial crisis.

Thankfully, though, we’ve made (significant) progress. The current revenue beat rate stands at 52%, according to Bespoke Investment Group.

While that’s still below the bull market average of 60%, it’s not terrible. Especially when you consider that companies aren’t suffering massive sales declines. Instead, S&P 500 sales are off a mere 0.1%, on average.

So much for “European exposure” sabotaging sales, as one Wall Street analyst boldly warned…

~Surprise #7: Underpromise Now… Overdeliver in the Second Half

Out of the 80 S&P 500 companies that provided guidance, 63 lowered expectations. That works out to 79%, which is well above the average of 61% over the last five years, according to FactSet.

Wall Street is wise to management’s ruse of underpromising and overdelivering, though. That’s why nobody’s rushing to lower earnings estimates for the next quarter.

In fact, second-quarter earnings revisions for the S&P 500 remain in line with historical averages. They dropped 2.5% compared to the five-year average quarterly revision of -2.8%.

So don’t sweat the seemingly negative guidance. Earnings growth for S&P 500 companies remains on track to accelerate in the second half of the year.

And since stock prices ultimately follow earnings, that bodes well for the longevity of this bull market.

~Surprise #8: No Fatigue Yet

At this stage of the bull market, you’d expect stock prices to exhibit a muted response to earnings – given that they’ve risen so much already. Think again!

Based on Bespoke’s calculations, the average one-day gain for stocks after reporting earnings checks in at 0.77%. That’s sky-high compared to the 10-year average of 0.12%.

~Surprise #9: Time to Hang Up on Telecom?

In terms of valuation, the S&P 500 is trading in line with historical averages. The current forward P/E ratio for the Index rests at 14, compared to the 10-year average of 14.1.

So, on average, we’re paying a fair price for stocks.

If we break down the valuations by sector, though, be wary of telecom stocks, including Windstream Corporation (WIN). The sector boasts the highest forward P/E ratio of 18.

Depending on whether or not you own any telecom stocks, it’s either time to hang up on them – or put them on your “Do Not Call” list.

~Surprise #10: Energy is (Still) Getting Cheaper

If you’re on the hunt for bargains, look no further than the energy sector. It’s the only one that experienced a decline in valuations over the last quarter.

The current forward P/E ratio checks in at a mere 11.9.

Now, I’ll be the first to concede that a cheap valuation doesn’t guarantee future profits. But it certainly reduces our risk.

There’s actually one corner of the energy market that I’m convinced is poised for a resurgence. So much so, that I’m getting ready to recommend that WSD Insider subscribers push some chips in on it.

Fair warning: It’s perhaps the most contrarian recommendation I’ve made all year. But that’s why the profit potential is so high.

Ahead of the tape,

Louis Basenese

Article By WallStreetDaily.com

Original Article: 10 Shocking Earnings Season Trends (Part 2)

Build Wealth Fast through the Resource Sector

By MoneyMorning.com.au

Back in 1992, Gina Rinehart’s wealth stood at $75 million.

By 2009, it had INCREASED 38-FOLD to $2.9 billion!

Not bad. But she had only just got started.

Today her personal wealth measures $29 billion.

Put another way, over 21 years her wealth has increased at an average growth rate of 32.8% per annum.

It’s hard to think of a sector outside of resources that can create such vast personal wealth so rapidly.

Not even the best-performing hedge fund manager in history can compete. Stan Druckenmiller was close, with average gains of 30% per annum over roughly the same time frame, but Rinehart is ahead by a nose. More to the point, the wealth is hers, not a fund’s.

My point is this: if you know how to navigate the resource sector, there’s simply no other wealth generator like it…

Rinehart’s is an exceptional story. When it comes to gains like that, not many can compete with the richest woman in the world.

But it’s not just the super-rich that have benefitted of course. The whole country has ridden commodities’ coattails for years.

Australia is responsible for nearly a quarter of global mining revenue, meaning it generates more mining wealth than any other single country. Then consider that is spread across a population of just 23 million.

Thanks in no small part to the resource sector, Australia’s GDP (at purchasing power parity) has soared to $39,465 per person. This means we are now ahead of long-time rivals in the mother country, who’s GDP per person is at $36,510. Unlike Australians, my fellow poms don’t have a quarry in the backyard to lean on when times get tough.

This Resource Boom Isn’t Over

And there may be plenty of profits from our ‘quarry’ ahead. Last week I wrote to you about how the commodity super-cycle may only be halfway through. After 14 years of rising commodity prices, investors are asking if there can be more to come. Well I see another sixteen years.

My reasoning is that there are almost four billion people across China, India, Indonesia and other ASEAN (Association of Southeast Asian Nations) members that are enjoying rapid economic growth.

And they are all in the process of raising their living standards. And don’t forget Japan, which is our second largest trading partner. Construction from the 2011 earthquake is warming up. Its economy is slipping back to growth.

This will all require vast amounts of commodities over the long-term, while mining investment is slowing. So it’s not hard to imagine strong commodity prices over the next ten years or more.

Last week I talked about the Kondratiev cycle, which suggests commodity price moves form a sixty-year cycle. This chart (via ETFS) originally published by the United Nations Department of Economic and Social Affairs, tracks the sixty-year super cycle for commodity prices. It neatly fits Kondratiev’s theory.

Commodity Price Rally to Last Another Sixteen Years?


Click to enlarge

The previous lows were in 1879, then sixty years later in 1939, and then most recently in 1999.

The highs were at thirty-year intervals between these dates. If the pattern continues, then the next peak won’t be for another sixteen years, in 2029!

It’s a very exciting investment opportunity. But start talking about resource investments, and most investors will glaze over!

The main reason is that resource stocks have fallen for 25 months now. Since April 2011, the metals and mining sector has tumbled by 40%. That’s enough to make anyone less than excited.

Compare that to the current market favorite, the financial index (XFJ), which is up by 40% in the last year alone.

Value Investors, Look Here

But the market is behaving as if it’s all over for mining. Nothing could be further from the truth. I think you’d need to be pretty brave, buying financial stocks after such a move, particularly when the sector is at its most overbought in 20 years!

In contrast, resource stocks are so cheap they’re back to GFC levels. As frustrating and ridiculous as it is, the important point is that it’s an exceptional opportunity. You can get depressed at the state of the market, or you can look for the kind of opportunities that made investors very wealthy last time the market was this cheap.

We may have even seen the bottom already, though I’d suspect it could take a few months of volatility to find the bottom and start recovering. This gives us time to scan for the best stocks to ride it.

It could be sooner. We’ve certainly heard some warning shots to stay alert in the last few days.

For starters, on Friday night, the copper price jumped by 6.8% in one session. This was its biggest jump in more than 18 months. It also means that over a few days, copper has climbed by 10%. US jobs numbers were the catalyst.

Moves like this are not normal. This kind of volatility can mark turning points for major trends.

The Australian resource sector has jumped since then, with the metals and mining index up 6.1% in three days.

So while may still be early days, it’s time to start thinking about how to play what I believe is an inevitable resource rebound rally. More on this later in the week.

Dr Alex Cowie
Editor, Diggers & Drillers

Join me on Google+

P.S. It has been a rotten two years for resource stocks. While the main index has gained 23% since mid-2011, the mining index has lost 35%. In today’s Money Morning Premium, Kris spotlights two blue-chip resource stocks investors should consider adding to their portfolio, and explains why small-cap resources stocks are a must-have too. Click here to upgrade now.

From the Port Phillip Publishing Library

Special Report: TORRENT SIGNAL 3

Daily Reckoning: The Stock Market is King and Cash is the Joker

Money Morning: 36% Potential Upside for Australian Stocks Over the Next Two Years

Pursuit of Happiness: The Government’s Idea of Wealth Creation

Diggers and Drillers:
Why You Should Invest in Junior Mining Stocks

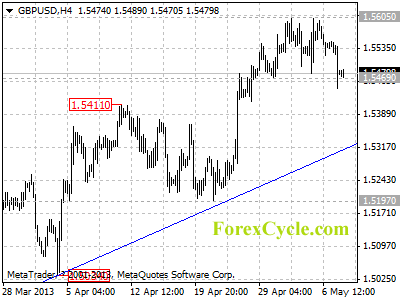
GBPUSD breaks below 1.5469 support

GBPUSD breaks below 1.5469 support, suggesting that consolidation of the uptrend from 1.4831 (Mar 12 low) is underway. Deeper decline would likely be seen, and the target would be at the upward trend line from 1.4831 to 1.5034. Key resistance is at 1.5605, only break above this level could trigger another rise to 1.5800 zone.

gbpusd

Forex Signals

Antifragility: Smoking TNT and Drinking Dynamite

By MoneyMorning.com.au

The Hydra of Greek myth is a many-headed serpent with a bad temper. But it has a special ability that makes it very hard to kill. When you cut off one head, two grow back in its place.

To author Nassim Nicholas Taleb, the Hydra is the perfect metaphor for ‘antifragility‘. The awkward and invented word is the title of his latest book, subtitled Things That Gain From Disorder.

It is a simple enough concept, but it is rich in application.

As an investor, antifragility captures an idea that I think will be more important in our crisis-filled times. In short, you want to own some Hydras in your portfolio.

Let us start with this aspect of the idea: You can’t predict when or what the next shock will be. (Unless you enjoy deceiving yourself, as Taleb points out.) But you can ‘state with a lot more confidence that an object or a structure is more fragile than another, should a certain event happen.

Antifragile Businesses

For example, you can state with confidence that a porcelain vase is more fragile than a steel pot if dropped. You can look at one building and deduce it will withstand an earthquake better than another. And you can compare stocks and say which is more likely to survive a crisis.

While reading the book, I kept thinking of companies I like that exhibit traits of antifragility. Like banks that did not suffer in the financial crisis, but used the opportunity to buy failed banks for cheap. Or like real estate companies that find deals in distressed assets. I also thought of reinsurance as an example of a great antifragile business.

Then, on Page 73 of Taleb’s book, I read:

‘Some businesses love their own mistakes. Reinsurance companies, who focus on insuring catastrophic risks (and are used by insurance companies to ‘reinsure’ such nondiversifiable risks), manage to do well after a calamity or tail event causes them to take a hit. If they are still in business and ‘have their powder dry’ (few manage to have plans for such contingency), they make it up by disproportionately raising premia…’

All the reinsurer has to do is keep mistakes small and maintain a nice cushion? Such a reinsurer has awesome antifragile properties.

I picked up on a similar theme in the June 1993 issue of Schiff’s Insurance Observer in a piece titled ‘Smoking TNT and Drinking Dynamite: It’s Business as Usual in the Insurance Industry’.

Insurance is one of those quirky industries for which bad news is good news, a point we should keep in mind as insurers take their beating from Hurricane Sandy.

As Schiff writes, ‘Earthquakes, hailstorms, explosions, blizzards, tornadoes and tropical storms are considered augurs of better times to come.’

The theory is that as insurers take their lumps, there is less insurance capital around. Less capital around means higher prices for insurance. In this way, insurers make up the losses and then some. It doesn’t always work out that way, of course, but often seems to.

Point being, reinsurance would seem a rare industry that gains from disorder. It is a Hydra. Hydras, though, don’t dwell only in certain industries. There are characteristics that cut across industries. I can’t do justice to the many ideas in Taleb’s book here, but I want to highlight one.

No Upside Without Downside

‘Skin in the Game’ is a chapter in Taleb’s book. Simply put, if you want antifragility, it helps to have insiders with money on the line. No upside for anyone without downside. No freebooting CEOs with golden parachutes when they fail.

No wonder, then, ‘there seems to be a survival advantage to small or medium-sized owner-operated or family-owned companies…There is a difference between a manager running a company that is not his own and an owner-operated business.’ The latter has downside.

Clearly, most of the stock market does not operate on this principle. Instead, most corporate ‘suits’ have ‘incentives’ but minimal ownership. They get a free ride at the shareholders’ expense.

Taleb uses the example of Robert Rubin, who made $120 million in a decade at Citibank. Citibank collapsed, but Rubin kept his money. Shareholders lost. (And taxpayers, too, unfortunately.) This aspect of modern markets really irritates me. I get grumpier about it as I get older. I’m at risk of becoming a curmudgeon.

Fortunately, as fragile as much of the market and its corporations may be, there are always exceptions. I want to own the exceptions. And some of these even profit from this world of disorder.

Which reminds me of another metaphor I thought of for antifragility: the fictional private detective Philip Marlowe. In one of Raymond Chandler’s short stories, Marlowe says: ‘Trouble is my business. How else would I make a nickel?’

Chris Mayer
Contributing Editor, Money Morning

Join Money Morning on Google+

From the Archives…

The Market Rebounds, but We’re Still Not Selling…
26-04-2013 – Kris Sayce

Is This the Last Hurrah for the Australian Dollar?
25-04-2013 – Murray Dawes

Here’s Proof the Silver Bullion Market is Alive and Well
24-04-2013 – Dr. Alex Cowie

Stand By for the Recession Rally in Resource Stocks: Take Two
23-04-2013 – Dr. Alex Cowie

Bitcoin in the Firing Line

By MoneyMorning.com.au

The market for Bitcoin is evolving quickly and furiously, posing both opportunities and risks.

While the price has stabilised somewhat since the wild swings during the last two months, the velocity of transactions has fallen as people are choosing to hoard their existing stash, rather than spend it.

The consensus among close watchers is that people are waiting for the exchange rate to drop steadily below US$100 or rise steadily above US$200 before making any big moves…

The pace of Bitcoin purchases is way up, but most striking trend has been the dramatic slowdown of velocity. The price rise has discouraged owners from spending, potentially giving the Bitcoin retail sector a reason for retooling expectations. Yet this trend can change in minutes, and with a relatively thin market for now, the actions of large players can make a huge difference.
 
The payment system itself is still on the march. The Wall Street Journal reports that John Donahoe, CEO of PayPal and eBay, is looking into integrating Bitcoin into its entire payment platform. ‘It’s a new disruptive technology, so, yeah, we’re looking at Bitcoin closely,’ Donahoe said. ‘There may be ways to enable it inside PayPal.’

If this happens, it would be a big move for both the company and the currency. That he made the statement at all indicates just what an important player Bitcoin is already.

In a few short months, it has gone from being a tiny niche technology for geeks and pot sellers to having a $1 billion market capitalization and attracting some of the smartest venture capital in the digital world. The first fully functional Bitcoin ATM is being unveiled. If these become common in large cities around the world, the market will broaden and deepen dramatically.

The announcement comes as more merchants are rushing to attend a Bitcoin trade show in Palo Alto, Calif., on May 13-15. This conference is attracting many highfliers in Silicon Valley with plenty of venture capital to throw in the direction of this emerging currency. The speaker lineup alone is a who’s who of the entire digital currency marketplace. And Forbes is running a series on what it is like to live on Bitcoin exclusively for an entire week!

Bitcoin: Bad Press and Stress in the System

Meanwhile, the Bitcoin/dollar exchange rate has been under some pressure in the past week. Most observers think this is due to technical troubles at Silk Road, the Bitcoin escrow service that allows buyers and sellers to exchange money for just about anything (legal or illegal). Silk Road – just like the main Bitcoin exchange, Mt. Gox – has been hit by rapid-fire database queries that hammer the site to the breaking point. This time, it broke and stayed that way for days.

Bitcoin also got hit with bad press because the code to verify transactions has hosted some text files that carry additional embedded files from WikiLeaks and even some pornography. Even though users will never see these files unless they are very tech savvy, it’s unwanted exposure for Bitcoin. Global Guerillas has the story, and CNN Money has picked it up as well.

The problem (which generates bad PR, but, again, doesn’t affect most users) can be solved, but there are additional issues cropping up that are not so easily solved. For example, regulators are growing ever more interested in bringing Bitcoin within their reach.

The Financial Crimes Enforcement Network will be policing exchanges to make sure they are compliant with regulations. They will surely find some that are not. In this case, we could see some Bitcoin exchange owners frog-walking to the paddy wagons before the year’s end, which will only add to the bad press and scare away new adopters.

This is not a terrible thing, though, because the sector does need time to develop in an atmosphere without speculative frenzies.

In Canada, some banks are already spooked. TD Bank and RBC have frozen the accounts of two Bitcoin exchanges. James Grant, owner of Canadian Bitcoins, was told in a form letter from the bank that his account was closed, and his exchange is making the necessary adjustments. But Melvin Ng, proprietor of CADBitcoin, received a phone call and has decided to leave the exchange business altogether.

Such problems will continue for years until the market settles. Remember, digital currency is in the same position today that the World Wide Web was in 1995 – a huge experiment in trial, error, and real-time development. Meanwhile, there are some digital products out there that demonstrate that the unity of cryptography and payment system is here to say.

As with all emerging technologies, the best strategy is to sit tight and try to relax. Wade slowly into the shallow end of the Bitcoin pool and don’t purchase more than you can lose. This market will mature and stabilize in time, but we could be looking at five or 10 years for that to happen.

Jeffrey Tucker
Contributing Editor, Money Morning 

Join Money Morning on Google+

From the Archives…

The Market Rebounds, but We’re Still Not Selling…
26-04-2013 – Kris Sayce

Is This the Last Hurrah for the Australian Dollar?
25-04-2013 – Murray Dawes

Here’s Proof the Silver Bullion Market is Alive and Well
24-04-2013 – Dr. Alex Cowie

Stand By for the Recession Rally in Resource Stocks: Take Two
23-04-2013 – Dr. Alex Cowie

A New Take on Hard Asset Investing
22-04-2013 – Kris Sayce

36% Potential Upside for Australian Stocks Over the Next Two Years

By MoneyMorning.com.au

There’s something exciting about a volatile market.

One day as stocks rise, the bulls can shout down the bears: ‘See, we told you!’

The next day as stocks fall, the bears can shout down the bulls: ‘See, we told you!’

It’s a darn sight more exciting than the boring but inexorable climb we saw from November through to January.

But what we like most of all about the current volatile market is seeing other investors get over-excited and ignore the market’s clear message – that stocks aren’t going anywhere fast for the rest of this year…

OK, we could be wrong.

No one can predict the market’s future moves with 100% accuracy. But forming an opinion on the market’s direction and then betting on it is a key part of investing.

Of course, most investors don’t put in half the effort we do. They don’t have the time. We’ve got 8, 10 or 12 hours per day to think about investing (plus a few extra hours at the weekend if we’re writing our monthly issue of Australian Small-Cap Investigator).

And if you’ve paid any attention to Money Morning over the past few months you’ll know we’ve had a simple – very simple – theory about how the market will move this year.

Trading the Stock Market’s Holding Pattern

So far, it’s all going to plan. The chart below sums things up neatly:

You’ll notice that we haven’t drawn the line right at the peak or trough of the range. There’s a simple reason for that. We’re a big fan of technical analyst, Murray Dawes’ ‘false breakout‘ trading style.

It’s the idea that when a stock or index goes through a key level, rather than continuing the trend, the trend usually reverses. That’s what happened at the bottom of the range in early April, and the top of the range in late April.

And if our prediction is right, you’ll see the market test the high and low of this range for the rest of the year. It’s something of a holding pattern if you like.

Keeping the stock market in that range is likely to be the Reserve Bank of Australia (RBA) and its interest rate policy.

The reason for that is simple. Dividend stocks are now trading as high as they’re likely to go unless the RBA cuts interest rates. This is what we mean when we say the market will trade on a ‘relative yield basis’ for the rest of the year (something we wrote about a couple of months ago).

With the RBA cash rate at 3% and online bank deposit rates around 4-5%, it’s hard to see dividend yields falling much lower than the current level.

That’s why we believe the market is unlikely to rise much higher than today’s level. There is however, one thing that could scupper our argument – rising company profits.

What Happens to Stocks if the RBA Cuts?

The bigger than expected profit results from Australian & New Zealand Banking Group [ASX: ANZ] and Westpac Banking Corporation [ASX: WBC], plus increased dividend payouts helped push the Aussie market higher last week.

It pushed the index past the previous high and created what Murray calls a ‘false break’. We pointed that out to you last week, predicting that stocks would soon fall back to the low end of the range.

That hasn’t happened yet. But it should happen, unless investors keep buying dividend stocks at this level. In order for them to do so, they’ll need to believe that companies can increase earnings (and therefore increase dividends)…or that the Reserve Bank of Australia will cut interest rates.

Seeing as the next RBA decision is today, perhaps that’s what investors are holding out for. They don’t want to sell stocks on the chance the RBA cuts rates, which could send stocks higher…but you can be almost certain that if the RBA doesn’t cut rates then stocks will tumble this afternoon.

Now, that’s all guesswork. Anything could happen. If the markets were 100% predictable you’d never make money from them. It’s the unpredictability and the potential to get things wrong that allows you to potentially make a lot of money when you get things right.

Australian Stocks on the Road to 7,000

And for now we’ll assume we’re right. That’s why we don’t want you to sell stocks at this point. This is the time to hold. If, as we expect, stocks fall to the low end of the range, that will be your chance to buy more dividend paying stocks at a discount.

If stocks defy our expectations and climb higher, you’ll still be ahead of the game because you chose to keep hold of your stocks. If a new ‘holding pattern’ forms we’ll have to revisit our opinion on whether you should buy stocks around this level.

Of course, the biggest threat to our prediction is that stocks could fall to the bottom of the range and then keep falling. We don’t believe that will happen in the short term, but it’s a possibility.

Even though we’re banking on Australian stocks hitting 7,000 points within two years, we’re still keeping a fairly conservative approach to stocks. Depending on your attitude to risk, you probably shouldn’t have more than 50% of your investments tied up in stocks. So if the Australian market doesn’t hit 7,000 points as we expect, at least you won’t have put your entire savings on the line.

That said, if you asked us to bet whether the market will be higher or lower two years from now, we wouldn’t hesitate to say higher…much higher.

Cheers,
Kris

Join me on Google+

P.S. With interest rates at record lows and dividend yields falling, it pays to think of simple and practical ways to benefit from low rates. In today’s
Money Morning Premium I reveal one way to get at least some financial security during this volatile time. Click here to upgrade now.

From the Port Phillip Publishing Library

Special Report: TORRENT SIGNAL 3

Daily Reckoning: Forget Investing, Let’s Spend

Money Morning: Money Weekend’s FutureWatch

Pursuit of Happiness: What the Government’s Latest Money Grab Means for You

Australian Small-Cap Investigator:
How to Make Money From Small-Cap Stocks

Belarus cuts rate 200 bps, sees lower April inflation

By www.CentralBankNews.info     The central bank of Belarus cut its benchmark refinancing rate by a further 200 basis points to 25 percent, its third cut this year, saying inflation is expected to be “significantly lower” in April than in previous months, which leaves real interest rates at “a significant positive level.”
     The National Bank of the Republic of Belarus, which has cut rates by 500 basis points this year, said a positive trade balance, along with a permanent excess supply of foreign exchange is stabilizing the Belarusian rouble, “and even strengthening it.”
    Belarus, a former Soviet republic located between Russia and Poland, devalued its rouble by about half during a balance of payments crises in May 2011, sparking inflation that peaked at almost 110 percent in January 2012. The central bank responded to the surge in inflation by hiking interest rates from 10.5 in January 2011 to a high of 45 percent in December that year.
    Although the inflation rate was still over 100 percent, the central bank started slashing its rate in February 2012, cutting its policy rate by 1500 basis points last year – the largest amount by any central bank in the world – as inflation rapidly fell.
    In March, inflation in Belarus eased to 22.2 percent from February’s 22.7 percent.
    In its policy guideline for 2013, the central bank expects its refinancing rate to reach 13-15 percent by the end of this year given the deceleration of inflation.

    www.CentralBankNews.info

Global Monetary Policy Rates – Apr. 2013: Central banks’ policy rates fall 749 bps as rate-cutting spree accelerates

By www.CentralBankNews.info
    Global interest rates fell further last month as eight central banks eased their policy stance – most notably the Bank of Japan with its “new phase of monetary easing” – pushing the average global monetary policy rate down to 5.70 percent at the end of April from 5.79 percent at the end of March and 6.2 percent at the end of 2012.
    Central banks cut their key rates by a total of 774 basis points in April, the highest monthly amount this year, boosting this year’s total rate cuts to 1876 basis points.
    Including Brazil’s rate rise in April, rates fell by a net 749 basis points, and including rate rises by five central banks this year, the net decline in the first four months amounted to 1716 basis points.
    Belarus, Sierra Leone and Mongolia were the top three rate-cutters in April, slashing rates by 150, 300 and 100 basis points, respectively, in response to lower inflationary pressures. Together, these three central banks accounted for 73 percent of the total rates cuts in April and 45 percent of the total decline of rates in the first four months of 2013.
    The National Bank of the Republic of Belarus was already the world’s most aggressive rate cutter in 2012 when it slashed rates by 1500 basis points as inflation tumbled from 110 percent to 22 percent.
    It is likely to remain in the top tier this year as its policy rate is still 27 percent, the highest among the 90 central banks covered by Central Bank News, and it expects inflation to continue to decline. The world’s second highest rate belongs to Malawi, with a rate of 25.0 percent, while Sierra Leone takes the third place, with a rate currently at 17.0 percent.
    (To see current rates, see Central Bank News’ Global Interest Rate Monitor (GIRM).
    As the Bank of Japan’s policy rate was already virtually zero – in October 2010 it was cut to 0-0.10 percent from 0.10 percent – it had to resort to massive asset purchases in an effort to slay deflation. This move is not captured by our table of rate cuts so the BOJ’s rate has been set at zero.
    As part of the shake-up of its monetary policy framework, the BOJ will no longer target the overnight call rate but rather the country’s monetary base – banks’ reserves at the central bank plus cash in circulation – which it aims to boost to 270 trillion yen by end-2014 from 138 trillion end-2012 through money market operations.
    From January through April this year, 22 central banks have cut rates compared with five banks that have raised rates, illustrating that the trend in global monetary policy is still toward lower rates.
    Excluding Denmark, which only raised its rate in January due to foreign exchange concerns, the four rate rises were in response to growing inflationary pressure.
    Brazil’s central bank was the lone rate-riser in April, ending a six-month hiatus. The Central Bank of Brazil carried out an easing campaign from August 2011 to October 2012 as rates were cut from   12.50 percent to 7.25 percent. Last month it raised its key Selic rate to 7.50 percent as inflation topped its tolerance band but it didn’t indicate a future policy direction.
 

                                GLOBAL MONETARY POLICY RATES (GMPR)
                   CHANGES IN APRIL AND YEAR-TO-DATE, IN BASIS POINTS:

COUNTRYMSCI            APRIL                YTD 
RATE CUTS:
BELARUS-150-300
SIERRA LEONE-300-300
MONGOLIA-100-175
KENYAFM0-150
COLOMBIAEM0-100
HUNGARYEM-25-100
MOLDOVA-100-100
POLANDEM0-100
VIETNAMFM0-100
GEORGIA0-75
BOTSWANA-50-50
INDIAEM0-50
JAMAICA0-50
MEXICOEM0-50
TURKEYEM-50-50
ALBANIA0-25
ANGOLA0-25
AZERBAIJAN0-25
MACEDONIA0-25
W. AFRICAN STATES0-25
BULGARIAFM1-1
JAPANDM-0.1-0.1
SUM:-774.1-1876.1
RATE INCREASES:
DENMARKDM010
BRAZILEM2525
TUNISIAFM025
EGYPTEM050
SERBIAFM050
SUM:25160
NET CHANGE:-749.1-1716.1