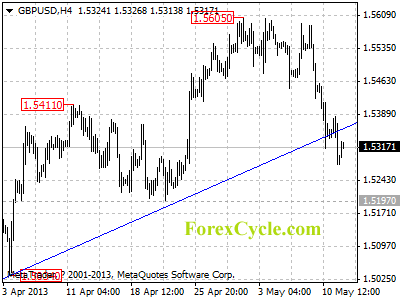
GBPUSD breaks below trend line support

GBPUSD breaks below the support of the upward trend line from 1.4831 to 1.5034, suggesting that the uptrend from 1.4831 (Mar 12 low) had completed at 1.5605 already. The pair is now in downtrend from 1.5605. Further decline would likely be seen over the next several days, and next target would be at 1.5150 area. Resistance is at 1.5450, only break above this level could trigger another rise towards 1.5800.

gbpusd

Daily Forex Forecast

‘Abenomics’ Cannot Master the Immutable Laws of Money

By MoneyMorning.com.au

The Japanese Topix Index is up more than 40% this year (and nearly 71% since July 2012) thanks in large part to Prime Minister Shinzo Abe’s unlimited stimulus initiative known euphemistically as ‘Abenomics‘.

The argument behind this spending is a classic one, at least in economic terms: stimulate the economy to produce higher inflation, weaken the currency and aid the exporters.

But like US Fed Chairman Ben Bernanke’s spending and Draghi’s spending in Europe, it’s ultimately going to fail.

Sure the short-term effects are great…a wildly enthusiastic stock market that’s trading at the highest levels seen in 4.5 years, a relaxation of risk and fresh strength in export focused companies that are showing stronger results on a devalued Yen. No question, I’ll take a bull market any day.

It’s the hangover I’m worried about – nobody knows how long this run will last.

This is especially problematic because most investors don’t have the discipline needed to trade in and, of course, out when the party stops.

Piercing the Veil

I bring this up because it’s not popular right now to look behind the scenes or inside the kimono, as the old expression goes:

  • Although Japan is known as an export market, it actually imports more than it exports, to the tune of $857 billion in imports versus $793 billion of exports. This is particularly a vexing problem with regard to fuel.

    Ninety-six percent of Japan’s reactors remain off-line since the earthquake/tsunami of 2011. The corresponding rise in liquid natural gas expenditures was more than 50% in Q1 at 624 billion Yen. That hasn’t yet hit earnings, especially in power intensive manufacturing sectors.

  • Japanese citizens have experienced a 27% drop in purchasing power (against the USD) since September 2012, when the Yen began its slide. At the same time, costs are going up faster than wages. I see the effects in my neighbourhood (in Tokyo) daily as once spotless cars go unwashed, paint is peeling off buildings and the formerly flawless facade of Japan starts showing some cracks.
  • The Japanese mortgage market is backfiring in reaction to stimulus. Case in point, the latest data from Mizuho Securities shows rates rising at a time when they should be falling thanks to the Bank of Japan flooding the system with cash.
  • The 30-year mortgage, for example, rose from 1.80% to 1.81%. Contrast that with the US, which saw mortgage rates fall by nearly 50% in reaction to Bernanke’s stimulus from 2008 to May 2 all the way to 3.35%.

  • Combined public, private and corporate debt was already approaching 500% of GDP before this stimulus. Nobody knows how much higher it can go, but to say the nation is functionally bankrupt is an understatement.
  • The population is literally dying off and household savings are in decline. This means the excess capacity needed to absorb newly minted Japanese bonds is also in decline. Unless, of course, Japan goes to external sources.
  • But then, there’s a real problem…international markets will demand higher rates to cope with higher risks. Derivatives traders are already lining up to play this game the way they did with Greece, Spain and Italy. The true cost of capital will more than double.

  • Volatility risk is rising, so this game is already underway. Because the Bank of Japan is buying government bonds, they are effectively locking out other market participants and reducing liquidity. Not surprisingly, volatility is rising and the markets are going to fast become addicted to implicit BOJ support the way a drug user depends on his next ‘fix’.

Are There Any Winners?

Yes. Quite a few actually: 310 out of 521 Topix companies that have reported since April 1 have beaten analyst estimates soundly.

But to really home in on the winners, you’ve got to focus on those sectors that will derive the biggest benefits from Abenomics: Japanese financial companies, car makers and industrial ceramics.

The financial companies are pretty easy to understand. The flood of government liquidity will help them generate higher profits while also flushing them with cash.

If they lend it into the system instead of hoarding it like the big banks in the United States, there could be some huge profits working their way to the bottom line.

At the end of the day, stimulus is what it is…a well-intentioned but completely flawed effort to master the immutable laws of money.

That’s why you want to go with investment choices that have the equity necessary to underwrite the risks that come with it.

Keith Fitz-Gerald
Contributing Editor, Money Morning

Join Money Morning on Google+

Publisher’s Note: This is an edited version of an article that originally appeared in Money Morning (USA)

From the Archives…

Why Small-Cap Resource Stocks Beat Blue Chips Hands Down
10-05-2013 – Dr Alex Cowie

Can Australian Stocks Defy Gravity if The Australian Dollar Falls?
9-05-2013 – Murray Dawes

Build Wealth Fast through the Resource Sector
8-05-2013 – Dr Alex Cowie

36% Potential Upside for Australian Stocks Over the Next Two Years
7-05-2013 – Kris Sayce

The Key to Becoming a Successful Investor
6-05-2013 – Kris Sayce

How a Fibonacci Cluster Showed an Important Resistance Level in Gold

Senior Analyst Jeffrey Kennedy shares techniques that helped spot a trading opportunity.

By Elliott Wave International

If you use Elliott in your technical analysis, you may already use Fibonacci ratios to determine targets and retracement levels in your charts. But have you heard of “Fibonacci Clusters?”

Elliott Wave Junctures editor Jeffrey Kennedy shares his charts to illustrate this technique, which he recently used to identify a critical turning point in Gold. The following lesson is adapted from his March 26 video. Get more lessons from Jeffrey in the free report, 6 Lessons to Help You Spot Trading Opportunities in Any Market.


Performing multiple Fibonacci calculations of a price move often yields concentrations of Fibonacci levels, which act as barriers to price moves.

How do you create a Fibonacci Cluster of support or resistance?

In the following chart, you can see how to draw a line from the most recent swing high to the relevant low� and then connect previous higher highs to the same pivotal low. In the rectangular box, notice where the advance in GCA reversed from a cluster:

Kennedy covers other examples to explain how slingshots, reverse divergence and positive/negative reversals highlight the same momentum signature:

A bullish slingshot forms when prices make higher lows while underlying momentum surpasses previous extremes. Conversely, a bearish slingshot occurs when prices make lower highs while momentum exceeds prior readings.

In subsequent days, Gold prices fell to below $1550.


Learn How You Can Use Fibonacci to Improve Your TradingIf you’d like to learn more about Fibonacci and how
to apply it to your trading strategy, download the entire
14-page free eBook, How You Can Use Fibonacci
to Improve Your Trading
.EWI Senior Tutorial Instructor Wayne Gorman explains:

  • The Golden Spiral, the Golden Ratio, and the Golden Section
  • How to use Fibonacci Ratios/Multiples in forecasting
  • How to identify market targets and turning points in the markets you trade
  • And more!

See how easy it is to use Fibonacci in your trading. Download your free eBook today >>

This article was syndicated by Elliott Wave International and was originally published under the headline How a Fibonacci Cluster Showed an Important Resistance Level in Gold. EWI is the world’s largest market forecasting firm. Its staff of full-time analysts led by Chartered Market Technician Robert Prechter provides 24-hour-a-day market analysis to institutional and private investors around the world.


Will Oil Futures Stop the Fed’s QE Program?

By J.W. Jones, OptionsTradingSignals.com

The sell-side analysts and economists are reminding retail investors that risk assets in the United States have been on quite a tear to the upside recently. A correction now lasts a matter of days, if not hours before the bulls push equity prices even higher.

The Federal Reserve is winning the reflation war using cheap money and massive levels of liquidity to help drive risk assets higher and interest rates artificially lower. Unfortunately for domestic investors searching for yield, they find that they are forced to incur higher levels of risk in order to satisfy their growth and income needs. There are significant risks associated with higher than average fixed income returns and the cost will be felt should we see any correction in the future.

However, the Federal Reserve has a history that is littered with dismal results. The purchasing power of the U.S. Dollar has been reduced by more than 90% since the Fed’s inception in late December of 1913. Since that time, the Federal Reserve has stolen more “real” wealth from the American people than any other institution in the history of mankind.

The Federal Reserve has two primary functions. One function is to maintain price stability or in other words to moderate inflation. Clearly over the past 100 years their inflation track record has been horrific. However, the Fed’s recent track record regarding the value of the U.S. Dollar Index has been dismal the past 15 years as shown below.

Chart1(1)

As can be seen clearly above in the Dollar Index Futures monthly chart, at present levels the Dollar’s overall value has diminished well over 31% since late 2001. I would also draw readers’ attention to the selloff that occurred from late 2005 until the early part of 2008. The selloff during that period of time is important to reinforce my next consideration.

Recently the flow of liquidity has primarily been seen in record low interest rates and a surging U.S. equity market. Nearly every day the Dow Jones Industrial Average or the S&P 500 Indexes make a new all-time high. The question that I would like to posit for readers is how long will it be before the so-called smart money starts looking at the attractiveness of commodities relative to equities?

If the Federal Reserve continues to print money at this pace, what will ultimately stop them dead in their tracks? The short answer is energy prices. The easiest way to stop the Fed’s printing press is to see a massive spike in energy prices. While we often hear that history does not repeat but it often rhymes, consider the price action in oil futures during the same 2006 – 2008 selloff in the U.S. Dollar Index.

Chart2(1)

It is readily apparent that once oil futures were able to push above the $78 / barrel highs in mid-2006, prices exploded while the U.S. Dollar came under strong selling pressure. The timing could not be more impeccable for the explosive nature in the move higher in oil.

Furthermore, if we move forward to present day price action in oil futures we have a large triangle pattern on the long-term charts. The pattern offers the inflation versus deflation argument that so many economists and strategists are plagued by presently in their analysis.

My suggestion is that watching the price of oil futures is likely going to tell us the intermediate expectation by the market of what lies ahead in the inflation versus deflation debate. The movement of oil futures prices in the intermediate term is likely to be based on which direction the triangle pattern ultimately breaks.

Chart3(1)

What is obvious about this pattern is that a move that could hurdle $100 / barrel will open up a strong move toward $112 – $120 / barrel. If we were to see a move higher in oil futures that could push above the $120 / barrel price level set back in early 2011 a fierce rally in oil futures could play out.

A strong rally in oil futures will ultimately put the final nail in the coffin for U.S. equity markets and the U.S. economy. Gasoline prices would obviously rocket higher and the U.S. economy would quickly be brought to its knees. The Federal Reserve would be forced to either print more money and run the risk of higher oil prices, or do nothing and run the risk that the equity selloff could intensify.

I want to be clear that I am not calling for a rally in oil futures. Price action could go either way depending on market conditions, but the real question is regardless of which way price breaks in the future, how does it help equity markets? Those evil oil speculators run down by politicians seeking air time on television and radio could be the final straw for Ben Bernanke and the Federal Reserve.

Whether the future is full of inflation, deflation, or stagflation I am confident that energy prices will play a critical role in price discovery for not just oil and oil distillates, but for the overall domestic economy.

If the Fed does not show constraint at the appropriate time, oil and other commodity prices are likely to remind Chairman Bernanke that the Federal Reserve’s future track record is likely to be as dire as its historical performance.

Need A Simple 2-3 Trades Per Week Trading Strategy?

Join www.OptionsTradingSignals.com today

JW Jones

This material should not be considered investment advice. J.W. Jones is not a registered investment advisor. Under no circumstances should any content from this article or the OptionsTradingSignals.com website be used or interpreted as a recommendation to buy or sell any type of security or commodity contract. This material is not a solicitation for a trading approach to financial markets. Any investment decisions must in all cases be made by the reader or by his or her registered investment advisor. This information is for educational purposes only.


Correction near but Bull Market has LONG waves to Go!

David Banister- www.MarketTrendForecast.com

The SP 500 has been on a tear as we all know especially since the SP 500 bottomed at 1343 several months ago.  My work centers around forecasting using Elliott Wave Theory along with other technical indicators. This helps with projecting the short, intermediate, and longer term paths in the stock market and also precious metals. This larger picture Bull Cycle started in March of 2009 interestingly after an exact 61.8% Fibonacci retracement of the entire move from 1974 to 2000 lows to highs.  At 666, we had completed a major cycle bottom with about 9 years of movement to retrace 26 years of overall bull cycle. That was a major set of 3 waves (Corrective patterns in Elliott Wave Theory) from the 2000 highs to 2002-3 lows, then 2007 highs to 2009 lows.  Once that completed its work, we were free to have a huge new bull market cycle off extreme sentiment and generational lows.

It’s important to understand where we were at in March of 2009 just as much as it is today with the market at all-time highs. Is this the time to bail out of stocks or do we have a lot more upside yet to go? Our short answer is there is quite a bit more upside left in the indexes, but there are multiple patterns that must take place along the way. We will try to lay those out for you here as best we can.

Elliott Wave theory in general calls for 5 full wave cycles in a Bull pattern, with 1, 3, and 5 bullish and 2 and 4 corrective. We are currently in what is often the most bullish of all the patterns, a 3rd of a 3rd of a 3rd. In English, we are in Primary wave 3 of this bull cycle which will be 5 total primary waves.  We are in Major wave 3 of that Primary 3, and in the Intermediate wave 3 of Major wave 3.  That is why the market continues its relentless climb. This primary wave 3 still has lots of work to do because Major wave 3 still has a 4th wave down and a 5th wave up to finish, then we need a major 4, then a major 5.  That will complete primary wave 3.  This will then be followed by a Primary wave 4 cycle correction that probably lasts several months, and then a Primary wave 5 cycle to finish this part of the bull market from March 2009 generational lows… and all of that work is going to take time.  Once that entire process from March 2009 has completed, then we should see a much deeper and uglier correction pattern, but we think that is at least 12 months or more away.

What everyone wants to know then is where are we at right now and what are some likely areas for pivot highs and lows ahead?  We should complete this 3rd of a 3rd of a 3rd here shortly and have a wave 4 correction working off what will likely be almost 300 points of upside from  SP 500 1343. We could see as much as 90-120 points of correction in the major index once this wave completes.  Loosely we see 1528-1534 as a possible top and if not then maybe another 30 or so points above that maximum into early June.  This should then trigger that 90-120 point correction, and then be followed by yet another run to highs.

We could go on but then we will lose our readers here for sure, and as it is… this is all projections and postulations, so it’s best to keep the forecast to the next many weeks or few months. Below is a chart we have put together showing the structure of Major wave 3 of Primary 3 since the 1343 lows. Once that Major wave 3 tops out (see the blue 3) then we will have Major 4, then Major 5 to complete Primary wave 3 since the 1074 SP 500 lows.  Whew!

TMTF
Join us to get daily updates on nearer term directions of the SP 500 and Gold at www.MarketTrendForecast.com


Israel cuts rate 25 bps in surprise move, to start buying FX

By www.CentralBankNews.info     Israel’s central bank cut its policy rate by 25 basis points to 1.50 percent and will intervene in the foreign exchange market where the shekel is continuing to appreciate due to the start of natural gas production, rate cuts by other central banks, continued quantitative easing in major economies and an expected moderation in global growth.
    The rate cut by the Bank of Israel (BoI) was a surprise move and the bank’s Monetary Policy Committee said the decisions were reached “outside the regularly scheduled framework.” The next scheduled meeting of the committee is May 27.
    At its last meeting in March, the BoI had said economic activity was continuing to improve but it was still too early to determine if the economy had turned the corner. In 2012 the BoI cut rates by 100 basis points but had left them unchanged so far this year.


Central Bank News Link List – May 13, 2013: G7 to press on with bank reforms, Japan escapes censure

By www.CentralBankNews.info Here’s today’s Central Bank News’ link list, click through if you missed the previous link list. The list comprises news about central banks that is not covered by Central Bank News. The list is updated during the day with the latest developments so readers don’t miss any important news.

Precious Metals Fall as US Dollar Holds Gains, India’s New Import Restrictions “Could Cut Gold Imports by 50%”

London Gold Market Report
from Ben Traynor
BullionVault
Monday 13 May 2013, 07:15 EDT

SPOT MARKET gold bullion prices fell to $1430 an ounce Monday, 1.2% down on where they ended last week, as stock markets also fell and the US Dollar held onto most of its gains from last week.

Silver fell to $23.70 an ounce – 0.8% down on last week’s close – as other commodities also fell, with the exception of copper.

India’s central bank meantime confirmed proposed restrictions on gold imports that one refiner said could lead to gold imports falling by half this year.

Since breaking through ¥100 last week, the Dollar has held most of its gains against the Japanese currency, while the US Dollar Index, which measures the Dollar’s strength against a basket of other currencies, is trading close to one-year highs.

“Yen selling will have been encouraged by the outcome from [last week’s] G7 meeting,” says Bank of Tokyo-Mitsubishi currency analyst Lee Hardman, “where officials reiterated that they will tolerate Yen weakness as long as it results from the use of domestic instruments to stimulate the Japanese economy.”

The US Federal Reserve meantime has “mapped out a strategy” for winding down its $85 billion a month asset purchase program, known as quantitative easing, according to an article by the Wall Street Journal’s Jon Hilsenrath over the weekend, although “the timing on when to start is still being debated” it adds.

Hilsenrath – whom some fellow journalists have dubbed ‘Fedwire’ on account of a supposed closeness to the Fed – also filed a piece profiling current Fed vice chair Janet Yellen, describing her as a “top contender” to succeed Ben Bernanke as chair.

In a speech earlier this year Yellen said the US faces “a long road back to a healthy job market” and that Fed policymakers are “actively engaged in continuing efforts to promote a stronger economy, more jobs, and better conditions for all workers”.

The so-called speculative net long position of Comex gold futures and options traders – calculated as the difference between ‘bullish’ long and ‘bearish’ short contracts held by noncommercial traders – fell to its lowest reported level since November 2008 last Tuesday, equivalent to 245.3 tonnes, according to weekly data published Friday by the Commodity Futures Trading Commission.

“Underlying moves, while not particularly violent, were bearish,” says a note from Standard Bank.

“Speculative shorts saw 11.8 tonnes added, while 10.7 tonnes in long positions were unwound.”

The Dollar value of India’s trade deficit rose to $17.8 billion last month, up from $10.3 billion in March and $14.0 billion in April 2012, according to government data published Monday. Imports of gold bullion into India, traditionally the world’s biggest gold buying nation, jumped 138% in April as the gold price fell sharply.

Bullion imports have stayed strong this month, according to reports, ahead of today’s Akshaya Tritiya festival as well as proposed import restrictions from the central bank, which were confirmed today.

The Reserve Bank of India confirmed Monday it will implement its proposed restrictions on banks importing gold on a consignment basis, whereby bullion is shipped but ownership remains with the supplier.

“To moderate the demand for gold for domestic use, it has been decided to restrict the import of gold on consignment basis by banks, only to meet the genuine needs of exporters of gold jewelry,” said a statement from the central bank.

“The country’s overall gold imports will be hurt [by these restrictions],” says Ashwini Kapoor, general manager of the precious metals division at state-run refiner MMTC.

“Volumes will fall by 50% in the current fiscal year.”

Over in Europe, German finance minister Wolfgang Schaeuble said Monday that Slovenia “can manage” without a bailout.

Ben Traynor

BullionVault

Gold value calculator   |   Buy gold online at live prices


Editor of Gold News, the analysis and investment research site from world-leading gold ownership service BullionVault, Ben Traynor was formerly editor of the Fleet Street Letter, the UK’s longest-running investment letter. A Cambridge economics graduate, he is a professional writer and editor with a specialist interest in monetary economics. Ben can be found on Google+


(c) BullionVault 2013

Please Note: This article is to inform your thinking, not lead it. Only you can decide the best place for your money, and any decision you make will put your money at risk. Information or data included here may have already been overtaken by events – and must be verified elsewhere – should you choose to act on it.


G7 reaffirms commitment on exchange rates

By HY Markets Forex Blog

The Japanese yen has weakened for the fourth time in a row after the G7 meeting held over the weekend .The G7 gave the go ahead to Japanese monetary policies and had no censure on Japan’s money printing policies.

An agreement of a collection action against tax evasion and avoidance was also raised in the G7 meeting by Germany, Britain and other countries involved.

Other topics and developments that were addressed in the meeting were the probability of the eurozone crises was no longer a risk for the economy according to the German Finance minister “Woldgang Scheaeuble “.

The President for European Central Bank also addressed the meeting saying the G7 countries did not reach out to the central banks to boost the economy.

As the yen continuous to weaken the shares in Japan increases to the highest levels in more than five years   .

Other market industries in Asia are forced to trade at a lower rate after economic reports from china on production and retail sales came in line with estimates.

According to the bank governors and finance representatives that were present at the G7 meeting; after analyzing and testing the Japanese strategy, they concluded they will monitor its impact on currencies.

Among the top industries in Japan ,Nissan Motor increased by 5.1% after forecasting a 22% increase in profits for the current business year while Sharp increased by 10.67% after Nikkei newspaper planned to downsize its operations in Europe according to reports .

The post G7 reaffirms commitment on exchange rates appeared first on | HY Markets Official blog.

Article provided by HY Markets Forex Blog