Iceland holds rate, cuts GDP forecast, takes active FX role

By www.CentralBankNews.info     Iceland’s central bank held its benchmark seven-day lending rate steady at 6.0 percent, saying “inflation is expected to reach the inflation target earlier than previously expected, with weaker output growth and a stronger krona offsetting larger wage increases and weaker productivity growth.”
    However, the Central Bank of Iceland said uncertainty about the krona’s exchange rate could contribute to more persistent inflation expectations so it will be taking a more active role in the foreign exchange market to reduce fluctuations in the krona from its recent levels.
    “Foreign exchange mismatches in financial institutions’ balance sheets have been reduced recently, and the exchange rate of the krona has been close to a level that, other things being equal, could be considered sufficient to bring inflation back to target in the near term,” the central bank said.
    In its latest monthly bulletin, the central bank reduced its growth forecast for this year and the following years from its previous forecast from February due to lower-than-expected investment.
    The central bank, which has held rates steady this year after raising them by 125 basis points in 2012,   said inflation was now closer to the bank’s 2.5 percent target since 2011 and a more active role in the foreign exchange market should “facilitate speedier adjustment of the domestic price level to a stronger krona and to reduce inflation expectations.”

    “In that case, the inflation target could conceivably be reached earlier than forecast, although this depends on other factors as well,” the central bank said.
     This year the Icelandic krona has appreciated over 10 percent against the dollar, partly in response to central bank intervention that helped dent expectations of continued depreciation. In early May, the krona hit a high of around 116 to the U.S. dollar. Since then it has dropped almost 6 percent and was quoted at 122.8 to the dollar earlier today.

    Prior to the global financial crises, the krona was roughly twice as strong,  trading around 60 to the dollar. Early in the crises, Iceland’s three largest banks collapsed in 2008 and currency controls were imposed to protect the krona after it plunged in mid-2008.

    The drop in the krona pushed up inflation to almost 20 percent in early 2009 but it gradually eased before accelerating in late 2011 to almost 7 percent and the central bank responded by raising interest rates.  Since January 2012 inflation has been steadily declining and hit 3.3 percent in April from 3.9 percent in March, but he central bank cautioned that inflation expectations had recently risen.
    The central bank expects inflation to hit its target in the first half of 2014, slightly earlier than previously forecast due to a stronger krona.

   The imposition of capital controls has locked some $8 billion worth of krona owned by offshore investors in Iceland, threatening to create a bubble in the equity market, and the next government is planning to allow Icelanders to invest outside the country.

    But before currency and capital controls are lifted, the central bank said it would have to review its intervention policy, along with the state of fiscal policy and consider whether wage settlements are consistent with the inflation target.
    “Before decisive steps are taken to lift controls on capital outflows, it will be necessary to re-evaluate this policy,” the bank said, adding this would also apply to any changes in the monetary policy framework.
    The central bank, which considers its current policy stance accommodative, said the margin of spare capacity in the economy continues to narrow despite a slowdown in the pace of economic recovery.
    “It is still the case that as spare capacity disappears from the economy, it is necessary that slack in monetary policy should disappear as well,” the bank said, adding the speed of a normalisation of its policy hinges on inflation, wages, the exchange rate, fiscal policy and factor that affect demand.
     In line with weaker global growth, the central bank said output has slowed and terms of trade had deteriorated and in “2013 and throughout the forecast horizon, the outlook is for output growth to be somewhat weaker than the Bank projected in February.”
    Iceland’s economy has recovered strongly following the global financial crises and growth of 1.6 percent in 2012 of was among the strongest in developed countries.
    In its latest monetary bulletin that was released today, the central bank said first quarter 2013 Gross Domestic Product growth is estimated at 0.3 percent quarter-on-quarter and 1.5 percent year-on-year, but then the pace is expected to ease in the second half of the year.
    For 2013 the growth forecast is trimmed to 1.8 percent, down from the February forecast of 2.1 percent, due to much weaker investment than expected.
    The outlook for growth in 2014 and 2015 has also been revised downward from February. Growth next year is now forecast at 3.0 percent, down from 3.7 percent, and 2015 growth is now forecast at 3.5 percent from a previous 3.9 percent, due to slower growth in domestic demand.

    www.CentralBankNews.info
       

Precious Metals Hit 3-Week Lows, ETFs “Could Sell Another 250 Tonnes of Gold”

London Gold Market Report
from Ben Traynor
BullionVault
Wednesday 15 May 2013, 08:15 EDT

WHOLESALE gold bullion prices fell to three week lows around $1410 an ounce Wednesday, as European stock markets ticked higher, reversing earlier losses following disappointing Eurozone growth data.

Gold in Euros fell as low as €1094 an ounce, while gold in Sterling fell below £930 an ounce.

“Gold spot is approaching the support [level] of $1403 [an ounce],” say technical analysts at Societe Generale.

“There is no significant level of support between here and the low from April 16 in the $1322 area,” adds the latest technical analysis from Scotia Mocatta.

The world’s biggest gold exchange traded fund SPDR Gold Trust (ticker: GLD) could lose up to a further four million ounces (almost 125 tonnes) to add to the nearly 300 tonnes it has lost through redemptions since the start of the year, according to analysts at Deutsche Bank.

“We expect that the bulk of the drawdown comes from institutional investors rather than retail investors,” says a report from Deutsche.

“If in fact only institutional selling is occurring in the gold E.T.F. then we expect that nearly two-thirds of the selling that is likely has probably already passed. As SPDR is roughly half of total physically backed E.T.F.s, this could imply a further 4 to 8 million ounces [approx. 125 to 250 tonnes] selling [from all gold E.T.F.s] if macro fundamentals continue to move against gold.”

“In the short term, gold prices remain caught between the recent slowdown in US activity and the significant decline in ETF holdings,” adds a note from Goldman Sachs, whose analysts have a 12-month gold forecast of $1390 an ounce.

“While the sell-off in gold prices has been faster than we expected, with prices below our near-term forecasts, further unwind of ETF positions would likely continue to precipitate this decline…going forward, we expect that gold prices will continue to decline should our economists’ forecast for a reacceleration in US growth later this year prove correct.”

“Gold is likely to remain sensitive to potential dialog regarding the Fed’s QE intentions,” adds a note from HSBC, referring to the US Federal Reserve’s ongoing $85 billion a month quantitative easing policy.

“Further comments by Fed members for scaling back QE would be negative for bullion prices.”

Silver meantime fell to around $23 an ou8nce this morning, like gold hitting a three-week low, as other commodities also dipped and US Treasury bonds gained.

On the currency markets, the Euro fell to a six-week low against the Dollar Wednesday, while the Yen touched a fresh four-and-a-half year low, as Japan’s Nikkei 225 index breached 15,000 for the first time in over five years.

Over in Europe, France fell back into recession in the first quarter, according to provisional GDP data published Wednesday that show a second successive quarter of negative growth. German Q1 growth meantime was 0.1%, provisional figures show, less than the consensus forecast among analysts. GDP for the Eurozone as a whole contracted 0.2% in Q1, data published this morning show, to make a 1% year-on-year drop in economic output.

Ratings agency Fitch meantime upgraded its credit rating for Greece Tuesday, citing progress on cutting the government budget deficit, although Fitch still rates Greek government bonds as junk with a rating of B-.

The latest Bank of England Quarterly Inflation report, published this morning, shows a “welcome change in the economic outlook”, according to outgoing governor Mervyn King.

“Today’s projections are for growth to be a little stronger and inflation a little weaker than we expected three months ago,” King told reporters this morning.

“That is the first time I have been able to say that since before the financial crisis.”

King added however that “the challenges facing central bankers are as great as they have ever been”.

Ben Traynor

BullionVault

Gold value calculator   |   Buy gold online at live prices


Editor of Gold News, the analysis and investment research site from world-leading gold ownership service BullionVault, Ben Traynor was formerly editor of the Fleet Street Letter, the UK’s longest-running investment letter. A Cambridge economics graduate, he is a professional writer and editor with a specialist interest in monetary economics. Ben can be found on Google+


(c) BullionVault 2013

Please Note: This article is to inform your thinking, not lead it. Only you can decide the best place for your money, and any decision you make will put your money at risk. Information or data included here may have already been overtaken by events – and must be verified elsewhere – should you choose to act on it.


The French Economy falls into recession

By HY Markets Forex Blog

The French economy has slipped into recession in the first quarter of the year after shrinking by 0.2 %.

France still struggles with the high record of unemployment and controlling public finances.

Unlike countries in the wider euro zone, France managed to escape falling into recession since 2008 – 2009. French President François Hollande is already facing the pressure of reviving the growth in the economy.According to the European commission forecast released earlier this month  , Euro- are GDP will drop 0.4 % this year after 0.6 percent declined in 2012 .


As the second largest country in the eurozone, it is very likely for the recession to stir up problems around the region.

CSA carried out a survey around April to find out French people’s opinion on how they thought he would succeed in improving the economy. Out of approximately 1,000 people that took part in the survey, only 11% believed Mr. Hollande would succeed in decreasing the high rate of unemployment by the end of the year.

According to reports, currently the German economy stands as the strongest in the eurozone which grew by 0.1% in the first quarter of the year.

Reports from the statistics office also show the Germen economy had shrunk within a year by 1.4%.

The European Commission did predict that France would fall into recession later this year earlier this month.

The post The French Economy falls into recession appeared first on | HY Markets Official blog.

Article provided by HY Markets Forex Blog

STOP PRESS…Resource Stocks Pay Dividends Too

By MoneyMorning.com.au

In the global quest for yield, it seems as though investors have labelled the whole resource space as ‘growth stocks’, and left them on the shelf.

Yet a quick scan through mining stocks shows resource stocks pay dividends too.

Some of them yield as much as 7%, 9%, or even 11%…

The Reserve Bank of Australia’s (RBA) interest rate cut to 2.75% last week took us to a historically low rate. Anyone funding their lifestyle from interest is going to find things harder than ever. Falling rates have forced investors into riskier assets in the search for yield.

We’ve seen this in the financial stocks, with the XFJ index exploding 45% in a year.

And we’ve seen it in industrials too. Smaller players have done very well. Veterinary business Greencross (ASX: GXL) has increased ten-fold!

But one place we haven’t seen yield-hunting is in resource stocks. There are a few hidden gems in the sector, and I expect it’s just time before the yield hunting army find them.

And it isn’t just Australian investors looking for yield on our market; it’s investors worldwide.

Rate Cuts Are a Global Trend

Since the start of the GFC, the Federal Reserve has slashed rates from 5.25% to 0.25%, and the European Central Bank (ECB) has dropped from 4.25% to 0.5%.

Everyone has been at it. In fact Bloomberg just reported that globally central banks have now made 511 rate cuts in this cutting cycle! There’s no end in sight, so investing in yield stocks looks like a good trade for the foreseeable future.

And like I said, there is plenty on offer in the resource space to tick that box.

One of my current stock tips is on a 5.5% fully franked yield at the current price. It also has a pretty robust track record. A yield is good, but a reasonably steady yield is even better.

Resource Stocks Pay Dividends Too!


Source: sharedividends.com

There are a few things I look for in spotting resource stocks that will do well.

Cash is a big part of my analysis.

Do they have enough, do they need more, and do they have enough to pay dividends with?

The market is prepared to pay for stocks with cash flow, on the promise of dividends in the future.

And the market is prepared to pay even more for those that are actually paying dividends.

Buying by yield hunters should support the price of these stocks. But the rally that just started with the best week for resources in four years will also help.

The big-cap resource stocks are paying yields in the 2% range these days.

If you want the bigger dividends…you have to go smaller. Here are a few examples of what is available out there.

One company, Imdex (ASX: IMD)provides ‘drilling fluid products, advanced down hole instrumentation, data solutions and geo-analytics services to exploration, development and production companies in the minerals and oil and gas sectors worldwide.’

It’s a fact that some of the companies that profited most from the Australian gold rush were those who sold picks and shovels to the miners. Likewise, companies servicing the more recent mining boom did very well.

However, like most other mining services companies, Imdex has seen its share price tumble as the resource sector cooled in the last few years.

A lower price means a better yield. The result is a yield now around 7.2%, and the company has a pretty good track record of paying up. If resources stocks recover, then mining services companies are a leverage play on that.

But if you want a bigger yield than 7.2%, then you can’t look past the gold stocks.

A Different View on Resource Stocks

One point Eric Sprott made when we chatted off camera in Hong Kong recently was that if gold stocks want to see their valuations rise, then they have to pay stronger dividends.

It’s true that they have had a poor track record in this department. However since gold’s historic smash, most gold stocks’ yield has risen. Even big-cap US gold producer Newmont (NYSE:NEM) is up to a yield of 4.3%.

There are a few Aussie goldies that stand to yield more today than a few months back. Kingsgate (ASX: KCN) is the leader of the field, now on a yield of 9.0%. They’ve been paying a dividend for most of the last decade through gold’s ups and downs. It may be harder for them to maintain the tradition this year. We’ll see.

But that’s not the biggest yield. Grange Resources (ASX: GRR) may have a chart like a falling stone, but it has been paying a few years of dividends now; at the current price, Grange’s yield clocks in at 11.4%.

Looking at dividend yield alone is just one step of many in researching a stock, so never invest on yield alone. In fact, if you want the biggest gains in the resource sector, the best time to invest is long before the stock pays a dividend.

But my point is this.

The central bank rate cuts ensure a flood of money is seeking yield.

There are many good-quality, dividend-paying resource stocks. So it’s inevitable that some of that cash will find its way into resource stocks that offer investors the yield they want. But for resource companies, the best gains will still come from capital growth in companies developing high grade projects.

Join me on Google+
Diggers and Drillers:
Why You Should Invest in Junior Mining Stocks

Ed Note: It’s not just banks and industrial stocks that pay dividends. A handful of mining stocks pay cash back to investors too. In today’s Money Morning Premium, Kris highlights one Aussie resource kingpin that’s trading with one of the best dividend yield’s it has seen in over ten years. Unless you think the resource sector is about to collapse, this is one to keep an eye on. Click here to upgrade now.

From the Port Phillip Publishing Library

Special Report: IT’S A TRAP

Daily Reckoning: New Australian Home Buyers Aren’t Convinced

Money Morning: ‘Best Week in Four Years’: Resource Stocks are Starting to Move…

Pursuit of Happiness: Don’t Take Financial Advice from a Lawyer

Dr Alex Cowie
Editor, Diggers & Drillers

The Next Move in the Currency War

By MoneyMorning.com.au

In the world of central banking, the gloves are coming off. You can blame the Japanese.

At the G7 meeting, everyone smiled politely and said that they completely understood why the Japanese were printing unprecedented amounts of money and hammering the yen.

The main reason they gave Japan a free pass is because lots of other countries are hoping to get away with doing the same.

Central banks overseeing around a quarter of the world’s GDP have cut rates this month alone, notes Bloomberg.

The currency wars are just getting started…

The Bank of Israel Joins the Currency War

The Bank of Israel has become the latest central bank to cut interest rates. The bank cut the key interest rate by a quarter of a percentage point to 1.5%. That’s a three-year low.

What was unusual is that the rate cut came outside of an official bank meeting. That meant it surprised the market, which sent the shekel down and Israeli stocks higher.

So why did they do it? Bank governor Stanley Fischer threw out a variety of excuses.

He told Bloomberg that the move came ‘in light of the continued appreciation of the shekel, taking into account the start of natural gas production from the Tamar gas field, interest rate reductions by many central banks – notably the European Central Bank, the quantitative easing in major economies worldwide and the downward revision in global growth forecasts.’

But clearly it boils down to this: if everyone else is going to print money, slash rates, and hammer their currency, then we’ve got to join in.

As Bloomberg points out, the shekel has risen by nearly 9% over the past six months. It’s one of the best-performing currencies in the world, after the Mexican peso.

Trouble is, ‘exports make up about 40% of Israel’s economy.‘ That means the Israeli economy really won’t like a rising currency. It doesn’t help that sales of natural gas will turn the shekel into a form of ‘petrocurrency’.

So the central bank also plans to buy around $2.1bn in foreign currencies (selling the shekel to do so), to offset the impact of natural gas exports.

That all sounds quite sensible. But there’s a flipside to cutting interest rates.

You see, we’ve all become really quite blasé about rate cuts. There seem to be no consequences these days (well, beyond surging stock markets at least). Much of the world has been in such a deep hole that it was hard to see whether or not all that money-printing and rate-slashing was having an impact.

But in Israel, the trade-off is more visible. The country already has a very buoyant property market, with prices up by around a fifth since 2010. Back in November, the central bank set restrictions on the amount buyers could borrow to purchase a house. First time buyers need at least a 25% deposit.

It’s hardly ideal to have your central bank trying to control a bubble with one hand while stoking the fire with the other.

The Currency War Will Not Stop Anytime Soon

It also reveals just how much power central banks have. Politicians have virtually ceded responsibility for their economies to the central bankers.

The politicians may fiddle with the national balance sheets: tweaking a regulation here and there, diverting handouts from one special interest group to more politically-friendly ones. But overall, the burden of returning economies to growth is falling on central banks.

This is nice for politicians, in that they can blame central bank policy if things go wrong. But it does not sit well with the central banks’ role as the ‘guardian’ of a nation’s currency. After all, the only real lever they have to pull to boost growth is to cut interest rates.

And with Japan’s experiment apparently working so well – in that stocks have rocketed – the pressure on central banks to follow suit will only continue.

What does it mean for your money? Well, we’d expect the flood of money from central banks to continue.

As for the US, in a world where everyone is printing money, it’s going to be hard for Ben Bernanke to keep devaluing the dollar. Everyone is getting excited about the idea that the Federal Reserve might rein in quantitative easing (QE). That seems unlikely to us.

But even if QE is simply maintained at current levels, that’s not going to look that impressive if the rest of the world’s central banks are competing to do various ‘shock and awe’ currency debasement schemes. So we reckon the US dollar is the currency most likely to benefit from this ‘race to the bottom’ for now.

John Stepek
Contributing Editor, Money Morning

Join Money Morning on Google+

From the Archives…

Why Small-Cap Resource Stocks Beat Blue Chips Hands Down
10-05-2013 – Dr Alex Cowie

Can Australian Stocks Defy Gravity if The Australian Dollar Falls?
9-05-2013 – Murray Dawes

Build Wealth Fast through the Resource Sector
8-05-2013 – Dr Alex Cowie

36% Potential Upside for Australian Stocks Over the Next Two Years
7-05-2013 – Kris Sayce

The Key to Becoming a Successful Investor
6-05-2013 – Kris Sayce

There’s Going to Be a Bull Market in Technology Metals

By MoneyMorning.com.au

Not long ago I was in Toronto for a couple of days for a conference on what people in the resource space call ‘Technology Metals‘. These are critical elements that go into all manner of advanced materials, electronics, optics and more.

Without technology metals, most modern technological systems won’t work like the builders advertise and users desire.

In a global economic sense, all sorts of people and companies produce all manner of technology metals. Technology metals are key to many supply chains, such as high-priority military technology.

For example, Boeing builds airplanes. Much of the structure and skin of airplanes is made of aluminium. So Boeing buys aluminium from, say, Alcoa, which in turn has a chain of processing facilities, smelters and ore in the ground at mine sites, located in faraway corners of the world.

Or Boeing buys jet engines from, say General Electric. GE has all manner of suppliers who build parts and components for those engines. The suppliers, in turn, have their own supply chains, including for exotic, high-strength metals like titanium.

Eventually, when you trace the flow for titanium, you’ll find an ilmenite deposit in the rocks of, perhaps, Quebec, or a sandy beach in Australia.

That’s where rare earths (RE) come in. Rare Earth’s (RE) are a set of elements that are critical to the design and manufacture of futuristic high-tech weapons and systems, especially energy weapons like lasers and rail guns.

The fact is, however, that many important global supply chains these days are dominated by producers whose first language is Mandarin. About 95% of the world’s rare earths (RE) come out of China. That’s a serious issue, in terms of security of supply.

Looking ahead, it’s crucial to the US military – and to the defence side of Canada, other NATO nations, Japan, South Korea, Australia and other allied nations – to secure critical elements up and down the technology food chain. In other words, the strategic industrial challenge for the West is to bring new RE suppliers into the field and ultimately develop its own sources of RE.

The Rare Earth Essentials

But first, we need to understand what RE are, what they do and why it matters when you can’t get them. It’s a matter of chemistry. RE are the Lanthanide Series of elements on the Periodic Table.


Lanthanide Series, circled, highlighting rare earths.

Lanthanide elements have unique chemical and physical properties, which lead to all manner of technological miracles. For example, you need cerium for glass polishing, which is crucial to top quality optics.

Neodymium and dysprosium are essential to strong permanent magnets, which go into powerful motors. Erbium and terbium are important phosphors for lighting systems. Yttrium is critical to high-temperature metal casting. And there’s more.

The very exotic, poorly understood element scandium (Sc) improves structural strength in aluminium by literally orders of magnitude.

Adding about .2% (by weight) of scandium, to aluminium, will dramatically improve the alloy’s strength, flexibility, resistance to corrosion and the ability to weld the metal, versus using rivets. (It’s almost impossible to break the wings of certain Russian fighter planes – the MiG-29 comes to mind – because of the Sc-Al alloys in the wing spars.)

The Way to Star Trek Technology

If you want to manufacture exotic metals, powerful electric motors, complex electric power systems, super-strong magnets, advanced optics, advanced electronics and all manner of other gee-whiz things, you land squarely in the Rare Earth and materials space. If you don’t have RE, you just can’t get there from here.

That’s good news for investors. But the biggest challenge everyone in the West seems to face is that in many respects, we don’t really know what we don’t know about many of the Rare Earth elements, because so few people do research and development (R&D) with these forms of matter.

Tom Wolfe’s great book about the early days of the US space program, The Right Stuff describes our current situation rather well.

At one point, Wolfe was discussing the importance of funding for R&D, and described a get-together between the original seven Project Mercury astronauts and members of the Mercury space capsule design team. The astronauts wanted a window in the capsule, along with an emergency exit door and flight controls. The designers balked.

Then astronaut Gordon Cooper said, ‘Do you boys know what makes this bird go up? Funding makes this bird go up.

The designers stared at Cooper. You could tell that they wanted to argue fine points of physics, rocketry and structures. Besides, they were the designers, and didn’t want to be bossed around by a bunch of jet-jockey pilots.

Then astronaut Gus Grissom chimed in, saying ‘He’s right. No bucks, no Buck Rogers.’ (There’s a fabulous depiction of this encounter in the movie version of the book.)

The point is: technology has a cost. You can accomplish much if you have both time and funding. But at the edge of the technical envelope, nothing is easy. There are only many hard, expensive choices.

Yet in spite of these challenges, The US Department of Defence has made stunning progress on electromagnetic rail guns, as well as laser systems.

Electromagnetic rail guns, for example, use magnetic force to hurl projectiles downrange. In the olden days – like, for about the past 500 years – people used gunpowder to shoot cannonballs, shells, bullets and the like. Looking ahead, much of that chemical propellant is going away, replaced by what physicists call Lorentz Forces.

But rail guns require complex power generation and management systems. That means powerful motors, complex generators, electrical storage in batteries and capacitors, control electronics, optics and all manner of other components. I see Rare Earth up and down this supply chain.

Or consider lasers. Right away, we’re talking about neodymium-doped optical glass, as well as numerous other phosphors. Then there are power systems, storage media (batteries and capacitors), electronics, aiming systems and much more.

All in all, we’re looking at the transformation of military tech by super-advanced materials and electronics, optics and more.

What You Must Know for Rare Earth Plays in High-Tech and More

If you’re going to buy into Rare Earth, go gently and spread your funds around. Don’t ‘back up the truck’, as the saying goes. Bid patiently, with strict limits near the recent plateaus. If you start buying with bushel baskets, you’ll just kick up the volume, invite a frenzy, and the day traders will eventually nick you down, penny by penny.

You need to understand that the Rare Earth space is fluid, and fraught with risks. Right now, most money managers, institutions, funds, brokers and many investors don’t just hate the Rare Earth space, they loathe it because of past losses.

Then again, most of the trading houses never really understood Rare Earth, and don’t particularly understand what’s happening right now in the space. Their experience comes from a few years ago, when we had a Rare Earth boom that morphed into a bubble, which has popped.

Along the way, during the bubble blow-up, many investors and management teams thought they were geniuses, and that this RE stuff was kind of a piece of cake.

Well, experience is a hard teacher. Now, in the wake of the Rare Earth share price crash, we have a number of companies that are much better today than about two years ago, yet the share prices are a small fraction of what they used to be.

That is, today we have smarter management. We have better-understood mine and mineral assets. We have better chemistry and metallurgical flow sheets. The downstream market relationships are forming up for RE suppliers. Yet nobody wants to buy the shares.

Thus, for tech investors, this seems to be a reasonable time for bottom fishing, although you have to know that even this market bottom still may have sub-sub-sub-basements.

Byron King
Contributing Editor, Money Morning

Join Money Morning on Google+

From the Archives…

Why Small-Cap Resource Stocks Beat Blue Chips Hands Down
10-05-2013 – Dr Alex Cowie

Can Australian Stocks Defy Gravity if The Australian Dollar Falls?
9-05-2013 – Murray Dawes

Build Wealth Fast through the Resource Sector
8-05-2013 – Dr Alex Cowie

36% Potential Upside for Australian Stocks Over the Next Two Years
7-05-2013 – Kris Sayce

The Key to Becoming a Successful Investor
6-05-2013 – Kris Sayce

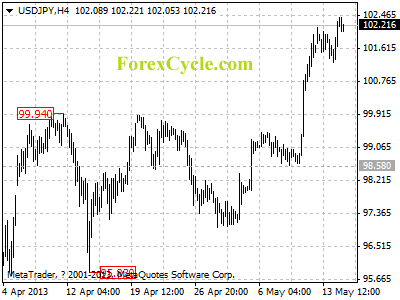
USDJPY continues its upward movement from 98.58

USDJPY continues its upward movement from 98.58, and the rise extends to as high as 102.42. Support is at 101.20, as long as this level holds, the uptrend could be expected to continue, and next target would be at 104.00 area. On the downside, a breakdown below 101.20 will suggest that consolidation of the uptrend is underway, then pullback to 100.00 area could be seen.

usdjpy

Forex Signals

How to Spot & Time Stock Market Tops

By Chris Vermeulen, thegoldandoilguy.com

Since the middle of April everyone and including their grandmother seems to have been building a short position in the equities market and we know picking tops or bottoms fighting the major underlying trend is risky business but most individuals cannot resist.

The rush one gets trying to pick a major top or bottom is flat out exciting and that is what makes it so darn addicting and irresistible. If you have ever nailed a market top or bottom then you know just how much money can be made. That one big win naturally draws you back to keep doing it much like how a casino works. The chemicals released in the brain during these extremely exciting times are strong enough that even the most focused traders fall victim to breaking rules and trying these type of bets/trades.

So if are going to try to pick a top you better be sure the charts and odds are leaning in your favor as much as possible before starting to build a position.

Below are a few charts with my analysis and thoughts overlaid showing you some of the things I look at when thinking about a counter trend trade like picking a top within a bull market.

Utility Stocks vs SP500 Index Daily Performance Chart:

The SPY and XLU performance chart below clearly shows how the majority of traders move out of the slow moving defensive stocks (utilities – XLU) and starts to put their money into more risky stocks. This helps boost the broad market. I see the same thing in bonds and gold this month which is a sign that a market top is nearing.

That being said when a market tops it is generally a process which takes time. Most traders think tops area  one day event but most of the times it takes weeks to unfold as the upward momentum slows and the big smart money players slowly hand off their long positions to the greedy emotion drove traders.

Look at the chart below and notice the first red box during September and October. As you can see it took nearly 6 weeks for that top to form before actually falling off. That same thing could easily happen again this time, though I do feel it will be more violent this time around.

SPYXLU


SPY ETF Trading Chart Shows Instability and Resistance:

Using simple trend line analysis we see the equities market is trading at resistance and sideways or lower prices are more likely in the next week or two.

SPYResistance


Stocks Trading Above 150 Day Moving Average Chart:

This chart because it’s based on a very long term moving average (150sma) is a slow mover and does not work well for timing traded. But with that said it does clearly warn you when stocks are getting a little overpriced and sellers could start at any time.

General rule is not to invest money on the long side when this chart is above the 75% level. Rather wait for a pullback below it.

BarC150


Stocks Trading Above 20 Day Moving Average Chart:

This chart is based on the 20 day moving average which moves quickly. Because it reacts quicker to recent price action it can be a great help in timing an entry point for a market top or bottom. It does not pin point the day/top it does give you a one or two week window of when price should start to correct.

BarC20


How to Spot and Time Stock Market Tops Conclusion:

As we all know or will soon find out, trading is one of the toughest businesses or and one of the most expensive hobbies that one will try to master. Hence the 95-99% failure rate of individuals who try to understand how the market functions, position management, how to control their own emotions and to create/follow a winning strategy.

With over 8000 public traded stocks, exchange traded funds, options, bonds, commodities, futures, forex, currencies etc… to pick from its easy to get overwhelmed and just start doing more or less random trades without a proven, documented rule based strategy. This type of trading results in frustration, loss of money and the eventual closure of a trading account. During this process most individuals will also lose friends, family and in many cased self-confidence.

So the next time you think about betting against the trend to pick a top or a bottom you better make darn sure you have waited well beyond the first day you feel like the market is topping out. Stocks trading over the 150 and 20 day moving averages should be in the upper reversal zones and money should be flowing out of bonds and other safe haven/defensive stocks to fuel the last rally/surge higher in the broad market.

Also I would like to note that I do follow the index futures and volume very closely on both the intraday and daily charts. This is where the big money does a lot of trading. Knowing when futures contracts are being sold or bought with heavy volume is very important data in helping time tops and bottoms more accurately. And the more experience you have in trading also plays a large part in your success in trading tops and bottoms.

Download my FREE eBook on Controlling Your Trades, Money & Emotions: http://www.thegoldandoilguy.com/trade-money-emotions.php

Chris Vermeulen


Pound Was Being Sold Yesterday, Attempts to Buy Yen

Pound Was Being Sold Yesterday, Attempts to Buy Yen


EURUSD – The EURUSD Trading in a Narrow Range

eurusd14.05.2013

The market makers seems to gradually lose their desire to do something with the approach of summer, and this is reflected in the currencies’ behavior. Thus, yesterday’s trading day was dull and not interesting regarding the EURUSD, which was sluggishly fluctuating within the 1.2942 and 1.2999 levels. Only during the Asian session, there was a weird hike to 1.3025, which did not continue. Therefore, it is not necessary to talk about any changes in the overall picture, the pair is still subject to the risk of decreasing to 1.2880, and only its growth and ability to consolidate above 1.3080 would improve its future prospects.


GBPUSD – The GBPUSD Dropped Below Figure 53

gbpusd14.05.2013

Despite the market calm that surrounded the GBPUSD yesterday, the market participants still showed some activity that aimed at selling the British pound against the dollar and in the cross-rates as well. As a result, the GBPUSD, having denoted the high of the day at 1.5384, dropped below the 53rd figure. However, having tested the 1.5279 level, the pair managed to recover to 1.5330. Though yesterday’s drop was hardly a confident breakdown of the 53rd figure, the attitude towards the British currency leaves much to be desired, and the GBPUSD pair may test the 1.5200 level in the short term.


USDCHF – The USDCHF Fails to Consolidate Above 0.9555

usdchf14.05.2013

The USDCHF was consolidating within the 0.9595 and 0.9546 levels during the whole day yesterday. During the Asian session, the pair dropped to 0.9520. In general, it does not change anything for the current upward momentum of the dollar, but ideally, it would be very nice if it manges to hold above 0.9555. But the bullish positive sentiment still remains there, and the dollar may test the 0.9666 resistance. The drop below the 94th figure will make adjustments to the pair’s outlook.


USDJPY – The USDJPY May Test 100.00

usdjpy14.05.2013

The USDJPY pair’s state of being overbought is evident, since the bulls’ enthusiasm near the 102nd figure has been subsided. After several unsuccessful attempts to consolidate above this level, the bulls were forced to retreat, and as a result the rate dropped to 101.27. Of course, until there are convincing signs of the high formation, it is not necessary to talk about the end of the upward trend, but given the magnitude of the growth and its state of being overbought, the pair’s further increase may face certain difficulties. It is possible that, before it resumes the upward movement, the dollar will test the 100.00 level, acting as the support this time.


provided by IAFT