The Recovery That Never Happened…

By Bill Bonner

Gold seemed to be stabilizing at the end of last week. Commodities
remained weak. Steel has fallen 31% this year. Brent crude is off 17%
since early February. And copper is down 15%.

Copper is the metal you need to make almost anything – houses, cars,
electronics. When it goes down, it generally means the world economy is
getting soft.

At the start of last week, the conventional analysis of the gold
sell-off was that the central banks’ efforts to revive global growth
were working. The feds had the situation under control. So who needed
gold?

By the end of the week, it appeared that gold – and commodities – had sold off for the opposite reason: because central banks’ money printing wasn’t working and the world was slipping further into a period of slow growth and barely contained depression. From Business Insider:

Recent U.S. economic data has been
disappointing, especially in the realm of housing, which is what the US
bull case is all about.

In Germany, dubbed the strong arm of Europe, economic sentiment just fell.

Where’s the Growth?

And growth has begun to slow in China – still considered a global
growth engine – as it continues to crack down on corruption, a property
bubble and a bloated shadow banking business. China’s plan to shift its
economic model away from exports to domestic demand-led growth has also
contributed to the lower growth rate.

In the US, building permits are down… and foreclosures are up.
There is no renaissance happening in manufacturing. Only half of the new
jobs expected showed up in March. Retail sales are down, and consumer
confidence is off.

And in Britain, the unemployment rate is rising. Retail sales are
falling. And figures coming out this week will probably tell us that the
country is in a triple-dip recession.

Here’s Ambrose Evans-Pritchard in The Telegraph:

It is becoming ever clearer that the roaring boom in global equities since last summer has priced in an economic recovery that does not in fact exist.
The International Monetary Fund has had to nurse down its global growth
forecasts yet again. We are still stuck in an old-fashioned trade
depression, with pervasive overcapacity in manufacturing plant and a
record global savings rate of 25% of GDP…

As you can see from the chart below,
the divergence between stock markets and the Deutsche Bank index of raw
materials is astonishing to behold, so like the pattern in early 1929…

S7P 500 vs. Deutsche Bank commodity index

The US economy is growing below the
Fed’s own “stall speed” indicator. Half a million people fell out of the
workforce in March. Retail sales fell in March. So did manufacturing…

“There is a threat of deflation almost everywhere. A lot of central banks will have to follow the Bank of Japan, whatever they say now,” said Lars Christensen from Danske Bank.

The era of money printing is young yet. Gold will have its day again.

Regards,

Bill Bonner

Bill

To learn more about Bill visit his Google+ Page or Bill Bonner’s Diary


Gold’s Action “Dominated by Retail Buying” But Bullion “Not Trading as Safe Haven”

London Gold Market Report
from Ben Traynor
BullionVault
Monday 22 April 2013, 07:30 EST

WHOLESALE gold prices rose back above $1430 per ounce Monday morning for the first time since last Monday’s price drop, amid reports of strong buying in Asia, while stocks gained and US Treasuries fell.

Silver meantime ticked higher above $23.60 an ounce, though remained below Friday’s high, while other commodities also gained with the exception of copper.

Last week’s upturn in physical gold buying in Asia continued over the weekend according to some local press reports, with the South China Morning Post reporting “a rush of buyers” in Hong Kong.

Gold exchange traded funds by contrast continued to see outflows towards the end of last week.

“It remains to be seen which of these offsetting forces eventually wins out and exerts its influence over gold prices,” says Ed Meir, metals analyst at brokerage INTL FCStone.

“Our guess is that the sharp bounce in retail buying will likely dominate and succeed in sending prices higher over the course of the next week or two.”

“Gold is still not trading as a safe haven asset,” adds VTB Capital an analyst Andrey Kryuchenkov, “swinging back and forth in line with other metals in the precious complex, other liquid commodities and equities…volumes will remain very thin as players digest the latest pullback.”

“The aggressiveness of [last week’s] fall suggests that we are still in a consolidation rather in a reversal role,” says Tim Riddell, head of ANZ Global Markets Research, Asia.

“The $1435 level is likely to provide resistance…we really need to get back into the $1500s to say that there’s something more substantial taking place.”

On New York’s Comex exchange, “the liquidation of net speculative length [in gold contracts] appeared relatively mild [in the week ended last Tuesday],” says Standard Bank commodity strategist Marc Ground, referring to money managers’ so-called net speculative long position, calculated as the difference between the number of bullish and bearish contracts held.

“Only [the equivalent of] 20.8 tonnes (or 5.8%) were shed over the week — a long way from the worst we’ve seen this year (90.4 tonnes at the end of January). relatively strong unwinding of long positions (35.8 tonnes compared to this year’s record of 45.9 tonnes) was softened by a solid decrease in speculative shorts (15.0 tonnes).”

Ratings agency Fitch meantime has downgraded the UK’s credit rating from AAA to AA+, following a similar downgrade from Moody’s back in February. Standard & Poor’s has maintained its triple-A rating on British government debt.

“Despite the UK’s strong fiscal financing flexibility underpinned by its own currency with reserve currency status and the long average maturity of public debt, the fiscal space to absorb further adverse economic and financial shocks is no longer consistent with a ‘AAA’ rating,” said a statement from Fitch Friday.

“The UK and almost all of Europe have erred,” manager of world’s biggest bond fund Pimco Bill Gross tells the Financial Times, “in terms of believing that austerity, fiscal austerity in the short term, is the way to produce real growth. It is not. You’ve got to spend money.”

Gross adds that investors in government debt “want growth much like equity investors” and that excess austerity can lead to “recession or stagnation [causing] credit spreads [to] widen out – even if a country can print its own currency and write its own checks”.

Over in Italy, the Eurozone’s biggest issuer of public debt, Giorgio Napolitano has been elected for a second term as president by the country’s parliament after it rejected the nomination of Franco Marini. Italian politicians have failed to form a government since the general election two months ago.

Russia would like to “increase its participation” in negotiations about Cyprus, the country’s finance minister Anton Siluanov has said, but will only restructure a €2.5 billion loan in return for protection of Russian financial interests in the country, Reuters reports.

“Money of our companies has been frozen there,” Siluanov told reporters at the G20 meetings in Washington at the end of last week.

“We would like this money to reach its recipients.”

Ben Traynor

BullionVault

Gold value calculator   |   Buy gold online at live prices


Editor of Gold News, the analysis and investment research site from world-leading gold ownership service BullionVault, Ben Traynor was formerly editor of the Fleet Street Letter, the UK’s longest-running investment letter. A Cambridge economics graduate, he is a professional writer and editor with a specialist interest in monetary economics. Ben can be found on Google+


(c) BullionVault 2013

Please Note: This article is to inform your thinking, not lead it. Only you can decide the best place for your money, and any decision you make will put your money at risk. Information or data included here may have already been overtaken by events – and must be verified elsewhere – should you choose to act on it.


The Senior Strategist: This is a test week

U.S. stocks fell more last week than in any other week this year, and gold was hit hard last week dropping by 5-10 pct. The big issue is the nervousness about growth.

This week will be a test week. The markets are trying to figure out, what is going on with the growth. Senior Strategist Ib Fredslund Madsen believes that it will be a temporary soft spot in growth.

Legal information

Video courtesy of en.jyskebank.tv


Central Bank News Link List – Apr 22, 2013: Exclusive: Bernanke to skip Jackson Hole due to scheduling conflic

By www.CentralBankNews.info Here’s today’s Central Bank News link list, click through if you missed the previous link list. The list comprises news about central banks that is not covered by Central Bank News. The list is updated during the day with the latest developments so readers don’t miss any important news.

Gold, Silver and Bird Farmers

By MoneyMorning.com.au

Last was a tough week for hard assets. Prices plummeted for gold, silver, platinum, copper, oil and more. It was a broad, market-wide retreat — helped along by the ‘usual suspect’ market movers, who likely wanted to knock things down for their own nefarious reasons.

At some moments, the sell side was in a panic. People apparently bailed from large positions — although I believe that as things quickly evolved (too quickly, actually), many jumpers were forced to exit due to margin calls.

Lower prices for ‘long-term’ wealth-protection ideas like gold, silver, etc., have knocked down the share price for many a producing company.

All in all, many hard asset portfolios have taken tough hits, especially those of investors who bought in over the past year, and certainly in recent months. What happened? Where do we go? Has the hard asset train derailed? Let’s think it through.
 
I have to admit that a few weeks ago I did not foresee the sharp asset dive that we’ve just experienced. I’m more than aware that gold and silver prices go down as well as up. But I didn’t see a super-sharp selloff coming.

For example, Freeport-McMoRan Copper & Gold shares dropped from the $33 range to the vicinity of $29. Barrick shares dropped from over $25 to just under $19. These levels are five-year lows — as low as the respective companies have been since late 2008 and early 2009, during the worst days of the last crash.

At current price levels, the dividend yield for both Freeport and Barrick shares is near 4.2% for each company — not bad. If Freeport and Barrick were good ideas before, they’re ‘better’ ideas now. These entry points are attractive, although I counsel caution and suggest allowing more dust to settle. Yes, there is STILL a downside to big mining plays.

Still, at these levels, I’m inclined to suggest that long-term investors nibble away. Be sure to keep cash in reserve for other opportunities.

Markets for everything move up and down. You get bad days, right? That, and beware fighting the Federal Reserve.

But I still don’t understand why the [US] dollar is somehow so ‘strong’ in a relative sense and gold is somehow ‘weak’. The ferocity and scope of last week hard asset slide surprised me.

Why the Slide?

Let’s look at a couple of the mainstream explanations for the gold sell-off. One has to do with Japan’s intentional weakening of the yen for domestic ‘stimulation’.

In response, the dollar strengthens. Strong dollar leads to lower gold prices, right? But why would a stronger dollar trigger a major gold sell-off? On the best day, dollar-yen is an exchange-rate issue, not a fundamental restructuring of U.S. monetary issues.

How about the rumour that Cyprus will sell its national gold to pay the European Union for a bank bailout. That’s on top of Cyprus nicking all of the big bank accounts on the island for up to 60%. Still, how much gold does Cyprus have? And where would it go?

If Cyprus ‘sells’ its national gold, the transaction will likely just be a ledger move from the books of one central bank to another. That is, unless China buys the gold and demands delivery. Beware of that happening, because it’ll lead to a physical scramble to cover delivery — in which case gold prices should rise, not fall.

And why would any large gold holder — public or private — ‘sell’ it in such a way as to crash the price? That is, why dump a large gold position in a hurry? Especially if you know that it’ll spook the market downward, and at the end of the day you’ll get a lower price. That’s dumb, right?

It’s dumb unless you’ve already positioned yourself to gain from the price fall. You’ve got your short contracts in place. Basically, what if somebody is manipulating the gold market?

Who would do such a thing?

Well, gee. Isn’t it interesting that Goldman Sachs announced that it was recommending that people exit gold and await a price decline. Then, as if on cue, The New York Times published a front-page hit piece titled, ‘Gold, Long a Secure Investment, Loses Its Luster’.

When I saw the Times article, I wasn’t sure if it should be on the front page as news or the business pages, if not the obituary section. Here’s one of the key lines from the Times, ringing with empirical certitude: ‘Gold, pride of Croesus and store of wealth since time immemorial, has turned out to be a very bad investment of late.’

Got that? Gold is for losers. And then the next day, Times columnist Paul Krugman weighed in with a tirade against ‘gold bugs’, of which I’ll mention more below.

Looking for the Next Investment Fad?

First, though, looking back to 2001 or so, we’ve had a sweet, rising, bullish market for gold, silver, etc. Still, don’t confuse personal insight with a rising, bullish market.

The good news is that if you bought into the gold story back when the yellow metal was selling for $300 per ounce, you’re still up about 370% even after the pullback to the $1,400 range. If you bought silver at, say, $5 per ounce, then you’re up by a similar level.

But the last decade is history. What about the future? Is the gold pullback a harbinger of fundamental change in world monetary realities, if not market perceptions?

In other words, have central banks and their currencies — dollars, euros, yen, etc. — somehow gotten well in a hurry? Has investor sentiment changed dramatically and moved away from gold and silver?

In The New York Times, the predictably dyspeptic Paul Krugman ripped into gold and ‘gold bugs’. Krugman used his characteristic, ad hominem tone, and that nasty polemic style that he reserves to label and indict groups that lack a protected, politically-favoured status. (If Krugman were a woman, he’d be a ‘mean girl’.)

Basically, in his execrable column, Krugman gloated that after a 12-year run as a top-performing asset class, gold has hit the skids. It’s over for gold, states the economic sage of Princeton University. Of course, the former adviser to Enron has been known to be wrong in the past.

Deep down, though, let’s humour Krugman and ask the hard question. For the past decade or more, was gold just another investment fad — a transient, ‘dot-gold’ sort of thing, like buying dog food over the Internet — and now we need to find a new fad?

Looking for Clues

I’m old enough to recall the 1970s, when gold prices ran up from $32 per ounce to around $800. Then, as the 1980s unfolded, gold prices crashed back down and stayed in the dumps for two decades. I’ve seen this movie before.

What happened back then? The late 1970s and 1980s were the era of presidents Carter-Reagan in the US and prime ministers Callaghan-Thatcher in Britain.

First, under the ‘liberals’ (as the British label their politics), gold and silver prices ran up in the shadow of rampant global inflation and stagnant economies due to government mismanagement. Then, under the ‘conservatives’ (again using British terms), new leadership stopped their respective nations from turning into Cuba without the sunshine.

In the US, Federal Reserve Chairman Paul Volker raised interest rates to double-digit levels, and choked inflation out of the system. In Britain, Chancellor of the Exchequer Geoffrey Howe worked similar policy. In both nations, tough monetary policy pushed many an uneconomic enterprise into bankruptcy.

At the same time, other parts of the economy began to boom — not the least being Britain’s North Sea oil sector and American’s high-tech and defence sectors.

Returning to the present, why would the dollar get well last week while gold was forced into precipitous decline? Asked another way, is anyone serving up hard monetary or fiscal medicine to the US economy?

Do the Fed’s zero interest rate policies spread money to the job creators of the nation? Do legislative diktats like Dodd-Frank and Obamacare kick-start a profound advance in the fortunes of the US economy and its dollar.

Say again, what’s the signal for a long-term downtrend for gold? I do not see such flags waving, nor hear those drums beating and bugles blowing. It doesn’t make sense.

Just a Correction?

Try this. Perhaps the gold sell-off was more like a classic correction, where Mr. Market shakes out the weak hands. Indeed, the recent market retreat resembled a scene where valuable assets moved from weak hands to strong hands.

Consider this chart, courtesy of my friend and colleague Dan Denning:
 

The dark line represents shares in iconic Apple Computer, which are down nearly 35% in the past eight months. Compare this with gold, which dropped about 16.5%. Tell me again what’s ‘crashing’?

Investment guru Marc Faber recently made this same point during an interview with Bloomberg TV. He stated:

‘I love the markets. I love the fact that gold is finally breaking down. That will offer an excellent buying opportunity… At the same time, the S&P is at about not even up 1% from the peak in October 2007.

‘Over the same period of time, even after today’s correction, gold is up 100%. The S&P is up 2% over the March 2000 high. Gold is up 442%. So I am happy we have a sell-off that will lead to a major low. It could be at $1,400, it could be today at $1,300, but I think that the bull market in gold is not completed. Nobody knows for sure, but I think the fundamentals for gold are still intact.’

Those ‘fundamentals’ include the fact that gold is a hard asset and — if you take possession — no one else’s liability.

On this last point, consider that — as we learned from the recent Cyprus debacle — political and monetary authorities feel legally entitled and morally justified to confiscate your savings when they want the funds to cover government bills.

Meanwhile, never forget that central banks everywhere continue to print money and monetize government debt. The story of the Weimar Republic sort of speaks for itself.
 
To wrap it up, yes, the idea of a serious asset decline is always in the back of my head — certainly, since I saw gold tumble and stay down in the 1980s. But was last week the beginning of the end for gold? The resurrection of the dollar as a long-term store of wealth? I don’t believe so.

Not All Bad Luck Is Bad

One final point…

It is sad for the bird farmers, but good news for us,’ said a Chinese man, quoted in a recent issue of the UK Daily Mail. ‘Not all bad luck is bad for all,’ he added.

The Chinese man was discussing his relative good fortune. That is, he fell into a bargain buying unwanted baby ducklings from ‘bird farmers’.

The back story, here, is that the price of poultry has collapsed in China due to fears about a new strain of bird flu, called H7N9. Fearful of flu infection, Chinese diners are eating fewer duck dinners, leaving farmers who raise the birds with a large surplus.

Thus, Chinese duck farmers are selling birds on the cheap (so to speak), and others are benefitting. The ‘lucky’ farmer quoted above will feed the surplus baby ducks to his snakes.

With characteristic Chinese practicality, another farmer stated, ‘It’s not a nice end for the baby ducks but they were raised as food. They weren’t going to live on a pond for the rest of their natural lives.

Bottom line? If someone wants to sell you gold and silver at a bargain, feel free to take it off their hands.

Byron King
Contributing Editor, Money Morning

Join Money Morning on Google+

From the Archives…

Why Waste Your Time on Gold When You Can Invest in Dividend Stocks?
19-04-2013 – Kris Sayce

A Trader’s Eye View of Gold’s Frightening Collapse
18-04-2013 – Murray Dawes

Why You Should Buy ‘Dirty, Grimy’ Gold Stocks
17-04-2013 – Dr. Alex Cowie

Why this Historic Fall in the Gold Price Equates to a Historic Opportunity
16-04-2013 – Dr. Alex Cowie

Beware the ‘Safety Bubble’, But Don’t Sell Dividend Stocks Yet
15-04-2013 – Kris Sayce

A New Take on Hard Asset Investing

By MoneyMorning.com.au

Buying hard assets is all the rage.

Although in the case of gold, perhaps less than it was a few weeks ago.

Even so, with central banks printing money, investors are still worried that inflation will rear its head soon.

Hence the demand for gold, silver, property, artwork, land, and…um…cheese.

Is cheese really an investment? For some, it appears so. But it’s not the only tasty hard asset out there. There’s another that could be just as lucrative…and it won’t stink up your home…

Before we fill you in on the details, we should explain the cheese reference. This story from the UK Daily Mail reveals all:

Former milkmen will have a slice of their retirement savings rolled up in cheddar cheese as Cathedral City maker Dairy Crest attempts to solve its pensions pickle.

The dairy giant has agreed to offer £60 million worth — 20 million kilogrammes — of its maturing cheese stock as security for its pension fund as it battles to fill the holes in its final salary scheme.

At first it seems crazy — cheese in a pension fund. On reflection, it’s not so crazy. The idea isn’t that the fund pays out cheese to its members in lieu of a pension.

Instead, the idea is the pension fund holds a claim over the cheese assets and receives the proceeds when Dairy Crest sells the cheese in the future.

Cheese Beat Shares and Gold

But this isn’t the only case of pension funds using odd means to boost a pension fund gap. According to the Daily Mail, drinks firm Diageo has ‘deposited’ 2.5 million barrels of Scotch whisky into its pension fund.

And retailers Sainsbury’s and Marks & Spencer have used some of the companies’ property as security in their underfunded pension funds.

You can hardly blame the pension funds for turning to hard assets. With the recent trouble in Europe over governments defaulting or restructuring bonds, 20 million kilos of cheese seems a better bet than government debt.

And when you look at the track record of cheese over the past three years, you can see why the pension funds are happy to buy it.

According to the Chicago Mercantile Exchange, cheese block futures have risen from USD$1.42 in October 2009, to USD$1.88 today (the price peaked at $2.08 last October).

That’s a 32.4% gain. It’s not far behind the S&P 500’s 45.1% gain; slightly better than gold’s 31.7% gain; and nine-times better than the S&P/ASX 200’s 3.8% gain over the same period.

The only problem with cheese is that it’s well, a bit whiffy. The good news is there’s another tasty hard asset (actually, a liquid asset) that’s just as good as cheese. And luckily, it’s much more pleasing on the nose…

And Now for a Liquid Asset

We’re talking about wine.

According to data compiled by the world’s leading wine experts, an index of fine wine prices has gained 30.7% since October 2009.

That beats the blue-chip Australian stock index by eight times over the same period.

While past performance can’t guarantee future performance, it shows that investors are prepared to give more unconventional investments a go.

Saying that, over the past few weeks speculators have driven down the price of hard assets and commodities. You’ve seen that with the slump in gold and silver prices, and companies linked to those commodities — resources stocks.

So if you believe in the Investing 101 basic lesson of ‘buy low, sell high’, this could be the best time in five years to get your hands on hard (or liquid) assets.

Of course, like all investments, you can’t just buy anything and hope it will go up. If you buy a bottle of Jacob’s Creek chardonnay from your local bottle shop it probably won’t bag you a big return. That’s why it’s vital to find the wines that should increase in value the most.

Sound hard? Don’t worry; you don’t have to become a wine snob. Our old pal Nick Hubble has done a lot of the groundwork for you with this unusual asset class…

Raise a Glass to Fine Wine Returns

In his latest issue of the Money for Life Letter , Nick reveals the how, what, where, why and when of investing in the red and white liquid.

Like any investment, punting on wine is risky. Pick the wrong vintage or the wrong estate and it could leave you with an underperforming asset.

But then again, wine has something going for it that gold, shares and property don’t have. If it turns out to be a dud investment at least you can drown your sorrows by drinking a glass or two of the stuff.

Seriously, if you want to punt on an investment that did eight times better than the stock market over the past four-and-a-half years, then this is worth checking out. You can see Nick’s analysis, including the ins and outs of wine investing, here.

Cheers,
Kris

Join me on Google+

Ed Note: There’s more to investing than stocks and gold. In today’s Money Morning Premium Notes , Kris reveals the top 10 reasons to invest in the growing wine investment market, plus he reveals the top drop that bagged investors a 920% gain between 1999 and 2009. Could today’s market give investors similar gains? Click here to upgrade now.

From the Port Phillip Publishing Library

Special Report: TORRENT SIGNAL 3

Daily Reckoning: Ways to Invest to Improve Your Internal Well Being

Money Morning: Velocity: The X Factor for Hard Asset Investors

Pursuit of Happiness: The Definition of a Stockbroker…

Australian Small-Cap Investigator:
How to Make Money From Small-Cap Stocks

Dividend Stocks Look Expensive — What Should You Do?

By MoneyMorning.com.au

We’ve been fans of blue-chip, dividend-paying, ‘high quality’ stocks for many years now.

These companies have a lot going for them: they are tough enough to stand up to most economic conditions, and at a time when interest rates are at record lows, they represent one of the few ways to get an inflation-beating income — as long as you’re prepared to take the risk of owning stocks.

Trouble is, everyone has caught on to this idea by now. ‘Safe’ stocks have outperformed all comers during the bull run of recent years. In some cases, they now look expensive compared to other sectors.

So what should you do about it?

Investors Will Cough Up for Quality Stocks

As James Mackintosh points out in the FT, investors are increasingly willing to pay a premium for stocks that pay high dividends. ‘So much so that they are starting to look dangerously overvalued, especially in the US.

According to JP Morgan Asset Management, the highest-yielding stocks in the S&P 500 now trade on an average of 16 times forward earnings. That’s higher than at any point since 1994. The wider market is on about 14.

Reliable dividend payers — ones who keep delivering the goods, year-in, year-out — trade on even higher price/earnings ratios, notes Mackintosh.

Of course, it makes perfect sense that relatively dull, high-yielding stocks have done well compared to other stocks. If investors are gradually plucking up the courage to stick more money into equities, then where’s it going to go first? It’s going to go to the ‘safest’, most bond-like stocks.

But what do you do when the ‘safe’ stocks get expensive?

This Could Go On for a While Yet

The first thing I’d say is — don’t panic and sell.

The key with income stocks — as with any asset — is to remember why you bought them in the first place. In this case, you most likely bought these stocks because they were paying a decent dividend. Capital gains were a secondary consideration.

So it’s the dividend that matters. Unless something happens to affect that — the dividend is cut, or cancelled — then I don’t see any reason to sell urgently.

Also, while I can understand the argument that dividend-payers look expensive, I’m not sure that’s going to change in the near future.

If the economy weakens, profits might drop, and dividends might be cut. But this would also be bad for other, more vulnerable stocks. Interest rates would also stay low in such a scenario, meaning that the rationale for buying income stocks wouldn’t go away.

If the economy strengthens, interest rates might start to rise. That would make high-yielding stocks less attractive. But a stronger economy would be good for decent companies in the long run, while the threat of rising interest rates would again hit highly indebted, ‘dash-for-trash’ stocks hard.

There could be a stock market crash, no argument there. In that case, defensive income stocks would fall. But they’d probably take less damage than their less defensive peers.

The one big danger that my colleague Merryn Somerset Webb worries a lot about is a change in government tax policy. If governments decide that companies should be investing rather than paying dividends, or that dividends should be taxed more aggressively, that would be bad.

It’s not out of the question. But it’s one of those nebulous risks that you should be aware of, without necessarily adjusting your entire portfolio.

So as far as I can see, the biggest risk is that ‘quality’ stocks might underperform their more cyclical peers if money printing continues but the economy doesn’t get a lot worse. In other words, ‘quality’ will go up, but just not by as much as other stocks. That’s a risk I feel I can live with.

The Beauty of Rebalancing

That said, you know that we don’t like buying assets when they’re expensive. We’re great believers in ‘mean reversion’. Expensive stuff will eventually get cheap; cheap stuff will eventually get expensive. So if you buy when an asset is expensive, you’re more than likely to lose money in the long run.

The big threat here is that investors are currently willing to pay a premium for income stocks. That will change one day — maybe not today, maybe not tomorrow, but it will change.

So here’s what I’d suggest: take a look at your portfolio (this is all the investment assets you own).

In short, asset allocation is all about making sure you don’t have too many of your eggs in one basket when you start building your portfolio. And rebalancing is about making sure it stays that way — you check regularly to make sure that your investments haven’t become too dependent on one asset class.

Focus on the equity portion of your portfolio in particular. Split the equity portion into stocks or funds you bought for income, and ones you bought for growth.

Now I’m not going to tell you what proportion of your money should be in income stocks as compared to ‘growth’ stocks. That’s very much up to you and depends on your individual needs.

But let’s say you think the balance is starting to look rather skewed. Rather than selling some of your dividend stocks, consider putting some of the income they generate into other segments of your portfolio, rather than reinvesting it back into the same stocks.

You might want to use the money to add to the cheap markets such as Japan, or Europe. Alternatively, you might want to top up the cash section of your portfolio, and sit on the money until you see an opportunity you like.

John Stepek
Contributing Editor, Money Morning

Join Money Morning on Google+

Publisher’s Note: This article originally appeared in MoneyWeek

From the Archives…

Why Waste Your Time on Gold When You Can Invest in Dividend Stocks?
19-04-2013 – Kris Sayce

A Trader’s Eye View of Gold’s Frightening Collapse
18-04-2013 – Murray Dawes

Why You Should Buy ‘Dirty, Grimy’ Gold Stocks
17-04-2013 – Dr. Alex Cowie

Why this Historic Fall in the Gold Price Equates to a Historic Opportunity
16-04-2013 – Dr. Alex Cowie

Beware the ‘Safety Bubble’, But Don’t Sell Dividend Stocks Yet
15-04-2013 – Kris Sayce

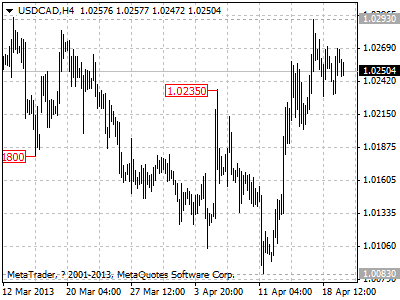
USDCAD remains in uptrend from 1.0083

USDCAD remains in uptrend from 1.0083, the fall from 1.0293 is treated as consolidation of the uptrend. Support is at 1.0200, as long as this level holds, another rise to test 1.0341 resistance is still possible, a break above this level will indicate that the longer term uptrend from 0.9632 (Sep 14, 2012 low) has resumed, then the following upward move could bring price to 1.0500 area. On the downside, a breakdown below 1.0200 level will suggest that the upward movement from 1.0083 has completed at 1.0293 already, then deeper decline towards 1.0000 could be seen to follow.

usdcad

Daily Forex Forecast

Long US Dollar Positions boosted slightly by Large Currency Futures Speculators

Weekly Commitment of Traders Data by CFTC shows which way Large Traders and Hedge Funds were leaning the previous week in the Futures Market

By CountingPips.com


cot-values


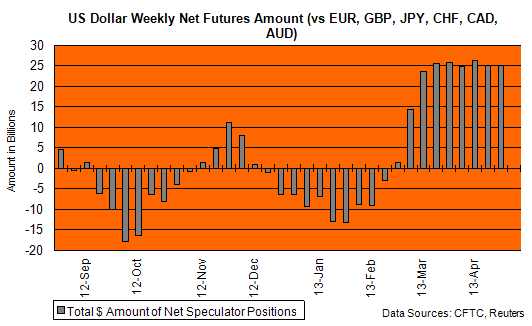
The latest weekly Commitments of Traders (COT) report, released on Friday by the Commodity Futures Trading Commission (CFTC), showed that large futures traders slightly increased their total bullish bets of the US dollar last week against the other major foreign currencies. Total speculator positions have seen little movement in the past few months, as you can see from the chart above.

Non-commercial large futures traders, including hedge funds and large International Monetary Market speculators, registered an overall US dollar long position of $25.18 billion as of Tuesday April 16th. This was a small increase from the total long position of $25 billion on April 9th, according to position calculations by Reuters (US dollar positions against the total positions of eurofx, British pound, Japanese yen, Australian dollar, Canadian dollar and the Swiss franc).


Individual Currencies Large Speculators Positions in Futures:

The individual currency contracts quoted directly against the US dollar last week saw increases for the euro, British pound sterling, Swiss franc, Mexican peso and the New Zealand dollar while the Japanese yen, Australian dollar and the Canadian dollar all had a declining number of net contracts for the week.


Individual Currency Charts: (Please Click on Chart to Enlarge)


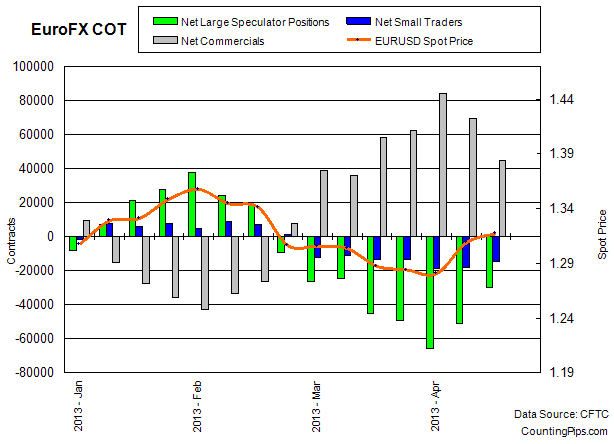
EuroFX: Weekly change of +21,094

EUR

EuroFX: Large trader positions for the euro advanced last week for second consecutive week. Euro contracts improved to a total net position of -29,764 contracts in the data reported for April 16th following the previous week’s total of -50,858 net contracts on April 9th.

This is a change of +21,094 contracts for the week compared to previous week’s change of +14,843.


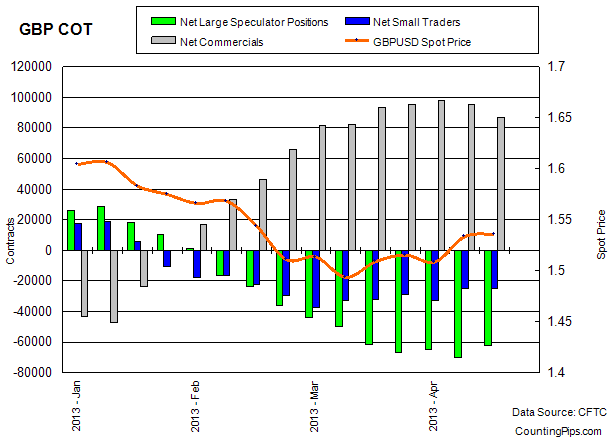
British Pound Sterling: Weekly change of +7,994

GBP

GBP: British pound spec positions improved last week to its best level in about a month after falling to the lowest level of 2013 previously. British pound speculative positions rose last week to a total of -61,975 net contracts on April 16th following a total of -69,969 net contracts reported for April 9th.

This was a weekly change of +7,994 in large trader contracts following the previous week’s change of -4,949 contracts.


Japanese Yen: Weekly change of -15,714

JPY

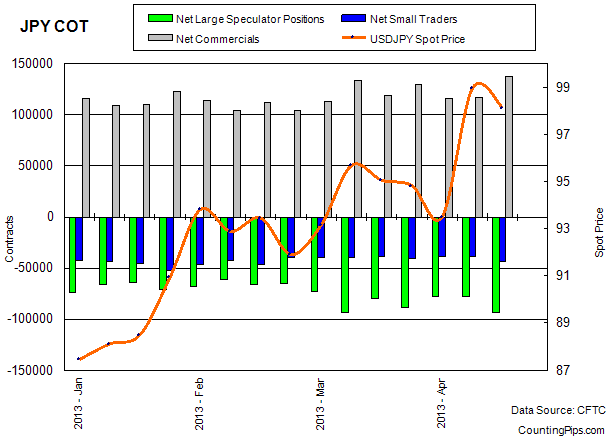
JPY: Japanese yen net speculative contracts decreased last week to the lowest level since March 12th after rising for the previous two weeks. Japanese yen positions fell to a total of -93,411 net contracts on April 16th following a total of -77,697 net short contracts on April 9th.

This is a weekly change of -15,714 following the previous week’s change of +474 positions.


Swiss Franc: Weekly change of +6,761

CHF

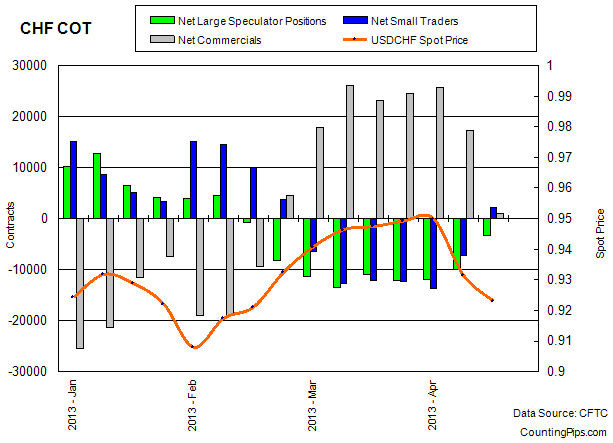
CHF: Swiss franc speculator positions improved last week for a third consecutive week and to the best position since February. Net positions for the Swiss currency futures improved to a total of -3,253 contracts on April 16th following a total of -10,014  net contracts reported for April 9th.

This is a weekly change of +6,761 contracts following the previous week change of +2,001  contracts.


Canadian Dollar: Weekly change of -4,780

CAD

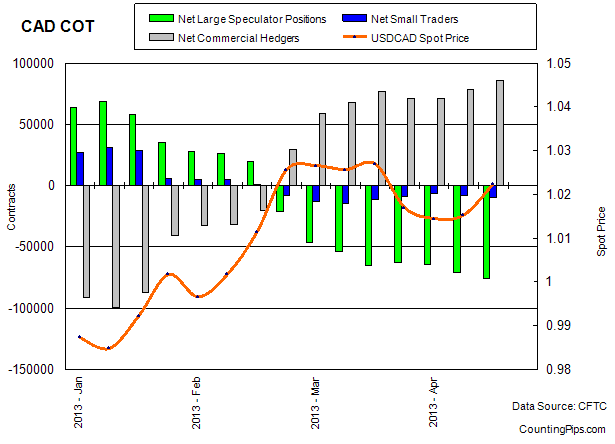
CAD: Canadian dollar positions continued to decline last week for a third straight week and to a new low level in 2013. Canadian dollar positions dropped to a total of -75,913 contracts as of April 16th following a total of -71,133 net contracts that were reported for April 9th.

This is a weekly change of -4,780 net contracts following a weekly change of -6,589 the previous week.


Australian Dollar: Weekly change of -24,704

AUD

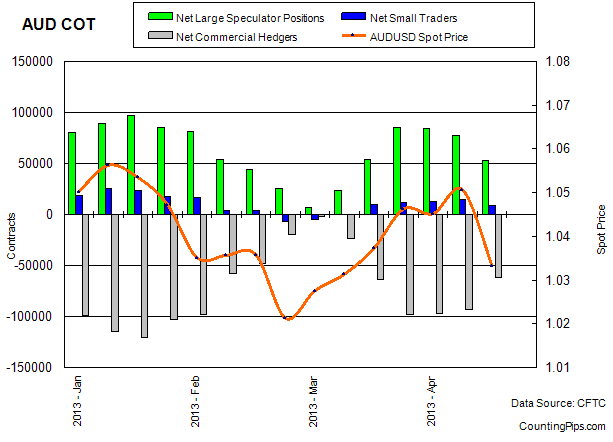
AUD: The Australian dollar declined last week for a third consecutive week and to the lowest level since March 12th. Aussie speculative futures positions declined to a total net amount of +53,175 contracts on April 16th after totaling +77,879 net contracts as of April 9th.

This is a weekly change of -24,704 in net positions following the previous week’s -6,092 change.


New Zealand Dollar: Weekly change of +5,658

NZD

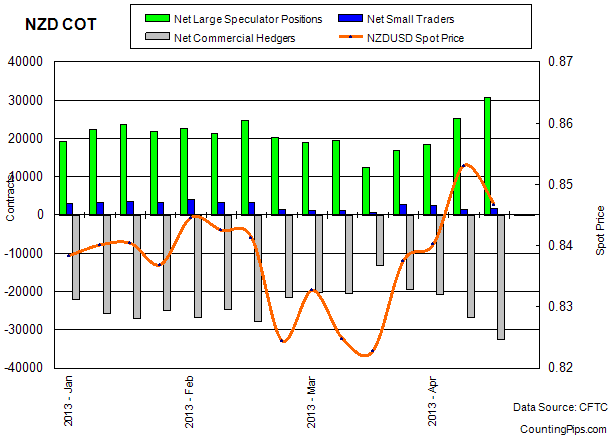
NZD: New Zealand dollar speculator positions jump last week to rise for a fourth consecutive week and to a new 2013 high level. NZD contracts rose to a total of +30,808 net long contracts as of April 16th following a total of +25,150 net long contracts on April 9th.

This is a weekly change of +5,658 following the previous week’s change of +6,763 net contracts.


Mexican Peso: Weekly change of +8,746

MXN-1

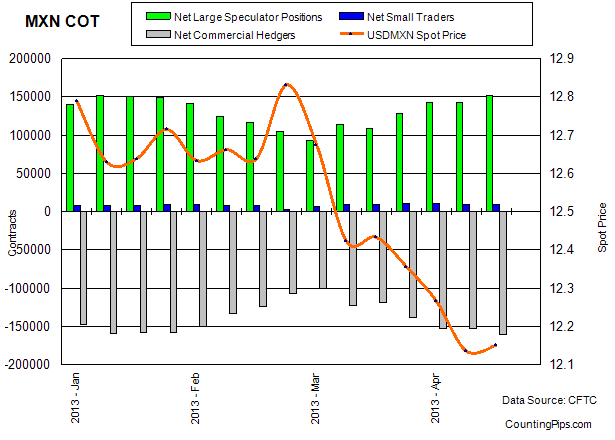
MXN: Mexican peso speculative contracts rose last week after dipping slightly the previous week. Peso positions rose to a total of +151,288 net speculative positions as of April 16th following a total of +142,542 contracts that were reported for April 9th.

This is a weekly change in net large peso speculator positions of +8,746 contracts following the previous change of -213 contracts.


Additional Macro Financial Markets:

10 Year Treasuries: Weekly change of +14,593

10Year

10 Year Notes: 10-Year Treasury Note speculative contracts advanced higher last week to rise for a fifth consecutive week. 10-Year positions increased to a total of +135,372 net speculative positions as of April 16th following a total of +120,779 contracts that were reported for April 9th.

This is a weekly change in net large speculator positions of +14,593 contracts following the previous week’s change of +10,087 contracts.


Crude Oil Light Sweet: Weekly change of -12,695

CRude

Crude Oil: Crude Oil speculative contracts decreased last week to fall for a second straight week after rising for the previous two weeks. Crude spec positions decreased to a total of +210,703 net speculative positions as of April 16th following a total of +223,398 contracts that were reported for April 9th.

This is a weekly change in net large speculator positions of -12,695 contracts after the previous weekly change of -25,452 contracts.


Gold Futures CMX: Weekly change of +9,523

GOLD

Gold: Gold contracts rose last week to end a three week skid for speculative net positions. Gold futures positions increased to a total of +128,882 net speculative positions as of April 16th following a total of +119,359 contracts that were reported for April 9th.

This is a weekly change in net large speculator positions of +9,523 contracts following the previous week’s change of -847 contracts.


S&P 500 Index Futures: Weekly change of -5,592

SP500

S&P 500: S&P 500 speculative contracts decreased last week after advancing the previous two weeks. S&P 500 futures positions declined to a total of +1,239 net speculative positions as of April 16th following a total of +6,831 contracts that were reported for April 9th.

This is a weekly change in net large speculator positions of -5,592 contracts.


VIX Futures: Weekly change of -20,045

VIX

VIX: VIX speculative contracts declined last week to fall for a third week. VIX futures positions dropped to a total of -89,698 net speculative positions as of April 16th following a total of -69,653 contracts that were reported for April 9th.

This is a weekly change in net large speculator positions of -20,045 contracts following the previous week’s change of -1,380 contracts.


The Commitment of Traders report is published every Friday by the Commodity Futures Trading Commission (CFTC) and shows futures positions data that was reported as of the previous Tuesday (3 days behind).

Each currency contract is a quote for that currency directly against the U.S. dollar, a net short amount of contracts means that more speculators are betting that currency to fall against the dollar and a net long position expect that currency to rise versus the dollar.

(The graphs overlay the forex spot closing price of each Tuesday when COT trader positions are reported for each corresponding spot currency pair.)

See more information and explanation on the weekly COT report from the CFTC website.


Article by CountingPips.comForex News & Market Analysis


Monetary Policy Week in Review – Apr 20, 2013: One central bank raises rate, 1 cuts as inflation remains sticky

By www.CentralBankNews.info

    Last week six central banks took policy decisions with two major banks in emerging markets (Turkey and Brazil) changing their rates in opposite direction while the other four central banks (Canada, Sweden, Mozambique and Sri Lanka) kept rates steady as inflation remains sticky despite weak global growth.
    Brazil’s 25 basis point rate hike – well-flagged and overdue – was significant because it illustrates that inflationary pressures are building in some emerging markets, specifically Asian countries, and central bankers will defend their inflation-fighting credentials.
    Brazil’s move was in contrast to decisions by Canada and Sweden to further push back the time frame for rate rises, showing how the euro area’s severe crises is hampering economic recovery throughout advanced economies while growth in many emerging markets is accelerating.
    While inflation remains an issue in many emerging countries, disinflation – or deflation in the case of Japan – haunts many advanced economies as long unemployment lines holds down wage pressure along with excess industrial capacity.
    Sweden’s Riksbank specifically cited the need to keep policy rates low for longer than forecast because inflation will take longer to return to target than expected. For 2013 inflation is forecast to average a mere 0.1 percent.
    Weaker-than-expected growth is also holding back inflation in Canada, with the Bank of Canada now first expecting inflation to return to target by mid-2015, at least six months later than it expected in January.
   Turkey, which bounced back swiftly from the global financial crises but then was hit by slow growth last year, cut its rate by a larger-than-expected 50 basis points despite inflation above the central bank’s target.
    The latest central bank decisions came as policy makers gathered in Washington D.C. for the annual meeting of the International Monetary Fund.
    While the IMF trimmed its 2013 global growth forecast, it also said the global economy was taking on the characteristics of a three-speed recovery. Growth in emerging and developing markets is still strong, the U.S. is getting back on its feet, but the euro area is continuing to contract with adverse feedback loops between weak banks, weak sovereigns and low economic activity reinforcing each other.
    Through the first 16 weeks of this year, 77 percent of the 147 policy decisions taken by the 90 central banks followed by Central Bank News have lead to unchanged rates, the same ratio as after 15 weeks.
    Globally, 19 percent of policy decisions this year have lead to rate cuts – largely by central banks in emerging economies – unchanged from last week and slightly down from 20 percent the week before then.
 LAST WEEK’S (WEEK 16) MONETARY POLICY DECISIONS:

COUNTRYMSCI    NEW RATE          OLD RATE       1 YEAR AGO
MOZAMBIQUE9.50%9.50%13.50%
SRI LANKAFM7.50%7.50%7.75%
TURKEYEM5.00%5.50%5.75%
BRAZILEM7.50%7.25%9.00%
SWEDENDM1.00%1.00%1.50%
CANADADM1.00%1.00%1.00%
Next week (week 17) features eight central bank policy decisions, including Hungary, Namibia, New Zealand, Philippines, Fiji, Japan (including the economic outlook), Mexico and Trinidad and Tobago.

COUNTRYMSCI             DATE              RATE       1 YEAR AGO
HUNGARYEM23-Apr5.00%7.00%
NAMIBIA24-Apr5.50%6.00%
NEW ZEALANDDM24-Apr2.50%2.50%
PHILIPPINESEM25-Apr3.50%4.00%
FIJI25-Apr0.50%0.50%
JAPANDM26-Apr0.00%0.10%
TRINIDAD & TOBAGO26-Apr2.75%3.00%
MEXICOEM26-Apr4.00%4.50%