Is It Time to Sell Your Gold?

By Bill Bonner

Dear readers ask about gold. Is it time to sell? To buy? To forget about it?

Gold fell $25 yesterday; it now stands at $1,575 per ounce. The gold
price could break all the way down to $1,000. But we don’t expect it.
Gold is not in a bubble.

As you have seen, gold is neither overpriced nor underpriced. It buys
about what it should buy. Maybe a little less. Maybe a little more.

How do we know what gold “should” buy?

We don’t, really. But gold is a natural thing. It is pulled from the
earth by people, using the technology and resources available to them.
As their productivity in other areas goes up, so does – generally –
their ability to extract gold from the ground.

If GDP goes up 10%… the quantity of gold usually goes up about the
same amount. If the economy goes into a decline, so does the gold mining
industry… reducing the rate of growth of the gold supply.

For these reasons, the supply of gold is usually more or less in sync
with the supplies of other goods and services. And the exchange rate
between gold and other goods and services is usually stable.

This was also the observation of Roy Jastram, who wrote The Golden Constant in 1977. Jastram looked at 500 years of British history. He found that prices – in terms of gold – were remarkably stable.

And here we see that prices for stocks, too, were also stable… as
long as gold – rather than an economist – stood behind the currency.

Gold Standard vs. Fiat Capital
View Larger Image

You can see for yourself from the above chart of the Dow/gold ratio
going back to 1800. Prices for stocks went haywire in gold terms only
after Congress created the Federal Reserve System in 1913.

Then the world went off the gold standard during World War I. (It was partly the struggle to get back on the gold standard that set off the bubble of the 1920s.)

Then there was another big run-up of stock prices – in terms of gold –
in the 1950s and 1960s… and again in the 1980s and 1990s. The chart
also shows the Dow/gold ratio heading down for the last 13 years… with
no clear sign that it has reached the bottom.

But wait. Hasn’t most of the profit for gold buyers already been made? Tekoa Da Silva from BullMarketThinking.com explains:

In response to that, the Pareto
Principle suggests that 80% of the gains are found in the final 20% of
the bull market. As it currently stands, the Dow/gold ratio is sitting
at roughly 9-to-1. A move to a 5-to-1 ratio would require a
$2,907-per-ounce gold price, a 3-to-1 ratio $4,845 per ounce, and a
2-to-1 ratio would require a stunning $7,268-per-ounce gold price.

A 2-to-1 ratio move from here equates
to a 400% move higher in gold, and of course, a 1-to-1 ratio ($14,500
per ounce) would equate to an over 900% move left remaining in the gold
bull market.

Be Happy

Da Silva does not say so, but the Dow/gold ratio could come down in
another way. Gold does not have to go up in price; stocks could fall. If
the Dow were to slip to 8,000, for example, this would be equivalent to
a 5-to-1 ratio.

When the stock market cracked in 2000… and gold continued to
rise… we thought the two were headed for a historic conjunction.
Perhaps at 2-to-1. Perhaps at 1-to-1. Where would the two meet?

We guess it would happen at about 5,000. Gold would rise to $5,000 per ounce… and the Dow would fall to 5,000.

Or at 2-to-1 – the Dow could fall to only 10,000… while the gold price rose to $5,000 per ounce.

Who knows? But there is no reason to think that things have changed in any fundamental way.

Gold is still real money. It is still brought forth only with much
effort and investment. And the Dow stocks still represent a certain
group of publicly listed, US-domiciled companies from which you can
expect a certain earnings stream. There is no reason to think that the
basic relationship between the Dow stocks and gold has been altered in
any fundamental or everlasting way.

For practically the entire 19th century… many years of the 20th
century… and as recently as the 1980s, the ratio of the Dow to gold
was 1 to 5 or less. Investors paid 5 ounces of gold to buy the Dow and
its earnings.

Will the Dow once again trade for 5 ounces of gold or less? Almost
certainly. And it will probably happen before this historic drop in the
Dow/gold ratio has reached its final bottom.

Hold your gold. Sell your stocks. Floss your teeth. And be happy.

Regards,

Bill Bonner

Bill

To learn more about Bill visit his Google+ page or go to Bill Bonner’s Diary


The Real Reason There Will Be No “Recovery” in America

By Bill Bonner

Nothing much happened on Wall Street yesterday. The Dow rose 56 points. Gold was flat.

From the Daily Mail in London:

US sees highest poverty spike since the 1960s, leaving 50 million Americans poor…

The number of Americans living in
poverty has spiked to levels not seen since the mid-1960s, classing 20%
of the country’s children as poor.

It comes at a time when government
spending cuts of $85 billion have kicked in after feuding Democrats and
Republicans failed to agree on a better plan for addressing the national
deficit.

The cuts will directly affect 50
million Americans living below the poverty income line and reduce their
chances of finding work and a better life.

As President Barack Obama began his
second term in January, nearly 50 million Americans – one in six – were
living below the income line that defines poverty, according to the
bureau. A family of four that earns less than $23,021 a year is listed
as living in poverty.

The newspaper illustrates its bleeding-heart story with a
ridiculous example, taken from the streets of Baltimore. A Mr. Antonio
Hammond abandoned his children for 20 years… and stole copper pipes
and other things to support a full-time drug habit.

“All I wanted to do was to get high,” he told the Daily Mail.

Then Hammond kicked the habit and got a job at $13 per hour. Now he’s
a success story. And if you believe the Daily Mail, cuts to the federal
budget may make it harder for people like Hammond to escape from
poverty.

Seems much more likely to us that cuts to federal spending will help
people like Hammond get back on their own two feet; the feds won’t have
the funds to keep him in poverty.

Baltimore has been fighting poverty for the last 50 years – ever
since President Johnson declared a war on poverty in the 1960s. Spending
has gone up and up, blasting away at poverty with hundreds of billions
of dollars.

But now Baltimore has more poor people than ever – one in four residents is below the poverty line, according to the Daily Mail. And no wonder. When poverty pays, why take up something else?

No Brave New World

We wonder how come there are so many poor people? Wasn’t the Internet supposed to make us all rich?

Even Hammond can now go online and discover the secrets of business
and science. He can know as much about economics as Ben Bernanke. He can
know as much about politics as Nancy Pelosi. He can know as much about
journalism as Tom Friedman.

So how come they get the big bucks and he doesn’t? How come a man who
can know almost everything settles for just $13 per hour? Is that all
omniscience is worth?

Back at the end of the 1990s, we ran into people who thought the
Internet changed everything. With so much information at everyone’s
fingertips, they thought they saw a brave new world coming.

We would all have access to the information we needed to increase
productivity and add wealth. No one would be poor again. All they would
have to do is to go on the Internet to find out how to get rich.

We were suspicious of these claims back then. Information is cheap,
we pointed out. It’s wisdom that is precious, and you don’t get much of
that on the Internet. You have to pay for it… with bitter experience.

In fact, information – unless it is exactly what you need, exactly
when you need it – has negative value. It distracts you. It must be
applied. And stored.

How much good would it have done Napoleon – on his disastrous retreat
from Moscow – to have the plans for a nuclear weapon? Suppose Louis
XVI, mounting the scaffold to the guillotine, had had proof that Sacco
and Vanzetti were innocent! Imagine whispering to Hugo Chavez, as he lay
on his deathbed: “Studies show that people who eat less meat have less
cancer.”

No, dear reader, information is like manure. A little, at the right time, is a good thing. Pile up too much, and it stinks.

Productivity Falls

And now we have proof… that the Internet did not add to the wealth of the US… or apparently anywhere else. From The New Yorker:

For a time, the Labor Department’s
productivity figures appeared to support the idea of an Internet-based
productivity miracle. Between 1996 and 2000, output per hour in the
non-farm business sector – the standard measure of labor productivity –
grew at an annual rate of 2.75%, well above the 1.5% rate that was seen
between 1973 and 1996.

The difference between 1.5% annual
productivity growth and 2.75% growth is enormous. With 2.75% growth
(assuming higher productivity leads to higher wages), it takes about 26
years for living standards to double. With 1.5% growth, it takes a lot
longer – 48 years – for living standards to double…

Since the start of 2005, productivity
growth has fallen all the way back to the levels seen before the Web was
commercialized, and before smart phones were invented.

During the eight years from 2005-2012,
output per hour expanded at an annual rate of just 1.5% – the same as it
grew between 1973 and 1996. More recently, productivity growth has been
lower still. In 2011, output per hour rose by a mere 0.6%, according to
the latest update from the Labor Department, and last year there was
more of the same: an increase of just 0.7%. In the last quarter of 2012,
output per hour actually fell, at an annual rate of 1.9%. Americans got
less productive – or so the figures said…

If the sluggish rates of productivity
growth we’ve seen over the past two years were to persist into the
indefinite future, it would take more than a hundred years for
output-per-person and living standards to double.

How about that? The Internet. A big dud. A time waster, like television, not a wealth booster, like the internal combustion engine.

Regards,

Bill Bonner

Bill

To learn more about Bill visit his Google+ page or Bill Bonner’s Diary


What’s Next for the Yen and Japanese Stocks?

By The Sizemore Letter

When it comes to quantitative easing, Fed Chairman Ben Bernanke is playing AA minor league ball at best.  If he ever wants to make the big leagues, he needs to take batting practice with Japan’s new central bank governor, Haruhiko Kuroda.

In addition to the “usual” quantitative easing actions of buying government bonds, the Bank of Japan will be buying 30 billion yen of Japanese real estate investment trusts and a trillion yen of exchange traded funds…annually!

By Forbes estimates, the new expansion in Japan’s monetary base amounts to 10% of Japan’s GDP.  By comparison, Bernanke’s QE Infinity is less than 7% of U.S. GDP.

Not surprisingly, Japanese stocks surged on the news.  We talk about the Fed “propping up” the stock market here (and conspiracy theorists have long accused the “Plunge Protection Team” of manipulating the markets), but  we’ve never had the Fed directly jumping into the stock market like this.

What does this mean for Japanese stocks going forward?  Or the yen?

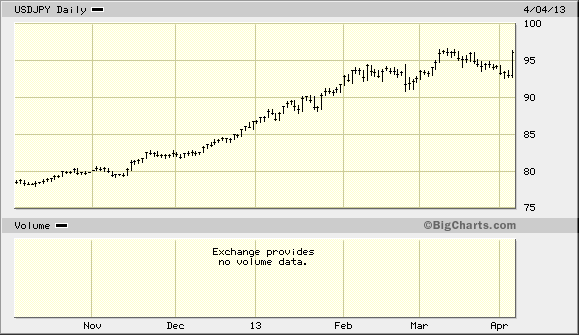
Figure 1: USDJPY

Figure 1: USDJPY

The standard “don’t fight the Fed” advice applies here, at least in the short term.  The Bank of Japan is determined to push the value of the yen down to boost exports and to shake the economy out of its long deflationary funk.  It’s much easier for a central bank to destroy the value of its currency when it is expensive than to prop up its value when it is falling.

So, don’t try to be a hero here by betting against the Bank of Japan.  Remember, George Soros made his legendary “bankrupt the Bank of England” trade by shorting the pound when the BoE was trying to prop it up.  Not even Soros the Great and Powerful could have succeeded in a long bet against a central bank this determined to weaken its currency.

Let’s take a look at how the yen has performed of late (Figure 1). You have to view this graph in reverse; a rising line means a falling yen relative to the dollar. (Think of it like this; back in November, a dollar would have bought you 80 yen; that same dollar today will buy you 96 yen.)

The yen has been in virtual free fall since it became obvious that Prime Minister Shinzo Abe would win last year’s election, though the yen rose sharply for most of March due in large part to the turmoil coming out of Europe.

Perversely, given Japan’s debt load, the yen became a “haven” currency following the unwinding of the carry trade in 2008 (which should put the nail in the coffin of any ideas you might have had about markets being rational).  So, if Europe has another destabilizing wave of volatility, then the yen might enjoy a brief respite.  But overall, the yen’s downward trend will likely continue for a while.

Figure 2: iShares MSCI Japan ETF (NYSE:EWJ)

Figure 2: iShares MSCI Japan ETF (NYSE:EWJ)

What about Japanese equities?

Japanese stocks, measured by the iShares MSCI Japan ETF (NYSE:$EWJ), have been on a tear since mid-November (Figure 2), coinciding with the yen’s decline.  And over the next, say, three to six months, I expect this trend to continue.

But be careful here; Japanese stocks should be viewed as a short-term trade, and most definitely not a long-term investment.  In the not-too-distant future, I expect Japan to bust apart at the seams.  If the Bank of Japan is successful in reigniting inflation, Japanese bond yields will rise.  And when Japan’s financing costs rise, that gargantuan pile of debt (currently 220% of GDP) becomes a lot harder to service.

As I wrote in February, “debt service now accounts for 43% of Japanese government revenues and quarter of all spending.  Furthermore, more than half of all Japanese government spending is financed by new borrowing.   This means that half of every yen borrowed is used to service existing debts.  It’s a debtor’s nightmare that gets worse every year with budget deficits that are consistently higher than 7% of GDP.”

The bond vigilantes will eventually wake up and take note of these sobering statistics, and when they do things are likely to deteriorate very quickly.  Think banana republic levels of hyperinflation followed by outright default.

Amazingly, Japanese yields continue to fall for now.  The 10-year Japanese bond now yields an almost unbelievable 0.45%.  At these levels, shorting Japanese bonds becomes an almost risk-free proposition.

When yields finally begin to rise, get ready for the short opportunity of a lifetime in virtually all Japanese assets.  In the meantime, keep an eye on the 10-year yield.  When it rises above the 1.0-1.5% level, I expect doomsday to follow shortly thereafter.

Disclaimer: Charles Sizemore currently has no positions in any security mentioned.


The post What’s Next for the Yen and Japanese Stocks? appeared first on Sizemore Insights.

Gold’s Fall “Exaggerated”, Another Big Move Down “Will Need to Break Through Big Support Level”

London Gold Market Report
from Ben Traynor
BullionVault
Friday 5 April 2013, 07:30 EST

U.S. DOLLAR gold prices climbed back towards $1556 per ounce Friday morning in London,
the level that was until yesterday’s falls the 2013 low, as stocks and commodities fell ahead of the
release of monthly US jobs data.

Gold in Sterling climbed back above £1020 an ounce, up from a three-month low hit yesterday,
while gold in Euros climbed back above €1200 an ounce, after touching its lowest level since
February.

Silver briefly edged back above $28 an ounce, having fallen to eight-month lows yesterday, while
longer-dated US Treasuries gained.

The latest US Employment Situation report, which includes the nonfarm payrolls figures for the
number of jobs added last month as well as the latest unemployment rate, is due to be released at
08.30 Washington, D.C. time.

A day earlier, gold sank to a 10-month low in Dollar terms Thursday, briefly touching $1540 an
ounce.

“The fact that gold failed to hold the intraday lows in the $1540 area is a bit of a concern for the
bearish trend in the short-term,” say technical analysts at Scotia Mocatta.

“There is a big support level between $1522 and $1532 which will have to be cleared before we see
another large move down in gold.”

The gold price will average $1730 an ounce this year, trading in a range between $1530 and $1850,
according to forecasts published Thursday by metals consultancy Thomson Reuters GFMS.

GFMS added however that an improving economic backdrop “could easily entail the start of a
secular bear market” in 2014. At the launch of its Gold Survey 2013 report, GFMS also noted that
gold exchange traded funds saw outflows of 177 tonnes in the first three months of 2012, equivalent
to 63% of the amount they added over the whole of 2012.

As of Thursday, the volume of gold backing shares in the world’s biggest gold ETF, SPDR Gold
Trust (ticker: GLD), was down more than 10% since the start of the year.

Hedge fund Paulson & Co., which latest available data show held around 5% of the GLD, saw
its Gold Fund fall by 27.9% in the first quarter, the Wall Street Journal reports, with the firm
citing “implied volatility in the gold derivatives market”. The Dollar gold price was down around
4% over the same period.

“The main driver behind gold’s weakness this year has been the focus on global growth and that’s
meant rotation out of defensive assets like gold,” says UBS analyst Joni Teves.

“There’s this weak sentiment and it’s been feeding on itself. Central banks continue to pursue
exceptionally loose monetary policies and create a still supportive environment for gold.”

“Investors are reshuffling commodity investments into equities,” adds Commerzbank analyst Daniel
Briesemann.

“We find it somewhat hard to understand the current underperformance of commodities given that
the market environment is characterized by at least some economic recovery. We think that the drop
is exaggerated.”

Police in Italy on Sunday seized gold bars worth an estimated €4.5 million after stopping a car
trying to cross the border into Switzerland, according to press reports.

Friday marks the 80th anniversary of Executive Order 6102, the confiscation of privately-held
gold by President Roosevelt in 1933.

Ben Traynor
BullionVault

Gold value calculator | Buy gold online at live prices

Editor of Gold News, the analysis and investment research site from world-leading gold ownership
service BullionVault, Ben Traynor was formerly editor of the Fleet Street Letter, the UK’s longest-
running investment letter. A Cambridge economics graduate, he is a professional writer and editor
with a specialist interest in monetary economics. Ben can be found on Google+

(c) BullionVault 2013

Please Note: This article is to inform your thinking, not lead it. Only you can decide the best
place for your money, and any decision you make will put your money at risk. Information or
data included here may have already been overtaken by events – and must be verified elsewhere –
should you choose to act on it.


Barbados to focus on treasury rates instead of deposit rate

By www.CentralBankNews.info
    The Central Bank of Barbados (CBB) is launching a new approach to influencing interest rates by intervening directly in the market for Treasury bills instead of using the minimum deposit rate as a guide to affecting commercial banks’ lending rates and thus economic activity.
    The rationale behind the new policy was unveiled in a CBB working paper from last month  – Central bank intervention and interest rate policy in Barbados – that laid out the limitations of using interest rates to control inflation in a country like Barbados where 80 percent of inflation is imported.
    “It has been the experience in Barbados that monetary policy cannot relieve any pressure that might aggravate imported inflation; for instance, it will not achieve low domestic inflation rates in an environment where international oil and commodity inflation is high,” the paper said.
    Under the new policy, which will begin on April 18, the CBB said it would “from time to time intervene actively in the Treasury Bill market to influence the average rate at which the bills are sold.”
    The coupons on all longer-dated government securities will be priced at an appropriate premium over the Treasury bill rate and the central bank will publish a quarterly yield curve to provide guidance to the market.
    “With the introduction of this policy, the minimum deposit rate will no longer be used for interest rate guidance,” the CBB said.

    However, the banks said it would continue to stipulate a minimum savings rate for the savings accounts of private individuals and non-profit organisations – currently at 2.5 percent – to partially insulate small savers against the erosion of the value of their funds due to inflation.
    Financial institutions will be free to set all other rates, the CBB said.
    In a small, open economy like Barbados, the policy of targeting a deposit rate to guide the local availability of credit was weak because banks, firms and households went abroad to obtain funds.
    “In these circumstances, interest rate policy cannot fulfill its conventional role,” the CBB said in its working paper from last month, adding that changes in interest rates had little or no effect on inflation.
    In addition, domestic interest rates had to be kept in line with international rates to “avoid incentives for destabilizing inflows and outflows of capital,” the bank said, adding there was a longstanding view that keeping rates low to boost investment did not work because there was an incentive for an outflow of funds, “thereby starving the domestic system of investible liquidity.”
    In the future, the CBB will base its interest rate policy on two factors that will help it determine a notional policy rate, with an allowance for an appropriate spread: The trend in international interest rates and whether there is a need for a temporary inflow of finance to boost domestic liquidity.
    The CBB will use the three-month Treasury bill rate as the market-determined benchmark and other government securities would be based on this T-bill rate.
    “Where warranted, the Central Bank’s intervention in the T-bill market would signal to the market the need for interest rate adjustments, if there is a sustained change in the U.S. and domestic interest rate spread or if there is a continuous shortfall in T-bill auctions.
   

    www.CentralBankNews.info

Central Bank News Link List – Apr 5, 2013: BOJ’s Kuroda: monetary onslaught won’t cause asset bubbles

By www.CentralBankNews.info Here’s today’s Central Bank News link list, click through if you missed the previous link list. The list comprises news about central banks that is not covered by Central Bank News. The list is updated during the day with the latest developments so readers don’t miss any important news.

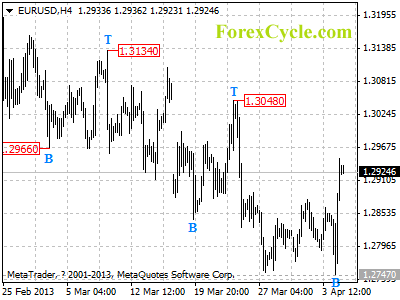
EURUSD bounces strongly from 1.2747

EURUSD bounces strongly from 1.2747, suggesting that a cycle bottom has been formed on 4-hour chart. Further rise to test 1.3000 key resistance would likely be seen, a break above this level will indicate that the downtrend from 1.3711 (Feb 1 high) has completed, then the following upward movement could bring price to 1.4000 zone. On the downside, as long as 1.3000 resistance holds, the rise from 1.2747 would possibly be consolidation of the downtrend, one more fall to 1.2500 area is still possible.

eurusd

Daily Forex Forecast

Only Lunatics Need Apply for This Stock Market Rally

By MoneyMorning.com.au

This is the worst we’ve seen the stock market in more than four years.

If you invest in shares, there’s only one word to describe you…you’re a lunatic.

If you’re not much keen on insults, don’t worry, we didn’t mean to insult you. It was a compliment. In fact, if you invest in shares today, you should embrace your lunacy.

Because thinking about things in a way that’s different from the rest of the crowd is the single best way to invest in shares.

Read on and we’ll explain what we mean…

The Aussie S&P/ASX 200 Index has taken a hammering over the past month, as the chart below shows:

The Aussie S&P/ASX 200 Index

Source: CMC Markets Stockbroking

Since the peak on 12 March the index has fallen 4.9%. That’s not such a big deal, seeing as stocks had rallied 25% between June last year and March this year.

But the not so funny thing is, while it was the dividend paying stocks that gained the most during that rally, it’s the growth stocks that are copping most of the slack as the market falls.

In other words, growth investors have got none of the gains and all of the losses. Not fair.

We’ve seen that with the stocks on our Australian Small-Cap Investigator buy list. Our biggest winners from the past six months are still sitting pretty, while the stocks that didn’t get the growth spurt have taken some of the biggest hits.

It’s a trend we’ve seen across the whole market

Not Game Enough to Ditch the Yield

That tells you something. It tells you that investors are still super nervous. It tells you that the interest rate play is still playing out.

For instance, Australian banking stocks have only dropped 2.9% since the 12 March high, compared to the broader index’s 4.9% drop.

This means that while investors may be cautious about the market, they’re not about to give up the 5%, 6% or 7% dividend yields that they’re currently getting from stocks.

After all, if they sell dividend stocks what will they do with the money? They’ll probably buy a fixed interest investment that’s only paying about 3–4%. That’s not a very attractive proposition from an income perspective. On an investment of $100,000 it could mean a difference of $4,000 per year.

As a result, investors are dropping the stocks that don’t pay a dividend — growth stocks. Even though those stocks were already trading at the best (cheapest) valuation they had been for more than four years.

But that’s the way markets can work. It now puts the broader market at the low end of what we expect to be a year of volatile sideways moves. That could put the growth stock rally on hold for another few weeks as investors look to snap up the dividend paying stocks that have given up a small part of their gains.

This brings us back to the point we made at the top of this newsletter — the lunacy of being a share investor.

With growth stocks seemingly going down the toilet, why on earth would you consider buying them now?

We’ll show you why now…

Dead Wood Out, Growth Stocks In

For the simple reason that the spread between Australian small-cap stocks (red line) and Australian blue-chips (blue line) is the largest since the creation of the S&P/ASX Emerging Companies index nearly three years ago:

Aussie small-caps and Aussie blue-chips

Source: Google Finance

A point will come (maybe today, next week, next month or in six months) when investors will want more than seemingly steady 4% or 5% gains from dividends. That’s especially so in the institutional sector where fund managers live or die based on their record compared to their peers.

A 5% return may cut it for three months, six months, or even a year…but not much longer than that.

That’s why at a time when only a lunatic would buy this market, we’re clearing out the dead wood and pouring all our resources into finding the Aussie growth stocks, trading at the cheapest valuations, that have the best chance of clocking up the biggest returns when investors shift from income to growth.

Cheers,
Kris

Join me on Google+

From the Port Phillip Publishing Library

Special Report: Australia’s Energy Stock BLOWOUT

Daily Reckoning: The Moment of Explosion

Money Morning: The Run-on Effect of Aussie Housing on the Australian Stock Market

Pursuit of Happiness: Why a PlayStation and Mining Technology Have More In Common Than You Think

Australian Small-Cap Investigator:
How to Make Money From Small-Cap Stocks

3-D Printing: The Industry That Will Change the World

By MoneyMorning.com.au

A massive manufacturing technology convergence is in its early stages at this very moment. Exponentially expanding computing power, artificial intelligence, robotics and advanced sensing technology will change the way we make everything.

Since prehistory, we’ve been working at finding new ways to make things. We started out, over a million years ago, chipping away at lumps of flint or obsidian in order to make axes, knives or arrowheads. Obsidian was so important that some of the oldest trade routes sprang up around it, and it might even have been the earliest form of money.

From the Old to the New

We’ve since learned to work with all kinds of other materials. A tribesman 50,000 years ago may have banged a stone against a piece of flint to make a knife. Today, we might use a computer-controlled blanking press to punch a knife out of a sheet of steel, with a drill and a grinder to put holes in the tang and an edge on the blade. However, the basic way we fashion things hasn’t changed that much.

I still remember my first job as a teen, building medical device components in a machine shop. We often worked metals like platinum and gold — and carefully swept up the precious leftover chips after a job was completed. We still transform most of the things we make much as we did during the Stone Age: by removing stuff from a piece of material in order to create the physical shape we desire.

Despite the manufacturing advances of the Industrial Revolution, the way we make things is largely the subtractive process it has always been. We still saw, mill and grind. Then we take the shaped bits and assemble them with glues, screws, welds and rivets.

A pharaoh’s armorer or goldsmith could walk into a modern knife factory and be bewildered by the machines operating there — but the basic physical procedures used to create useful objects are essentially the same.

That’s changing fast, due to an emerging technology called 3-D printing.

3-D Printing and The Z-Axis Transformation

Unlike subtractive manufacturing processes, 3-D printing is additive. It doesn’t make things by taking something big and making something smaller out of it. It takes something small — a thin layer of plastic, metal or even human cells — and, by adding successive layers, builds something larger out of it.

The basic 3-D printing concept is similar to that used by the 2-D printer you probably have next to your computer. Your printer deposits a thin layer of coloured material on a page, with a precision of several hundred ink dots per inch. The pattern, whether text or picture, is described by a digital file you generate with your computer, which tells the printer precisely where on x- and y-axes to place the dots of ink.

3-D printing takes that idea and extends it in an additional axis — the z-axis. By printing layer upon layer of material, a 3-D object can be constructed. The result? We can produce complex shapes undreamed of using traditional tools.

Like a traditional 2-D printer, complexity doesn’t matter when it comes to 3-D printing. Your printer doesn’t care if it is printing a single solid colour on a page or a copy of an artistic masterpiece.

In the end, all it prints is a pattern of dots on a page described in a digital file. A 3-D printer essentially takes this one step further. It places many ‘pages’ on top of each other to build a 3-D shape. The additional complexity comes at little or no additional cost.

Furthermore, there is little or no waste. Unlike a subtractive process, which removes material, which must then be discarded or recycled, the only material used is what is needed to build an object.

3-D Printing’s Promise Becomes Reality

The technology is already transforming how we make things. 3-D-printed components are now making their way into everything from aircraft to rocket ships. General Electric, for example, recently purchased a small 3-D printing company to produce jet engine parts. NASA, on the other hand, is using 3-D printing to manufacture metal components for rocket engines where traditional manufacturing techniques don’t work.

According to Ken Cooper, advanced manufacturing team lead at NASA’s Marshall Center:

Basically, this machine takes metal powder and uses a high-energy laser to melt it in a designed pattern. The laser will layer the melted dust to fuse whatever part we need from the ground up, creating intricate designs. The process produces parts with complex geometries and precise mechanical properties from a 3-D computer-aided design.

In addition, the process NASA is using reduces the manufacturing time by orders of magnitude, reduces cost and creates a stronger product.

3-D printing technology is even moving into the field of biotechnology. Innovators are developing bioprinters that can print cells like a common printer does with ink. The cells can be precisely placed to mimic the structure of a human organ.

The technology is currently beginning to see use in drug discovery and development. Unlike a cell culture, something that mimics the structure of an organ is likely to be a better test subject for a new compound. With sufficient refinement, this technology in the future could even be used to print entire organs, which would put an end to organ transplant waiting lists.

However, while this technology is still in the future, 3-D printing is making a dent in the biomedical field right now in other ways. It is, for example, replacing traditional methods for manufacturing dental implants.

With a 3-D printer, you could have a new custom crown made while you wait at the dentist’s office. Recently, a 3-D printing company received FDA approval for printed bone replacement implants. One patient had 75% of his skull replaced with a 3-D printed prosthetic. The technology is also being used for joint replacements.

3-D printing introduces an element of flexibility to the way we make stuff. Typical mass production techniques require a heavy investment in tooling, but the flexibility to change the end product isn’t always there.

With 3-D printing, all that needs to be changed is a digital file using computer-aided design software. That kind of flexibility is proving to be a huge boon to engineers, who can design a prototype on a computer and rapidly print out a copy.

This flexibility means that truly customized things are becoming a reality. 3-D printing allows anyone with a computer and an Internet connection to design, manufacture and distribute a product, without the need for an expensive factory.

Websites have popped up that allow customers to transmit a 3-D design file, which can then be printed for a fee. Users are making everything from custom smartphone cases to jewelry — and with consumer-level printers, they can now begin to do some of it at home.

Ray Blanco
Contributing Editor, Money Morning
 

Join Money Morning on Google+

From the Archives…

Why Dividend Stocks May Not Stay This Cheap for Long

29-03-2013 – Kris Sayce

Respect the Market Trend, but Don’t Expect it to Last

28-03-2013 – Murray Dawes

Silver ‘$100 Within Two Years’

27-03-2013 – Dr. Alex Cowie

11 Billion Reasons to Expect a 200% Move in Gold Stocks Within Months

26-03-2013 – Dr. Alex Cowie

You Want Proof the Stock Market’s Heading Up? Try This…

25-03-2013 – Kris Sayce

I’m Bullish on the Japanese Stock Market…Here’s Why

By MoneyMorning.com.au

The market is used to being disappointed by Japan.

Investors were clearly holding their breath as the new central bank chief, Haruhiko Kuroda, prepared to announce his big plans for jump-starting Japan’s market out of deflation.

For once, they needn’t have worried.

After Kuroda revealed the central bank’s latest decisions, the Nikkei 225 rocketed and the Japanese yen tumbled against the US dollar.

Clearly, it worked.

And the good news for investors in Japan is that this could be the final push needed to convince the wider market that this time, Japan really is on the comeback trail…

The Bank of Japan Proves Itself

So what did Bank of Japan boss Kuroda — already being described as ‘Japan’s Ben Bernanke’ — do?

The Japanese have been fiddling with monetary policy for so long that it’s hard to keep on top of all the bells and whistles in their system. The short answer is that Kuroda promised to ‘do what it takes’ to drive Japanese inflation up to 2%.

In itself, that was enough to get investors excited. Prime Minister Shinzo Abe had showed signs earlier this week of rowing back from the idea that the 2% target was readily achievable.

As for how it’s going to do it: well, firstly, the Bank of Japan will buy ¥7trn worth of bonds each month. That’s double what it currently buys, and a far bigger jump than the market had expected. In other words, it’ll do more quantitative easing (QE) than the market had thought.

Secondly, it has changed what it’s buying. On the bond side, it will be buying longer-dated government bonds (up to 40-year maturities). So long-term interest rates will be squeezed lower.

On top of that, it’s also going to increase its purchases of even riskier assets such as exchange-traded funds and real estate investment trusts. So it won’t just be using QE to buy government bonds. It’s also printing money to buy equities, albeit in relatively small amounts. (This sounds extreme but believe it or not, the BoJ has been doing this for a while.)

Thirdly, the BoJ has suspended its ‘banknote rule’. This was a sort of speed limit on QE. It prevented the BoJ from buying more bonds than there were bank notes in circulation. Apart from anything else, this shows the BoJ is serious.

As if all this wasn’t enough, Kuroda had the backing of almost the entire BoJ board. So there’s very little to stop him getting even more radical.

Why is This Different from What Ben Bernanke is Doing?

The point of all this is to get the Japanese economy moving again. In nominal terms (ie, without taking deflation into account), the Japanese economy is no bigger than it was in 1992, notes Peter Tasker in the Financial Times.

Meanwhile, the strong yen has been punishing Japan’s crucial export industries. Weakening the yen will boost exports. And encouraging nominal growth (even that driven by inflation) will help to improve the country’s debt-to-GDP ratio.

One reader raised a very good point the last time I wrote about this: how is this any different to what Federal Reserve chief Ben Bernanke is doing in the US?

The answer is: it’s not. And as far as I’m concerned, the jury’s still out on how much good QE actually does for the real economy. You can easily make the case that the (very fragile) US recovery is down to its more aggressive treatment of the banks, the fact that its housing market crashed, and the fact that it can exploit shale oil and gas.

But there’s one thing that QE does seem to do: and that’s boost asset prices. And with every other major nation in the world trying to trash or defend its currency, Japan can’t stand by any longer and let itself be the one that carries the fall-out.

What I also like about Japan is that even after the Nikkei 225 has risen by more than 40%, there’s still a lot of scepticism about the market. Investors clearly expected the BoJ to disappoint them. This may be the trigger that the sceptics need to convince them to join the party.

John Stepek
Contributing Editor, Money Morning

Join Money Morning on Google+

Publisher’s Note: This article originally appeared in Money Week

From the Archives…

Why Dividend Stocks May Not Stay This Cheap for Long
29-03-2013 – Kris Sayce

Respect the Market Trend, but Don’t Expect it to Last
28-03-2013 – Murray Dawes

Silver ‘$100 Within Two Years’
27-03-2013 – Dr. Alex Cowie

11 Billion Reasons to Expect a 200% Move in Gold Stocks Within Months
26-03-2013 – Dr. Alex Cowie

You Want Proof the Stock Market’s Heading Up? Try This…
25-03-2013 – Kris Sayce