Gambler’s Ruin: Playing The Numbers Game

A person that watches the movie “21” is greeted with the sight of a great plan to use math to bilk casinos out of their money. Based on a true story, these students were shown to be human calculators that simply played the numbers game at the blackjack tables to devastating effect. The first problem is the phrase “based on a true story”. That can mean any number of things, and like in the movie “21”, it does mean many things. They omitted little details such as the MIT team spending several months in the red and the high roller losing $120,000 in three hands. Thus, an unrealistic expectation was born.

But what is Gambler’s Ruin? It certainly does not sound very pleasant. A little bit of hunting around finds the definition to be something along the lines of the following, paraphrasing:

“Gambler’s Ruin is the idea that a player with a finite amount of money will eventually lose everything to a player with an infinite amount of money given a long enough period of time.”

Quite a few people look at activities like blackjack, poker, or market investing as gambles. They do not view these activities as the highly mathematical beasts that they are. The exceptional poker player is not just throwing cards and hoping to get a good hand. Instead he is paying attention to what is already on the table, what the other players are doing, and formulating the odds of getting the cards he needs to produce a winning hand. If he does not feel his odds are at a comfortable level, he cuts his losses and folds out of the hand. Granted, he loses his ante money and whatever was already bet; but that is still preferable than trying to compete in a race he already lost.

For just a moment, consider the relationship between the investor and the stock market. The investor is a player with a finite amount of money. The stock market is a player with an infinite amount of money. What is going to happen according to Gambler’s Ruin? Eventually, the investor will lose everything to the stock market given enough time.

That does not happen often though, does it? Plenty of people participate in the stock market and walk away with dollars in their pocket. Why? These savvy investors equip themselves with the knowledge they need to identify when it is time to step into the game. More importantly, they are able to identify when to fold, or step back out. That methodology requires a calm, collected strategy with a solid basis on the foundation of what it is to gamble or invest.

The investor that simply shoves their money into an investment with no understanding of the performance, any idea of predictions for it, or an idea of how to gauge success and failure has already lost. They are throwing away their money. That person might as well pour their money into a hearth and burn it. At least doing that will provide some heat for a few minutes.

Effective gambling and investing is not about blind luck. It is about considering your probabilities and attempting to strike while the iron is hot. Minimize your losses by trying to maximize the favourable circumstances you have established before setting foot into the arena.

Investing can be a bit more difficult to prepare for. Ideally, you will want to have a good grasp of what is going on with whatever you are investing in. Find reliable news sources and proactively look for new developments that might have an affect on your investment. As a general example in the forex market; a person that invests in USD pairs is going to be very interested in hearing things such as plans for economic growth, announcements from the Federal Reserve, employment rates, and then information on whatever the second half of their pairs are. All of these things and more matter for the USD value.

The other side of the coin with Gambler’s Ruin is the idea of time as an equalizer. Eventually, time is going to level the playing field and then losses will build. Avoiding those losses is done by stepping out of, or folding from, the game before they mount too high. There is no reason to step straight into a bad run. If your market pairs have been trending weakly just bide your time. Step into the game when it is beneficial for you.

The only people that take blind chances in the market or gambling are people that have already lost. They will soon be parted from their money and hopefully learn a valuable lesson from the experience. Don’t be mistaken, you will lose money. The difference is in how you are losing your money. Do you want to be the player that sacrifices his buy in, knowing that things are taking a turn for the worse? Or, would you rather be the player who is left sitting in a state of shock, wondering how he managed to lose?

Know how you are going to win, lose, and prevent major losses before ever playing the game; else Gambler’s Ruin will steal away your wealth too.

About the Author:
This article was written by Sean Reilly from MahiFX, Forex Trading Platform Specialists. Sean writes about Forex on a number of other sites, and is passionate about helping people understand the psychology of trading.


The U.S. Dollar Retreats, the Japanese Yen Plummets

EURUSD – The EURUSD Consolidating Above 1.3020

eurusd09.04.2013

The EURUSD has entered a consolidation phase. The pair managed to increase and stay above the 1.3020 resistance, though it happened during the Asian session which was pretty quiet. However, the 20-day MA crossed the 50 and 100-day moving averages upwards on the 4 hour chart and this time, it will be the support level which currently runs at 1.2956. The loss of this support would weaken the pair bulls and its drop below 1.2880 would mean the downtrend resumption.

GBPUSD – The GBPUSD Decreases to Support 1.5240

gbpusd09.04.2013

The GBPUSD was also consolidating yesterday, but it was decreasing at the same time that was first influenced by the upward correction in the EURGBP. Thus, the pair moved away from the 1.5363 high reached on Friday and dropped to the support level at around 1.5240. The GBPUSD should consolidate above 1.5240-1.518 in order to continue the upward correction. Its drop below the last level, where the 100-day moving average runs on the 4-hour chart at the moment, would mean that the bears handle the situation.

USDCHF – The USDCHF Approaches Figure 93

usdchf09.04.2013

After Friday’s decrease to 0.9312, the USDCHF pair continued trading just above that level. The rate’s fluctuations on top are limited by the resistance at 0.9360. Thus, the pair bears managed to keep it below that level which had been the support before it decreased and thus, it is a negative factor for the bulls. The level of 0.9290, where the 100-day moving average runs on the daily chart, is likely to become another reduction target for the pair. Its decrease below would worsen the pair’s outlook.

USDJPY – The USDJPY Sets Fresh Highs

usdjpy09.04.2013

As expected, the USDJPY continued hiking. This time, the pair has reached the resistance at 99.64 and pulled back to 99.11. Obviously, the Japanese currency is in the midst of a downtrend and the pair bulls cannot but be limited by the 100th figure. There are the 100.40 and 101.45 levels above it, the latter is the high of April 2009. Thus, the pair came close to the critical levels and the RSI on the 4-hour, daily and monthly charts has entered the overbought zone, but it is still there on the weekly chart. Consequently, it is wise to refrain from purchases at current levels – they are quite risky. The nearest potential target of the downward correction is the 96th figure.

provided by IAFT


Strong Gold Demand in Asia “Should Offset” ETF Selling, But More Banks Slash Forecasts

London Gold Market Report
from Adrian Ash
BullionVault
Tues 9 Apr, 08:55 EST

The PRICE of GOLD and silver was little changed Tuesday morning near last week’s finish,
while European stock markets rose but Japan’s Nikkei stalled its 5-day surge as the Yen
bounced higher from 4-year lows on the currency market.

Silver prices ticked higher to $27.40 per ounce, while gold regained $1574.

Energy and industrial commodity prices also edged higher. Major government bonds eased
back, nudging up the interest rate offered to buyers.

The US Treasury will this week auction $66 billion in new debt, according to Bloomberg
data.

“The [quantitative easing] actions of the Bank of Japan are having a profound effect on bond
yields,” notes the commodities team at Standard Bank today, “across especially emerging
markets.”

Because the BoJ’s promise of $1.4 trillion in new money creation by 2015 is weakening the
Yen, sats Standard Bank, “some gold-consuming countries, such as Thailand, [are] seeing
their currencies stronger against the Dollar.”

So “there’s been fairly strong gold buying interest from South East Asia…which should partly
offset the ongoing ETF liquidation.”

China’s net imports of gold through Hong Kong doubled in February from January’s 3-month,
new data showed today, rising to more than 60 tonnes.

New York’s $61-billion SPDR Gold Trust meantime ended Monday with the quantity of
bullion backing its shares unchanged from Friday’s new 21-month low of 1205 tonnes.

“Physical demand [has been] offset by professional investor liquidation,” says the latest
quarterly review from German refining group Umicore.

Swiss bank and major bullion dealer UBS today cut its average 2013 gold price forecast from
$1900 to $1740 per ounce.

“We continue to expect the price of gold to moderate over the year ahead,” says a note
from Australian retail bank NAB, forecasting a 2014 average of $1410 and citing economic
recovery and lower risks in the developed world.

“Partly offsetting this is our expectation for central bank purchases by the emerging
economies [plus] continued strong consumer demand from India and China.”

Germany’s Deutsche Bank today cut its 2013 price forecast by one eighth to $1637, saying
that the forces pushing gold prices higher over the last 10 years “have all moved into
reverse”.

Danske Bank analysts are more aggressive, cutting their 2013 gold price forecast below
$1500 and targeting $1294 per ounce for next year.

“Gold is in our view still in bubble territory,” they write, “despite the extended price drop
seen since the autumn [and] the signs of global currency war earlier in 2013.”

Commenting on the price action in gold, “I can say the chart doesn’t look good,” Reuters
quotes a Hong Kong trader at Lee Cheong Gold Dealers.

“I think $1585 is the crucial point. If it can break above this level, another bull run or short
covering will push up the market to $1600.”

Reviewing the relative moves in gold and silver meantime, “The gold/silver ratio’s
rally picked up the pace last week,” says technical analyst Axel Rudolph at Germany’s
Commerzbank.

The number of silver ounces you can buy with one ounce of gold “has so far reached 57.85,
a nine-month high,” Rudolph goes on. If the peak of 58.72 from June 2012 is broken, he
says, “the psychological 60.00 region will be targeted as well.”

Adrian Ash
BullionVault

Gold price chart, no delay | Buy gold online

Adrian Ash is head of research at BullionVault, the secure, low-cost gold and silver market
for private investors online, where you can buy gold and silver in Zurich, Switzerland for just
0.5% commission.

(c) BullionVault 2013

Please Note: This article is to inform your thinking, not lead it. Only you can decide the best
place for your money, and any decision you make will put your money at risk. Information
or data included here may have already been overtaken by events – and must be verified
elsewhere – should you choose to act on it.


Real Forex Market News 9.4.2013

Forex Daily review brought to you by REAL FOREX | www.Real-forex.com

Forex market news EUR/USD
Date: 04/08/2013 Time: 18:44 Price: 1.2996
Strategy: Short / Long
Graph 4 hours
Quote previous review:
The pair continues to range between the levels of 1.2750 to 1.2880 when an outbreak of thesewill take the price at the first stage towards the next resistance level of 1.3000. However, breaking the level of 1.2750 will take the price towards further downward movement continuation.
Current Review today:
The price broke the level of 1.2880, topranging level. Indeed, as written in the last market forecast, the price has achieved the level of 1.3000, which makes ita ranging balance level. A continuation of the upward movement will most certainly lead to price level of 1.3114, used also as a Fibonacci correction level of 38.2% on thelast downwards move described by black broken line. On the other hand, blocking the upward movement in the current levels, will take the price tocorrect this process between one third and two thirds on the Fibonacci bar, meaning, that it is moving towards the average area of the Bollinger bands.
You can see the graph here:
eur/usd
Forex market news GBP/USD
Date: 04/08/2013 Time: 22:00 Price: 1.5252
Strategy: Short / Long
Graph 4 hours
Quote previous review:
Price is currently in the middle of a Range between the levels of 1.5070 to 1.5261. Breaking of this high level of 1.5070 is proven and it is reasonable to assume that another price decreased will appearto the range near the low level of the last ranging levels. However, a price breakthrough is proven on the level of 1.5261 and islikely to rise to the level of 1.5422, a level which is also a technical correction of a 38.2% on the decline during the last move described by the blue broken line.
Current Review today:
The pair broke the high ranginglevel of 1.5261 and now is going down to check whether this level can switch roles from a resistance level to a support. If so, it`s likely,to be destined towards the nearest price level of 1.5422, which is a Fibonacci correction level of 38.2% on thedownwards move described by crushed red line.When an outbreak of thiswill appear,it reasonable to assume, that the price will climb back to the level of 1.5600, a Fibonacci correction level which is I. 50% of the downward movement above. On the other hand, only a drop of the price below two-thirds mightcorrect the recent upward movement (described by the blue broken line) and return the pair to a bearish movement at thistime resolution.
You can see the graph here:
gbp/usd

Central Bank News Link List – Apr 9, 2013: Bernanke says stronger banks bode well for U.S. growth

By www.CentralBankNews.info

Here’s today’s Central Bank News link list, click through if you missed the previous link list. The list comprises news about central banks that is not covered by Central Bank News. The list is updated during the day with the latest developments so readers don’t miss any important news.

Move Over Warren Buffett, Here’s the New Golden Rule for Investing

By WallStreetDaily.com

In yesterday’s column, I debunked the myth that the stock market is long overdue for a pullback.

You might not believe it, but it’s true!

That being said, I’m afraid many of you walked away thinking that it’s simply a matter of (more) time passing by before a pullback or correction materializes.

That’s not the case, though.

You see, the mere passage of time doesn’t usher in pullbacks. It takes something specific to trigger them.

Or, as Deutsche Bank’s David Bianco says, dips might be inevitable, but “they don’t happen in absence of bad news or emerging risk.”

And right now, there are no emerging risks on the horizon. Don’t just take my word for it, though.

“We’ve got low inflation, improving domestic and global trends, [an] accommodative Fed, and it all adds up to a package that is a constructive backdrop for equities,” says Jim Russell, Senior Equity Strategist at U.S. Bank Wealth Management.

Indeed. That only leaves really bad news as a possible catalyst for a pullback or correction. So what type of bad news could ultimately trip up the stock market?

The opposite of what’s propelling it higher, of course!

Don’t Forget the Golden Rule

Forget a 5% pullback or a 10% correction. Some pundits and investors believe we’re in store for a massive 25% meltdown.

Fear mongers! Or maybe they’re just afraid of violating Warren Buffett’s golden rule of investing to “never lose money.”

Whatever their motivation, it doesn’t matter. The reality is, it’s going to take a sudden drop in corporate profits to collapse the stock market.

After all, stock prices ultimately follow earnings. I know I’ve told you that countless times already. But I’m afraid many of you still don’t believe it.

Maybe you just need to hear it said differently? If so, consider Larry Kudlow’s phrasing: “Profits are the mother’s milk of stocks.”

Too National Geographic for you? Ok. On second thought, maybe you just need additional proof.

Well, here it is, courtesy of Dr. Mark Perry at American Enterprise Institute (AEI).

As Perry explains, a one-to-one relationship exists between stock prices and after-tax corporate profits. For every increase of $1 billion in profits, the S&P 500 rises about 1 point. That is, with two notable exceptions: the dot-com bubble and the Great Recession.

As you can see, stock prices got too far ahead of corporate earnings during those periods. Sure enough, the market restored the relationship between corporate profits and stock prices by collapsing.

Or, put simply, stock prices ultimately followed earnings.

Here’s why all this matters…

According to Perry, “In the current bull market rally… corporate profits are consistent with stock market levels.” So the one-to-one relationship is in full effect. And that means there’s nothing abnormal about the current bull market. Corporate profits are driving stock prices.

By extension, as long as corporate profits keep increasing, stock prices should, too. And that’s exactly what analysts expect to happen…

After rising for more than three years, the consensus estimate calls for profits for S&P 500 companies to keep climbing to hit a record of $109.30 this year.

Bottom line: Absent a sudden drop in corporate profits – or the Fed unexpectedly pulling the plug on its quantitative easing initiatives – a pullback or correction is not going to magically materialize.

Stay tuned for tomorrow, though. I’ll share three key metrics to help you detect any deterioration in earnings – well ahead of the average investor.

Ahead of the tape,

Louis Basenese

Article By WallStreetDaily.com

Original Article: Move Over Warren Buffett, Here’s the New Golden Rule for Investing

Gold Bulls About to Win the War

By MoneyMorning.com.au

If you’ve ever thought about buying gold, but never quite got round to it — in the space of a week, the market just gave you three huge reasons to ‘back up the truck’.

The incredibly bullish set up is at direct odds with the poor price performance, which saw gold dip as low as US$1540 last week.

This dip in the price is our friend: after all we’re meant to buy gold ‘on the dips’.

So when gold pulled back last week, I put my money where my mouth is…

Here’s part of the latest addition to the Cowie retirement fund:

Buy Gold

And if it gets cheaper still, I’ll buy more.

Let me explain what I’m seeing that makes me think a turning point is getting close…

What to Do When Investment Banks Say Sell

Back in late 2008, institutional analysts were tripping over themselves to downgrade their forecasts on gold…right before gold started a 180% rally.

The fact is that consensus institutional forecasts on gold have been consistently wrong for the last ten years. You could trade gold perfectly by doing the exact opposite to what the big investment banks recommend.

In other words, when they say ‘sell’…you should buy.

So it’s exciting to see more and more big banks are calling gold a ‘sell’.

Last week, the gold forecast that got all the attention was from Societe Generale (SocGen), a French multinational banking company with a market cap of around $20 billion.

They called for gold to drop to $1375/ounce.

Frankly I’m surprised that the market paid so much attention to the SocGen report. But it popped up across the mainstream financial media, as well as financial blogs and other newsletters. It was emailed to me about twenty times.

Most commentators quoted it as though it was gospel! Yet no one seems to have checked out SocGen’s insanely bad track record on gold…

I’d like to share with you what I wrote about this in a snippet from the Diggers and Drillers weekly update from last Thursday:


‘The 27 page [SocGen] report was called ‘The end of the gold era’, making the case for gold to fall as far as $1375/ounce.

‘Everything about today’s gold market reminds me of late 2008: the fundamentals, the technicals, the bearishness, the institutional downgrades, and the market action.

‘And now we have Jesper Dannesboe, who co-authored this week’s Soc Gen report, who also got it tragically wrong back in 2008. I’ve dug into the archives for you to show you what he was saying back then.

SocGen sell to be a contrarian indicator to buy again?

Oct 31 2008Context: Eight days after gold bottomed out at an intraday low of $680, and at the start of a monster rally that took gold to $1920 over the next three years:

‘The most likely scenario for gold is it goes down a lot, especially if it is trading at historically high levels … Because the fears of inflation will be replaced by fears of disinflation and that is a killer for gold … I think gold is going below $600 in this cycle.’ Source

Nov 18 2008Context: Gold was at $740, and would jump 11% to $820 within a week:

‘The bullish story on gold based on fears of inflation is dead,’ Source

Jan 6th 2009Context: Gold was at $840: 24% above its intraday low of $680, and at the start of a three-year rally that would see gold gain 182%.

‘Gold should be sold into rallies’ Source


‘Well…there were three years of rallies to sell into, which should have been plenty! This is what SocGen’s calls look like on the chart.

SoGen Gold

Source: stockcharts


‘Then last year they called gold to soar to $8500, and it fell.

‘So, their latest call for gold to fall could well be the best reason to buy that we’ve had so far!’

In short — SocGen taking another swing against gold with the same weak argument that it had back in 2008 is a clear warning signal that a rally could be imminent.

Since I wrote the above, the guys at Sprott Asset Management took SocGen’s argument to pieces. Part of their rationale brings me to the second big reason to start buying gold now.

(NB: you can watch my recent interview with legendary investor, Eric Sprott, by taking out a subscription with any Port Phillip Publishing paid investment service. Check out our latest offer here… )

You see, last week we heard that the Bank of Japan will DOUBLE their balance sheet over the next few years.

Where This Goes, Gold Follows

This is quite simply a game changer for the entire market: everything from bonds to foreign exchange, commodities, and equities.

But it’s gold I want to focus on today. There is a tight relationship between gold and the collective size of central banks’ balance sheets.

As balance sheets swell, gold rallies. You can see how closely the two track each other below in the chart from the guys at Sprott Asset Management.

Gold Moves With Central Bank Balance Sheets

Global Central Bank Assets Vs Gold Bullion

Source: Sprott Asset Management

Right now the major central banks have $9 trillion on their books — and Japan wants to add $1.4 trillion to that number by the end of next year.

If the relationship holds true, this would convert to a 15% increase in the gold price.

But hang on…didn’t we use the same rationale about the US Fed last year? Wasn’t the growth of their balance sheet meant to push up gold?

Well, the Fed has bought $85 billion worth of US Treasuries and mortgage-backed securities a month, and gold has gone nowhere fast. But you’ll get your explanation if you look closely at the chart above. You’ll see that the total balance sheet has actually pulled back slightly in the last few months.

Surprisingly, it’s because the European Central Bank’s (ECB) balance sheet has in fact shrunk by 10% this year.

This would explain why gold has had a rough start to the year. The ECB’s contraction cancelled out the Fed’s expansion.

However, the ECB’s balance sheet has stabilised now, and with Slovenia and the Netherlands lining up to be the next Cyprus, it could be on the way back up very soon.

Even if it shrunk at the same pace again, it would be easily exceeded by the combined growth in the balance sheets of Japan ($75bn) and the US ($85bn) of $160 billion/month.

Assuming no change from the ECB, and that the Fed and the Bank of Japan keep going at the current pace for another two years, this would equate to a balance sheet expansion of $3.8 trillion. This would add over 40% to the current global balance sheet of $9 trillion. As gold moves so closely with this, you could expect a roughly 40% rise in gold.

It’s dangerous to look exclusively at fundamental drivers, and ignore the positioning in the futures market.

And this is where we get the third major reason to buy gold today.

The Commitment of Traders Report

This report analyses the positioning in the futures market, which — right or wrong — determines the price, at least in the short-term.

And there is a keg of dynamite under the price here right now: there are a near record number of traders (‘managed money’) trying to short gold.

Just like journalists, these guys basically get it wrong every time. You can use them as a good contrarian indicator.

To show you their near perfect record of getting it wrong, I’ve highlighted (in red circles) the times they have stacked on the biggest short positions in the last five years. Then I’ve highlighted the corresponding periods on the gold chart (green circles on pink line). You can see that each spike in shorts has signalled a rally in gold.

Traders Shorting Gold — So Get Ready for a Rally

Managed Money Short Positions Gold

Take another quick look at the chart. The two big spikes in shorts back in 2008 preceded the three year rally in gold. And you can see that today’s short position is at far higher levels than back in 2008. It’s at record levels, and has been for a few weeks now. This is a highly explosive situation.

I suspect we’ll see volatility both ways at first as they defend their trade, but almost certainly this ends in a big move up.

Because there is a real chance these guys are going to have to ‘cover their positions’ if gold rallies just a little bit. Each trader doing this will raise the price, and cause another trader to follow suit. They are like a large group of mountaineers all tied together with the same rope. When one falls, the rest will follow in spectacular style. It would be enough to cause a massive move in gold.

Watching the gold price trending calmly down, you’d never imagine a war was waging below the surface of the market.

But a war it has been — and one that gold bulls are about to win.

Dr Alex Cowie
Editor, Diggers & Drillers

Join me on Google+

From the Port Phillip Publishing Library

Special Report: TORRENT SIGNAL 3

Daily Reckoning: Our Largest Asian Trading Partners Are in Trouble: China and Japan

Money Morning: A Better Inflation Bet Than Gold…Stock Market Investing

Pursuit of Happiness: Why the NBN is Dead Before it’s Begun

Diggers and Drillers:
Why You Should Invest in Junior Mining Stocks

The Eurozone Desperately Needs a Weaker Euro — and It’ll Get it

By MoneyMorning.com.au

Another weekend, another eurozone crisis. This time it’s Portugal.

The doughty little country has managed to stay below the radar for a surprisingly long period of time. Given that tiny countries — like Cyprus — can still cause tremendous headaches for the eurozone, that’s an achievement.

It’s come about primarily because Portugal has been a ‘good’ eurozone member so far, and taken its austerity medicine with gusto.

But now Portugal’s constitutional court has told the government that it’s taken austerity too far. On Friday night, it threw out plans to cut public sector wages and pensions, sending the government back to the drawing board.

The money will likely be found somewhere. But that’s not the point.

Portugal’s woes point to the next phase of the eurozone crisis — one that even the European Central Bank will find much harder to deal with…

What Portugal’s Court Ruling Means for the Eurozone

Portugal got a bailout deal from the eurozone two years ago. In return, it promised to get its budget back on track.

That hasn’t happened yet. By now, Portugal’s budget deficit (its annual overspend) was supposed to be back below 3%. That deadline has already had to be extended to 2015.

It looks like it’ll have to be extended again. The Portuguese constitutional court has just blown a big hole in this year’s budget. The government had aimed to save about €5bn this year.

The court has said that some of the cuts to state pensions and public sector wages are unfair. So the Portuguese government now has to find other ways to save about €1bn of that €5bn.

This in itself is not a huge problem. Portuguese prime minister Pedro Passos Coelho said he will do ‘everything to avoid a second bail-out’. So services, rather than wages, will be cut.

And Portugal was set to miss the 2015 target anyway. So this apparent lack of co-operation by the court gives Mr Passos Coelho a good excuse to ask for more time. Portugal has enough brownie points with the ‘troika’ (the eurozone bail-out committee) to have earned a sympathetic hearing.

So Why Does Any of This Matter?

Because it’s yet another sign that national politics in the eurozone is starting to seriously undermine regional politics.

Let’s remind ourselves of the basic problem in the eurozone. Germany is the region’s biggest economy. So it’s only natural that it’s going to have a big influence on monetary policy.

The way Germany sees it, all of the countries that have ended up in trouble are in need of reform. And it’s hard to argue with that. Italy, Spain, Portugal, Greece — they could all do with more flexible labour markets, and probably with more efficient tax systems, among other things.

The trouble with structural reform is that it’s painful and uncomfortable. It’s also politically unpopular. So countries will often only do it when their backs are against the wall.

So Germany doesn’t want the European Central Bank (ECB) to use monetary policy to give these southern Mediterranean countries an ‘easy’ way out. That would remove some of the incentive to reform.

(Germany doesn’t really like the idea of money printing in general either, as it’s the country most likely to suffer from inflation as a result of it.)

Again, on one level, it’s hard to argue with this. Why should Germany take the strain of bailing these countries out if they’re just going to go back to their old ways?

But you can see it from the point of view of the Italians and the Portuguese too. At the end of the day, isn’t it up to them — as sovereign nations — to decide if they prefer to run their economies as borderline basket-cases? Particularly if the evidence so far suggests that austerity isn’t really working for them?

It boils down to the problem that has always been at the heart of the euro project. You can’t have currency union without political union. And no one has ever made that clear to the voters in the eurozone. In fact, they deliberately hid that fact because they knew that no one would vote to give up their sovereignty.

But in the heat of the crisis, the true nature of the problem is becoming increasingly clear. Politicians in Portugal and Greece and Italy have been trying to make their countries more ‘euro-worthy’. But amid the pain this is causing, voters and national political bodies are rebelling.

Italy has no government. The Greeks only narrowly voted in a pro-euro party at the election last year. Now the courts have struck a blow against Portugal’s current government. How long will it stay in power?

This All Adds Up to One Thing — a Weaker Euro

The longer this is allowed to continue, the closer that voters will come to the truth of the matter: if they want self-determination, they have to leave the euro. That means that to protect the euro — which is ultimately its job – the ECB has to find a way to make life less painful for voters in the periphery countries.

People are scared of the unknown. And ditching the euro is definitely a leap into the unknown. It would probably be better in the long run for many of these countries. But in the short-term it could mean savings are destroyed and businesses collapse.

What the ECB has to do is to stop voters from getting so desperate that they decide a leap into the unknown is better than what they currently have.

The big problem is the German election in September. Once that’s over, Angela Merkel (assuming she’s still in power) will no longer feel the need to adopt such a hard line on austerity. But until then, she has to act tough, and talk tougher. So the ECB’s options are limited.

However, the ECB’s job is fairly simple. It boils down to keeping the euro weak. And the worse the various crises become, the more excuses it has to act. And assuming the euro is still around come September, I can see quantitative easing being launched as soon as politically possible.

In short, I don’t see the euro being allowed to strengthen far beyond where it is now (about 1.30 against the US dollar) this year. And I can see it eventually becoming much, much weaker.

John Stepek
Contributing Editor, Money Morning

Join Money Morning on Google+

Publisher’s Note: This article first appeared in MoneyWeek

From the Archives…

Only Lunatics Need Apply for This Stock Market Rally
5-04-2013 – Kris Sayce

The Run-on Effect of Aussie Housing on the Australian Stock Market
4-04-2013 – Murray Dawes

Good News in China’s Economy? Put This Date in Your Diary…
3-04-2013 – Dr Alex Cowie

‘Gold Only Rises During the Bad Times’ and other Fairy Tales
2-04-2013 – Dr Alex Cowie

On Gold — Billionaire Investor Eric Sprott Says : ‘I’m in Alex Cowie’s Camp’
1-04-2013 – Dr. Alex Cowie

How to Play the Deep Water Oil Boom

By MoneyMorning.com.au

A good technology company should sell products that pay for themselves. In other words, products should have a rapid payback period for customers.

In the oil drilling equipment business, technology should offer solutions that cut operating costs or enhance production at customers’ projects. Oil companies spend billions on large offshore oil and gas projects.

Typically, the deeper the project, the more money is spent. So any high-tech equipment that can cut costs or boost production can essentially sell itself.

A Clear Oil Company Leader

In the market for highly engineered offshore production equipment, FMC Technologies Inc. (NYSE: FTI) is the clear leader. FMC installed its first ‘full field’ subsea separation, boosting and injection system on Statoil’s Tordis field in the North Sea in 2007.

FMC increased recovery by an extra 35 million barrels of oil and extended the life of the field by 15 years. With a payback of an extra 35 million barrels, this sort of equipment pays for itself.

FMC Technologies Inc.

Deep-water drilling is a growth market, and FMC Technologies is investing heavily to capture a large share of the market. Tore Halvorsen, a senior VP of Subsea Technologies at FMC, recently explained FMC’s long-term vision to Bloomberg News:


‘Instead of all that up and down travel through the ocean, FMC Technologies wants to move those operations to the seafloor… There would be less need for the massive floating production platforms that can cost as much as $1 billion and contain tons of equipment.

‘Operating costs would drop with no need to ferry workers by helicopter to offshore sites, or house and feed them there, Halvorsen said. And the less equipment sitting at the top of the sea, the less vulnerable operations would be to hurricanes sweeping through warm seawaters during the summer.

‘With more equipment located at the seafloor and not tied into platforms, wells could be more widely spaced, draining the reservoir more efficiently, he said. And if processing is done at the seafloor, water would be separated and left behind, minimizing energy consumption and eliminating the problem of ice crystals plugging up pipelines in the cold waters below.’

Furthermore…

James West from Barclays, a leading oil service and equipment analyst, agrees that more offshore production and processing is likely to migrate to the ocean floor:


‘The main drivers of subsea processing include accelerating production, increasing recovery and extending field life, reducing [capital spending] on topside processing equipment and pipelines, improving flowline efficiency, and alleviating topside capacity constraints.’

Byron King, our geologist, recommended FMC four years ago. ‘It’s fair to say that without the equipment that FMC Technologies has invented and provides, the deep waters of the world would still be off-limits to energy exploration,’ Byron wrote. ‘Looking broadly at the subsea equipment business sector, there are only a handful of major vendors with the technical ability to build, supply and service this kind of equipment.’

A Play on a Growth Industry

There is much more potential upside for patient shareholders…

FMC’s equipment has pricing power; you can see it in FMC’s consistent profit margins – even during downturns.

The quality of FMC’s business shows up in its high average return on equity (ROE) over the past decade: 33%. A high ROE allowed FMC to grow revenues rapidly without stressing its balance sheet or increasing its share count.

FMC has a long history of conservative financial policies, and only recently borrowed a reasonable amount of debt to fund its 2012 acquisitions. Acquisitions helped round out FMC’s vision for underwater well processing, and broadened its offerings in the onshore shale drilling market.

FMC’s profit margins were down a bit in 2012, but this can be explained by management’s decision to hire and train its workforce aggressively to fulfil a $5.4 billion (and growing) backlog of orders.

The stock’s valuation is rich, but FMC is the type of company that can ‘grow into’ its valuation. With huge growth potential, FMC is an attractive stock to own – and buy on weakness.

Dan Amoss
Contributing Writer, Money Morning

Join Money Morning on Google+

From the Archives…

Only Lunatics Need Apply for This Stock Market Rally
5-04-2013 – Kris Sayce

The Run-on Effect of Aussie Housing on the Australian Stock Market
4-04-2013 – Murray Dawes

Good News in China’s Economy? Put This Date in Your Diary…
3-04-2013 – Dr Alex Cowie

‘Gold Only Rises During the Bad Times’ and other Fairy Tales
2-04-2013 – Dr Alex Cowie

On Gold — Billionaire Investor Eric Sprott Says : ‘I’m in Alex Cowie’s Camp’
1-04-2013 – Dr. Alex Cowie

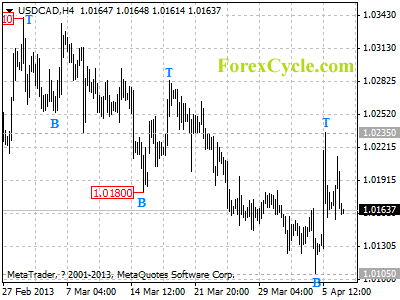
USDCAD had formed a cycle top at 1.0235

USDCAD had formed a cycle top at 1.0235 on 4-hour chart. Range trading between 1.0105 and 1.0235 would likely be seen in a couple of days. As long as 1.0235 resistance holds, the price action in the range could be treated as consolidation of the downtrend from 1.0341, another fall towards 1.0000 could be expected after consolidation, only break above 1.0235 could signal completion of the downtrend.

usdcad

Daily Forex Analysis