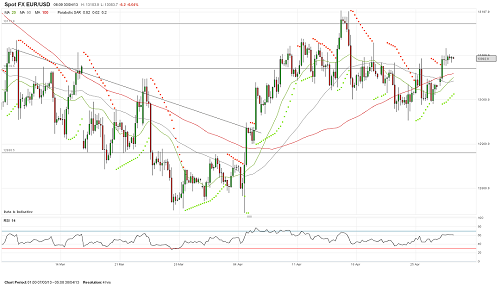
EURUSD – The EURUSD Increases Above 1.3070
This time, the EURUSD has a good start of the new trading week: the rate has increased above the resistance at 1.3070 and reached the level of 1.3116. The 1.3070 level is the support level this time, and the pair have managed to stay above it so far – this is a positive technical factor for the euro. However, weak dynamics of the pair gives reason to doubt the bulls’ ability to develop the upward movement and overcome the resistance around 1.3170 level, thus it will confirm the uptrend development. The decrease below 1.3070-1.3040 would jeopardize the support around the 30th figure.
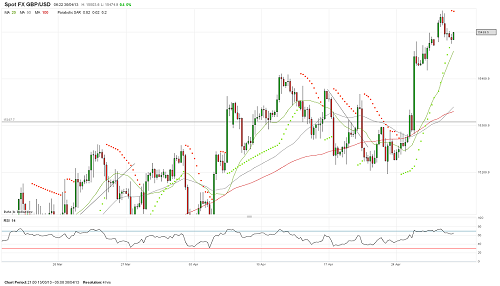
GBPUSD – GBPUSD: Support at 1.5485 Constrains the Bears’ Onslaught
The GBPUSD was slightly appreciated yesterday and tested the 1.5545 level, then returned to its original positions near the level of 1.5485. This support continues to carry out its functions, not allowing the air bears drop below. Thus, the pair is trading above the 20-day MA. In addition, the 50-day MA crosses the 100-day MA, even though the Parabolic SAR was higher than the price chart, the GBPUSD may continue increasing. This will be contributed by the fact that the pair is trading above the 100-day MA on the daily chart. The drop below the 54th figure would worsen prospects of the GBPUSD pair.
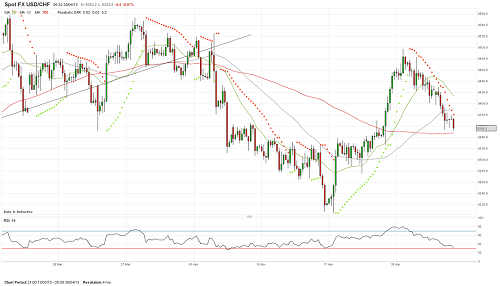
USDCHF – The USDCHF May Drop to 0.9218
The U.S. dollar continued to lose ground against the Swiss franc, which led the pair to the 0.9350 support, enhanced by the 100-day MA. The Parabolic SAR has bee conveniently located above the price chart, the pair is not oversold, thus the bears may test the major support at 0.9218. In turn, the decrease below the 94th figure has worsened the pair’s outlook and the bulls need to return above 0.9400 this time – this will give them an opportunity to test the 95th figure again.
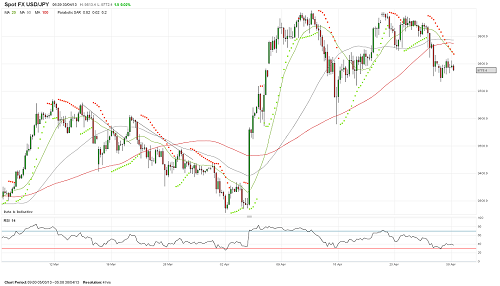
USDJPY – The USDJPY Keeps Trying to Develop a Downward Correction
The USDJPY dropped to 97.35, then returned to the level of 98.20, which limited the growth efforts. The whole day and during the Asian session, the pair was trading between these levels, having entered a consolidation phase. The 20-day MA has confidently crossed the 50 and 100-day moving avareges, the Parabolic SAR is above the price chart, thus the downward correction seems quite possible to continue. However, the bears need to break below 97.35 to make their correction dreams come true. Then, they will be able to count on the reduction towards the 96th figure.


