Infrastructure: The Best Investment Sector in India

By Harjeet

Infrastructural development mirrors the overall health of a nation’s economy. Physical infrastructure is directly proportionate to the growth and development of a country. The infrastructure sector in India comprising of roads and urban development, airports, energy, shipping and ports, and electricity has become a key driver of the Indian economy over the last five years.

The Government of India has always been quite forthcoming when it comes to the upgradation of infrastructure. There has been a strong focus on assuring effective implementation of associated projects though budgetary allocations, tariff policies, fiscal incentives, private investment sector participation and public-private partnerships (PPPs).

Infrastructure Development Finance Co (IDFC) Ltd has estimated that India’s spending on infrastructure is 8 per cent of the gross domestic product (GDP) as of March 2011 and it needs to be increased further to over 10 per cent of GDP by 2017 to sustain the growth targets.

Infrastructure sector in India is poised for a big leap and offers significant investment opportunities for US businesses and other investors.

Investment Opportunities for Non-Resident Indians (NRIs)/Person of Indian Origin (PIOs) in Indian Infrastructure

Global private equity (PE) funds looking for high return on investments are going to target Indian infrastructure companies in the coming years, says a report by research agency Preqin. As per the study, India is attracting the highest number of unlisted, closed-end funds that focus on a single country, making it the most preferred choice among emerging investment sectors in India.

Infrastructure PE funds investing in India can choose from sub-sectors such as power, telecom, roads and ports. The Preqin report says 74 per cent of India-focused funds will invest in greenfield projects, 84 per cent in brownfield assets, and 42 per cent will buy out the stakes of other PE funds.

India’s infrastructure sector will approximately entail an investment of US$ 1 trillion over the next five years, according to a report â Real Estate and Construction Professionals in India by 2020´ by realty consultant Jones Lang LaSalle. This includes work on the ambitious 7-phase National Highway Development Project (NHDP), India’s largest road project ever. Phase II, III and IV are under implementation. The Government through the National Highways Authority of India (NHAI) is using a variety of contractual structures in moving towards PPP in roads projects.

Investment opportunities for NRIs/PIOs exist in a range of projects being tendered by NHAI for implementing the remaining phases of the NHDP – contracts are for construction or Built-Operate-Transfer basis depending on the section being tendered. Over US$76 billion investment is required over the next 5 years to improve road infrastructure and Road sector investments expected to grow at 19 per cent per annum.

It is also estimated that about 97 million jobs would be created over 2012-22 across different investment sectors in the country due to which, India would potentially need to build an average of 8.7 billion square feet (sq. ft.) of real estate space every year, as per a report by prepared for Royal Institution of Chartered Surveyors (RICS). This would be a great attraction for NRIs/PIOs looking for opportunities to invest in the infrastructure segment.

About the Author

Harjeet is an Indian – born mass-market novelist, who covers the world internet related topics. He writes columns and articles for various websites and internet journals in the domain of Investments and Investing in India.


Colombia cuts rate on weak growth, no inflation pressure

By www.CentralBankNews.info     Colombia’s central bank cut its benchmark intervention rate by another 25 basis points to 3.75 percent, it’s sixth rate cut since July, saying the economy is still growing below potential and inflation is below the bank’s target with no upward pressures looming.
    Banco de la Republica Colombia, which has cut rates by 150 basis points since it embarked on an easing cycle in July 2012, said average core inflation and inflation expectations were below the long-term average of 3.0 percent and inflation had slowed more than expected.
    “The slowdown in inflation, which was higher than expected, has occurred in the context of a negative output gap, a situation that can keep inflation expectations at low levels for a longer period of time,” the bank said after a meeting of its board.
    “This also decreases the likelihood that unanticipated increases and supply shocks jeopardize compliance with the inflation target,” it added.
    Colombia’s inflation rate fell to 2.0 percent in January from 2.44 percent in December, with markets expecting the bank to cut rates following statements by the bank’s governor that he wanted to get inflation back to the midpoint of the bank’s target and minutes from the January meeting – when the bank also cut rates – pointing to further rate cuts.
    The central bank targets inflation of 3.0 percent, plus/minus one percentage point.
    Colombia’s economy contracted by 0.7 percent in the third quarter of last year from the second quarter for annual growth in third quarter Gross Domestic Product of 2.1 percent, down from 4.9 percent in the second quarter.
    Indicators show that private consumption in the fourth quarter grew slightly less than in the previous two quarters with the bank estimating GDP growth of 3.3-3.9 percent with uncertainty around investments in engineering and construction still high.
    Activity in the first quarter of 2013 will be affected by fewer working days as well as supply shocks in coal exports and lower demand from Venezuela, the bank said.
    Earlier this month, the bank’s governor, Jose Uribe, said inflation in 2013 would likely be below 2.44 percent and the economy would expand between 2.5 and 4.5 percent.

    www.CentralBankNews.info

Kris Sayce’s Money Weekend Market Digest: 23 February 2013

By MoneyMorning.com.au

ENERGY

The New South Wales government has placed a ban on coal seam gas exploration within two kilometres of a residential area. As we wrote in our weekly update to Australian Small-Cap Investigator subscribers,


‘…you’d think that given the state of the government’s finances they would be keen to promote anything that can provide jobs, income and potentially exports.’

According to the green movement, all fossil fuels are bad. They pollute the environment, cause greenhouse gasses, and poison the kiddies. That’s why the green movement prefers renewable or replaceable energy. Such as biofuels.

But hang on a minute. What’s this from New Scientist?


‘Say goodbye to the grass. The scramble for biofuels is rapidly killing off unique grasslands and pastures in the central US.

‘Christopher Wright and Michael Wimberly of South Dakota State University in Brookings analysed satellite images of five states in the western corn belt. They found that 530,000 hectares of grassland disappeared under blankets of maize and soya beans between 2006 and 2011. The rate was fastest in South Dakota and Iowa, with as much as 5 per cent of pasture becoming cropland each year.

‘The trend is being driven by rising demand for the crops, partly through incentives to use them as fuels instead of food.

‘The switch from meadows to crops is causing a crash in populations of ground-nesting birds.’

(Ed Note: It’s worth pointing out that North and South Dakota contain some of the world’s largest shale oil and gas reserves. So is it possible the research is tainted? We don’t know, but we thought it’s worth mentioning.)

The important thing to remember is that everything has pros and cons. It’s pretty much impossible to eliminate the cons. What you have to do is manage them. Even ultra-green energies such as wind energy and solar power have cons. Because they are less efficient than coal, oil, gas or nuclear, you need more solar panels and wind farms.

That means setting aside more farm land for energy use, which means lower crop production. Or even worse, in order for farmers to keep crop yields high they need to use genetically modified food – another enemy of the green movement. To be honest, we’re not keen on GM food either, but that’s why we prefer farmland to biofuel land.

GOLD

In his latest issue of Diggers & Drillers, our old pal Dr Alex Cowie introduced his readers to two new proprietary indicators. He uses price action and the 200-day moving average to pinpoint the optimum time to buy, hold or avoid gold and gold stocks.

He says about his indicators:


‘They’re not fool-proof, of course. Nothing is. But let me show you why I think they’ll be helpful at timing the gold market in 2013.

‘The old mantra goes, ‘Buy on the dips.’ And I have designed this index to help you do exactly that. To be precise, it works out where the Australian gold price is in relation to the 200-day moving average, expressed as a percentage.

‘Roughly speaking, this tells you whether gold is cheap, expensive, or fairly priced, relative to a long-term average price.’

At the time he revealed the indicator, it pinpointed Aussie dollar-priced gold as a ‘Good Buy’. But there was still potential for the price to fall further, moving it into the ‘Strong Buy’ category. That’s exactly what has happened as the price has fallen nearly $100 in just a few weeks:

Source: Diggers & Drillers


The Doc says gold (and gold stocks) is great value at this level…and we couldn’t agree more.

TECHNOLOGY

This week we highlighted a few technology stories on our Google+ page (don’t forget to check it out if you haven’t already). One of the stories was the Google Glass (or Google Specs as we prefer to call it).

Google is marketing smart eye glasses. The idea is that you’ll be able to wear these specs that will have a built-in camera and a display screen on the lenses that will allow you to view specific images.

For instance, imagine you’re driving somewhere and rather than fiddling about with your mobile phone or in-car navigation system, you can just follow the directions as they appear on your Google Glass…right before your eyes:

Source: Google


You can see the map image in the top right corner. That’s pretty much how you would see it if you wore a pair of Google Glass.

There are many other potential applications both social and commercial. A designer can look at an empty room while scrolling through design images on their Google Glass…a doctor can operate on a patient while seeing images of a scan taken before the operation to locate a specific problem.

There really is no end to the possibilities. Least of all, if it will mean people will look where they’re going as they walk along the street, well, then Google Glass is fine by us.

HEALTH

In an interview with the Life Sciences Report, Ram Selvaraju selects nine top stocks in the US biotech industry. They include:

Trius Therapeutics [NASDAQ: TSRX]
Galena Biopharma [NASDAQ: GALE]
Synergy Pharmaceuticals [NASDAQ: SGYP]
Pernix Therapeutics [NYSE: PTX]

MINING

The big mining news this week was the resignation of BHP Billiton [ASX: BHP] chief Marius Kloppers. But as our old pal Dan Denning noted in Wednesday’s Daily Reckoning:


‘Poor Marius Kloppers had unlucky timing. He replaced Chip Goodyear in July of 2007, just when everything started to go downhill for the world. Kloppers pursued some high-profile mergers and acquisitions. Some of them got done (on-shore US shale gas being the main one). And some did not. And now he’s leaving just when everyone says things are getting better.’

Maybe in six years we’ll say ‘Poor Andrew Mackenzie’…the new boss of BHP who takes over the role in May.

BHP shares have performed well since last July, gaining 23.5%. And they’ve doubled since the 2008 low. However, BHP is still down from the $50 mark it hit in 2011. So if we’re being simplistic about it, we could say that Mr Mackenzie has a 50/50 chance of getting a lucky break.

In order to get the break, Mr Mackenzie needs one thing to happen. It’s not a recovering China or US or Europe…BHP needs what every boom needs – a global credit boom. If that doesn’t happen, then it’s curtains for the Aussie resources sector.

Cheers,
Kris

From the Archives…

Four Things to Look Out for When Buying Gold Stocks
15-02-2013 – Kris Sayce

Here’s One Way to Eke More Gains from this Rising Stock Market
14-02-2013 – Kris Sayce

When Will the Inflationary Stock Boost End?
13-02-2013 – Murray Dawes

Gold Stocks: Back Up the Truck
12-02-2013 – Dr. Alex Cowie

The Next Surge in the Gold Price Looms: It’s Time to Buy Gold Now
11-02-2013 – Dr. Alex Cowie

The Gold Bull Market: Nothing Goes Up in a Straight Line

By MoneyMorning.com.au

Hi-ya, snap, biff, bang. Cop that, everybody. In US dollar terms, gold is dropping like a stone.

Last week, in our subscriber-only Scoops Lane update, Slipstream Trader Murray Dawes commented that, ‘Below US$1,645 I think gold is at risk of having a sharp fall to the low of the long term range at US$1,590.’

Since then, it’s broken even lower.

Over at The Denning Report, Dan thinks the potential low could be US$1,400. That’s his threshold for stepping in as a buyer.

A fall from gold’s high of US$1900 to US$1400 would be a drop of 26%.

It’s the task of today’s Money Weekend to explore if the gold bull market is over…

The Way Markets Work

If you caught last week’s Money Weekend you’ll know we talked about legendary investor Jim Rogers.

One thing he has consistently pointed out is a historical anomaly in the recent gold market: for twelve years (in US dollar terms), gold has not had a down year. Every year the price has been higher than the year before.

He’s studied a lot of markets. According to him, gold’s 12 year run is very, very unusual. Normally, you get periodic price declines.

If you’re a gold bull, it probably sounds strange to think gold would go down now. Nothing has really changed about the long-term case for gold.

But the price action says otherwise. And one thing we’ve learnt from Rogers is that’s the way markets work. It’s not unusual for an asset class to have a large correction during a bull market. We’re not talking about the small ups and downs of daily price movements. We’re talking drops in the range of 30-50%.

One example is gold in its last bull market.

During the 1970′s gold ran from $US35 an ounce to US$200. It then fell 50% over the next two years. Anyone who sold at the bottom would have watched it then go back up eight times to US$850.

The current bull market in oil includes the monster drop from US$150 a barrel in 2007 to under $US40 in 2008. Oil is now trading around US$100 again.

The bull market in US stocks from 1982 to 2000 included the Wall Street crash, when the Dow fell over 20% in one day.

And, of course, iron ore fell from its high in 2011 of US$187 to under US$100 by September 2012. It’s since recovered to trade over US$150. (Of course, if you’re following the China bull and bear debate here in the office, you’ll know that editors Alex and Greg obviously differ on how long it’ll stay up there.)

That’s all nice in theory, but not encouraging in the short term. But if you can view this as a normal correction in a long term bull market, the editors here think gold bullion presents a wonderful opportunity to step in and buy on a dip.

But is it a dip? As you know, there are markets that dip and rebound and those that dip and keep going down! Well, no one can ever be 100% certain of anything. But if you ask our resource expert, Dr. Alex Cowie of Diggers & Drillers, not only is a major move to the upside brewing in gold, but it could be sooner rather than later.

An Overdue Rally for Gold?

The basic case for gold is the same. Demand – from China, India, central banks, investors and the jewellery trade – is still on the rise. The outlook for major new sources of supply is still pretty weak considering the run gold has enjoyed.

Gold miners have had a tough two years in the market. The gold price has been consolidating. Their costs have risen, compressing their margins. Explorers and developers are finding it hard to raise money to fund their operations.

This in a time when high ore grades are harder to find. The biggest gold producing countries, Australia, South Africa and the US, produce less than they did in 2003, according to the CRB Commodity Yearbook. There’s one exception to that: China. But that gold stays in China.

That’s the big picture. But we invest in the here and now. Alex told Diggers & Drillers readers this week that the price action in gold is a bit misleading. The forward and futures markets hold the clues to the next move in gold. Why?

Alex wrote:


‘The most powerful signal in my eyes is the Gold Forward Offered rate (GOFO).

‘The GOFO is another measure of market liquidity, and is set to hit new multiyear lows. Over the last five years, the one-month GOFO has been a consistent warning sign of an imminent major move in gold. And importantly, these moves have been associated with outperformance in gold equities. And when GOFO turns back up, it’s the sound of the trigger being pulled to start the rally.’

A Gold Rally Coming?


Click here to enlarge

Source: Diggers & Drillers

You can see what he means in the chart. If Alex is right, gold will rebound and the higher price should rerate gold stocks.

The reality is trying to pick the exact bottom is impossible. And there’s no doubt it’ll take some confidence to hold or add to your position while the selling pressure persists.

In the meantime, we think it helps to remember this old investing adage:

‘Nothing goes up in a straight line.’

Callum Newman
Editor, Money Weekend

PS. Don’t forget if you want to keep track of the latest things we’re reading and brief commentary on events that happen through the day, check out our Google+ page here or Kris Sayce’s here.

From the Port Phillip Publishing Library

Special Report: How to Hunt Down 2013′s Biggest Stock Market Winners

Daily Reckoning: The Fed’s Funny Money is Losing its Mojo

Money Morning: The Biggest Crisis to Hit the Stock Market Since the Last One

Pursuit of Happiness: New Technology: Etched in Glass

Birdies, Bogies, and Billions – Social Mood Behind Golf and Global Investment Strategy

Birdies, Bogies, and Billions — Social Mood Behind Golf and Global Investment Strategy

Kevin Armstrong is a man with two passions: golf and investment markets. After picking up golf as a child in Scotland, he played the sport at Oxford University. He got into equity sales at Merrill Lynch immediately after graduating in 1981.

At Merrill, he learned technical strategy from Bob Farrell and discovered the Elliott Wave Principle. As a longtime subscriber to Robert Prechter’s analysis, Armstrong was an early adopter of socionomics. In 1996, he moved to the green acres of New Zealand, and began work as CIO and Chairman Regional Investment Committee at Australia and New Zealand Banking Group.

Hear how the socionomic hypothesis influenced Armstrong as he managed investment strategies on more than eight billion dollars of assets for the ANZ Group, and how social mood patterns show up not only in the markets, but in golf winnings, too:

Without publicizing it continually through the writings I did for the clients at the time, yes: social mood, [the] socionomic hypothesis greatly influenced the way we invested and what we and what we believe drove markets.

-Kevin Armstrong

Alongside his 30+ years in the markets, Armstrong maintains a single-digit golf handicap and is an accredited rules official in New Zealand. His new book, Bulls, Birdies, Bogeys and Bears, brings a historical perspective to the connection between golf and investment markets.

At the third annual Social Mood Conference, Armstrong will reveal the “historically deep and sometimes surprising interrelationship between the world’s two ‘Great Games'” from a socionomic perspective. Register now >>

If you would like to receive the free socionomics content each week, sign up here.

Gold Bounces in Asia on “Decent Demand”, But “Lower Conviction” Seen in Market

London Gold Market Report
from Ben Traynor
BullionVault
Friday 22 February 2013, 07:45 EST

THE U.S. DOLLAR gold price dipped back below $1580 per ounce towards the end of Friday morning in London, slipping a little after making gains earlier in the day, though it remains substantially down on the week following falls on Wednesday and early Thursday.

Silver meantime held above $28.80 an ounce for most of Friday morning, 3.4% down on the week, as European stock markets regained some ground lost yesterday. Commodities also edged higher while US Treasuries dipped.

“[Gold’s] recovery continued in Asia today amid decent demand,” says UBS analyst Joni Teves.

“It has been a welcome break from the persistent selling over the past week.”

Heading into the weekend, gold looked set for a 1.9% weekly drop by Friday lunchtime in London.

This would be gold’s second weekly drop in a row, after the metal fell to seven-month lows following Wednesday’s publication of the latest Federal Reserve policy meeting minutes, which show policymakers discussed the possibility of reducing the size of their ongoing quantitative easing bond purchases.

“After the Fed, people seemed to have a little less conviction that we are going to see indefinite low Dollar rates, which have attracted a lot of interest in commodities, especially precious metals,” one Hong Kong trader told newswire Reuters this morning.

“But the macro[economic] picture hasn’t changed tremendously and the underlying demand is still strong.”

“A [gold price] bounce driven by physical demand and/or short-covering over the next few trading sessions is possible,” counters a note from Credit Suisse, “but should be viewed as another chance to sell in our view.”

ANZ bank meantime has announced a cut in its 2013 average gold price forecast to $1690 an ounce, down from more than $1800. Based on afternoon prices at the London Gold Fix, the gold price has averaged just under $1660 an ounce so far this year.

The world’s largest gold exchange traded fund SPDR Gold Trust (ticker: GLD) continued to see outflows of gold bullion held to back its shares yesterday. A further 8.9 tonnes of gold was sold out of the GLD Thursday, making a total of more than 34 tonnes since a week ago – the biggest weekly outflow from the GLD in 18 months.

By contrast, the world’s biggest silver exchange traded fund iShares Silver Trust (ticker: SLV) saw weekly inflows in the week ended Thursday, adding 81.2 tonnes.

During last month’s Fed policy meeting, Fed chairman Ben Bernanke “minimized concerns that the central bank’s easy monetary policy has spawned economically-risky asset bubbles” according to a report today by Bloomberg, which cites “three people with knowledge of the discussions”.

Over in Europe meantime, economic sentiment and business conditions have improved this month, according to Ifo survey data published Friday. The Ifo  Expectations index also edged higher.

“All in all, today’s Ifo index nicely illustrates the green shoots in the German economy,” reckons ING economist Carsten Brzeski.

“Even if the current harsh winter weather might delay the blossoming out somewhat, growth should return, leaving the contraction of the fourth quarter quickly behind…the crisis is over. At least in Germany.”

Germany’s economy however shrank by 0.6% in the fourth quarter of 2012 on a seasonally adjusted basis, according to official data published Friday. The German economy is expected to grow by 0.5% during 2013, according to new forecasts published today by the European Commission, which previously projected 0.8% growth this year for Germany.

France’s economy is forecast to grow by 0.1% – down from 0.4% forecast three months ago – while the economy for the Eurozone as a whole is projected to shrink by 0.3%, with Spain contracting 1.4% and Italy shrinking 1.0%.

Bank of England governor Mervyn King met with People’s Bank of China governor Zhou Xiaochuan Friday to discuss the creation of a Sterling-Renminbi currency swap arrangement.

“London is growing rapidly as a center for [Renminbi-denominated] business,” said King.

“The establishment of a Sterling-Renminbi swap line will support UK domestic financial stability.”

The currency swap arrangement “cements London as the western hub for the fast-growing Renminbi market,” added Britain’s chancellor George Osborne.

Ben Traynor
BullionVault

Gold value calculator   |   Buy gold online at live prices

Editor of Gold News, the analysis and investment research site from world-leading gold ownership service BullionVault, Ben Traynor was formerly editor of the Fleet Street Letter, the UK’s longest-running investment letter. A Cambridge economics graduate, he is a professional writer and editor with a specialist interest in monetary economics. Ben can be found on Google+

(c) BullionVault 2013

Please Note: This article is to inform your thinking, not lead it. Only you can decide the best place for your money, and any decision you make will put your money at risk. Information or data included here may have already been overtaken by events – and must be verified elsewhere – should you choose to act on it.


Central Bank News Link List – Feb.22, 2013: There’s plenty of stimulus in the pipeline, says RBA’s Stevens

By www.CentralBankNews.info

Here’s today’s Central Bank News link list, click through if you missed the previous link list. The list comprises news about central banks that is not covered by Central Bank News. The list is updated during the day with the latest developments so readers don’t miss any important news.

AUDUSD rebounds from 1.0220

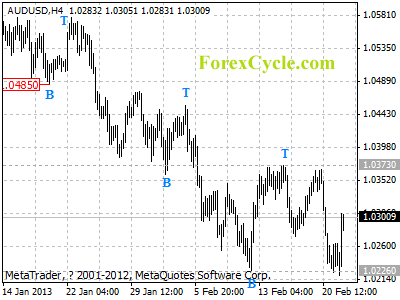
After touching 1.0226 previous low support, AUDUSD rebounds from 1.0220, suggesting that a cycle bottom is being formed on 4-hour chart. Further rise to re-test 1.0373 would likely be seen, a break above this level will indicate that the downward movement from 1.0597 has completed, then the following upward move could bring price to 1.0700 zone. However, as long as 1.0373 resistance holds, the price action from 1.0226 could be treated as consolidation of the downtrend, and one more fall to 1.0100 area is still possible.

audusd

Forex Signals

The Biggest Crisis to Hit the Stock Market Since the Last One

By MoneyMorning.com.au

What did we tell you a few weeks ago?

It’s impossible for the stock market to move up or down until the Wall Street whiz kids and mainstream media create a new catchphrase.

‘Debt ceiling’, ‘fiscal cliff’, ‘credit crunch’, and ‘Grexit’.

You’ve heard them all.

Each time one of those terms rears its head, the market falls. Then soon enough someone finds a ‘solution’ and stocks roar again.

Well, it looks as though we’ve got a new excuse for stocks to fall. And this one is the scariest of all.

It’s ‘The Sequester‘.

What does it mean and should you worry about it? We’ll let you know our view today…

For an explanation of The Sequester, here’s the Washington Post:


‘The sequester is a group of cuts to federal spending set to take effect March 1, barring further congressional action.

‘The sequester was originally passed as part of the Budget Control Act of 2011 (BCA), better known as the debt ceiling compromise.

‘It was intended to serve as incentive for the Joint Select Committee on Deficit Reduction to come to a deal to cut $1.5 trillion over 10 years. If the committee had done so, and Congress had passed it by Dec. 23, 2011, then the sequester would have been averted.’

In short, the US Congress and Obama Administration need to agree to cut a bunch of government spending, raise taxes, or both. If they don’t then it means a total of USD$85.4 billion in mandatory cuts spread across defence, discretionary spending and Medicare.

So, they’ve got just about a week to figure things out. Will they? Or will you see history repeat itself? Here, let us explain…

Stocks Fall Again, Will They Rise Again?

Yesterday the Australian share market dropped 118.6 points…or 2.3%.

Investors are worried. They’re worried the US Federal Reserve may turn off the money tap. If that happens the stock market will have to fend for itself.

Add that to The Sequester and you’ve got a recipe for a stock sell-off.

Now, we’re not about to say you should ignore this sell-off. No-one likes seeing their stocks fall. Your editor’s share portfolio fell 1.1% yesterday, so we feel it too.

But did we sell anything? No. And we’ve given the same advice to Australian Small-Cap Investigator readers.

As we said at the start, the market and mainstream investors are so insecure that they can’t buy or sell anything without an excuse. They need a big macro-economic disaster…and they need to give it a name.

They’ve done that before. So many times we’re bored of it. Here’s a chart of the US S&P 500 going back to 2007. We’ve overlaid data from Google Trends. The marks on the chart indicate the point at which each phrase reaches the peak in news headlines:

chart of the US S&P 500 going back to 2007
Click here to enlarge

Source: Google Finance, Google Trends

You remember the ‘Credit Crunch’. Headlines containing that phrase peaked in October 2008. The fear of a Greek exit (‘Grexit’) from the European Union peaked in May 2012.

And the Fiscal Cliff hit a crescendo in December…just before US stocks bagged a 9% gain in four weeks!

Each of these phrases has something in common – a short shelf life. The media reaches a frenzy, stocks sell-off and then…that’s right, politicians reach a bogus deal and the crisis is over…until the next crisis arrives.

Why This is Your Chance to Buy the Stock Market

That’s where we are with ‘The Sequester’. Use of the term has gone sky-high since the start of the year. Check it out for yourself on Google Trends (and sign up for Google+ while you’re there so you can follow our commentary throughout the day).

But we’re prepared to bet that you’ll see another eleventh-hour squib of a deal and they’ll avert the crisis…until the next time anyway. And you can guess what will happen then: stocks will take off, as we dare say part of the deal will involve more spending and/or more money printing.

And if we’re wrong? That’s why we hold dividend-paying stocks for income, cash for safety and gold for insurance.

This volatility and fake crisis solving is why we’ve gone on so much about spreading your money around into various asset classes.

If you’ve followed this advice, then yesterday you should have just sat back and enjoyed the view. There’s no need to panic sell when everyone else is irrational.

If anything, you should be ready to put some of your cash stash to work. We know cash is boring and it doesn’t do much for months on end, but this kind of stock market action is exactly why you need a cash buffer.

The Australian stock market dropped 118 points yesterday. And it could fall further today or next week. But when a stock you’ve followed falls to a price that’s attractive, you should buy it.

Despite yesterday’s move, we’re still more bullish than bearish, so we’ll use what we think are short term bearish moves as buying opportunities, and you should too.

Cheers,
Kris

Join me on Google Plus

From the Port Phillip Publishing Library

Special Report: The Gold Mirror of Kaieteur Falls

Daily Reckoning: The Fed’s Funny Money is Losing its Mojo

Money Morning: My Wife and Warren Buffett

Pursuit of Happiness: New Technology: Etched in Glass