Global Markets, Economies Mired in Early Stages of Biggest Disaster Ever

By Elliott Wave International

The following is a sample from Elliott Wave International’s new 40-page report, The State of the Global Markets — 2013 Edition: The Most Important Investment Report You’ll Read This Year. This article was originally published in Robert Prechter’s September 2012 Elliott Wave Theorist.

Global markets and economies are mired in the early stages of the biggest disaster ever. Most people think both areas are in the early stages of a prolonged recovery, but in fact they are on the cusp of the second downturn, which will be of epic proportion.

The world is in the grip of a bear market. You wouldn’t know it from watching the S&P and the NASDAQ, but just about every other major market average in the world has been falling, including those of China, Japan, Europe, the BRICs, emerging markets, and even the broad U.S. market, shown in the chart below. And these indexes have fallen far further in inflation-adjusted terms.

A Global Bear Market

Global-equity hedge funds, run by the smartest people in the business, have lost money for clients over the past 10 years. According to Income Research & Management and Bloomberg, over that time annual five-year returns have been up for two years, flat (0.0-0.8% gain) for three years, and negative for five years.

Our recommended short position in 2007-2009 gives us a positive five-year stock market experience. But we returned to a bearish stance too early. If we lived in China, our timing would have caught the exact top of the rally; if we lived in Europe, our current trade would be at a profit, too; but we don’t live in China or Europe. Only in the U.S. does the levitation continue, and even then it’s only in the blue-chip averages. The broad U.S. market, comprising all NYSE stocks, topped out nearly a year and a half ago, per the New York Composite Index shown at the bottom of the chart.

Market perversity is on display here, as both bulls and bears are suffering their own special water torture.

Many bullish fund managers have lost money since April 2011, because their portfolios tend to mirror the broad market. Garrett Jones reminded us that the most-owned stocks among institutions are down by a full one-third since 2000, as shown by the Institutional Index, a capitalization-weighted index of the 75 most-owned stocks by institutions (see the figure inside the State of the Global Markets report). Yet aggressive bears who shorted the S&P or NASDAQ have lost money, too, since the futures-related markets have risen.

It seems pertinent that only the indexes that one can leverage in quantity with futures — the S&P and NASDAQ — have risen over the past several months. Maybe this selectivity is for technical reasons, but there might be another explanation. Institutions, not the public, have driven the rally, and they can borrow billions of dollars from banks to leverage their bets. The divergent action among the indexes suspiciously fits the circumstance that major investment banks can make a lot of money by buying futures and then committing their own and clients’ funds to buying stocks that push up those particular underlying indexes. They could even sell other stocks to make it happen. Employing that strategy would account for the big differences in the averages over the past half-year. The low volume and volatility help serve up the opportunity. When the current plateau of optimism ends, the indexes now leading on the upside will catch up quickly on the way down. But in the meantime it’s an annoying situation, as momentum-based sell signals are flashing continually but the market has yet to succumb.

Adding to the injury is that fact that all of these indexes have been re-priced higher in dollar terms due to the temporary re-expansion of dollar-based credits since 2009. A chart on page 7 of The State of the Global Markets report shows the real path of stock values.

Most people seem to believe that the Fed has engineered the stock market rally. I also keep reading about how ECB President Mario Draghi is making stock markets go up by announcing bond purchases. This is wrong. As shown in the chart above, European stocks are below their highest level since the ECB bond-buying programs began. Likewise the largest debt-buying program the Fed ever undertook — a $1.3 trillion binge — occurred in 2008, and it failed to prevent the biggest bear market since 1932. The bear market ended three months after the Fed stopped the program. The Fed and the ECB are not the primary cause of optimism or rising stock prices. The rally was due for natural reasons, i.e., a swing toward more positive social mood, which our market forecasting publications anticipated. But QEs and other policies do provide big institutions with nearly unlimited credit, allowing them in optimistic times to put it to use. Doing so temporarily elevates prices beyond what they would be if unlimited credit weren’t available.

Optimism is necessary to allow the Fed and its banks to create credit for financial speculation, which keeps the market levitating. Conversely, when pessimism returns — as it soon will — the reduction of leverage will add to selling pressures.

Robert Prechter is the founder and president of Elliott Wave International, the world’s largest financial forecasting firm. The rest of EWI’s 40-page report, The State of the Global Markets — 2013 Edition: The Most Important Investment Report You’ll Read This Year, is available for download. Follow this link to download the full report – for free.


Low Activity in the Markets Had No Impact on the Pairs Dynamics Situation

EURUSD

euro usd forex trading


Yesterday, the U.S. celebrated President’s Day, thus in the absence of significant news the markets’ activity was very low that caused a corresponding impact on the currency movement. The EURUSD tested the 1.3321 and 1.3379 levels and then, was stuck somewhere in between them. Thus, nothing new happened to the pair’s picture. It remains to note that the pair is fluctuating within the range limited by the resistance near the 34th figure and the support near the 33th one. Hence, If it moves out of the range in either one direction or another, it will mark further dynamics of the euro. In case of the breakdown of the lower limit, it is wise to expect the rate’s drop to the important support of 1.3265, the loss of which would worsen the pair’s outlook. The breakdown of the resistance would provide the pair bulls an opportunity to test 1.3475.


GBPUSD

gbpusd forex trading


The GBPUSD pair wasn’t active either. Pressure on it remains, the downtrend is still in force too, despite the fact that bears are not yet able to take the support of 1.5437. If they can’t manage to pass this level, the bulls will try to take the initiative into their own hands. In this case, the pound will try to break above 1.5550 again, which would jeopardize the 56th figure’s testing. If the bears manage to do so, then the rate will drop to 1.5407/00 that will be not a positive fact for the pair.


USDCHF

usdchf forex currencies


As for the USDCHF pair, there is also nothing to add. Here bulls managed to increase above 0.9240 and test 0.9257, and the pair dropped to 0.9209. The USDCHF pair was held near the 0.9230 level during the rest of the day. A rise above 0.9257 would cause testing of the 93rd figure. A drop below 0.9200 would worsen prospects of the dollar, but as long as it holds above 0.9100, the pair has chances to resume increase increase.


USDJPY

usdjpy forex blog


The USDJPY pair bulls are persistant in their efforts to overcome their highs, but still there is nobody who is willing to buy above 94.20. And the longer there is noone to buy there, the clearer outlines appear of those who are willing to take profits and sell, due to which there will start a downward correction. Its confirmation will be the breakdown of the support around 92.20 — 92.00. Then we can expect the decrease towards the 90th figure. There on the weekly chart, the RSI is still overbought, the Stochastic begins to “look” downwards.

provided by IAFT


Thailand holds rate, warns of risks to financial stability

By www.CentralBankNews.info     Thailand’s central bank kept its policy rate steady at 2.75 percent, as expected, saying the country’s economy is expected to grow faster than previously expected and inflation is within the bank’s target range, but warned there are risks to “domestic financial stability, including from rising asset prices.”
    The Bank of Thailand (BOT), which cut rates by 50 basis points in 2012, said its monetary policy committee voted by 6 to 1 to keep the rate steady with one member wanting to cut the rate due to the “risks stemming from volatile capital flows and fragile economic momentum.”
    Thailand’s economy expanded more than the central bank had expected in the fourth quarter of 2012, with Gross Domestic Product up by 3.60 percent from the second quarter for year-on-year growth of 18.90 percent  following a sharp fall in the last quarter of 2011 after widespread flooding.
    “The economy is expected to grow faster than previously projected in the periods ahead, with domestic demand being a key growth driver together with a gradual recovery of exports,” the BOT said in a statement following a meeting of its Monetary Policy Committee.
    Last month the BOT revised its 2013 growth forecast upward due to the momentum in private demand to 4.9 percent from 4.6 percent. In 2012 the Thai economy expanded by 6.4 percent and the BOT forecasts 2014 GDP growth of 4.8 percent.
    “Going forward, the MPC will continue to closely monitor risks to financial stability as well as the capital flow situation and stands ready to take actions as appropriate,” the BOT said.
    With its strong economy, Thailand is seeing capital inflows and an appreciating baht currency and earlier this month the Thai finance minister sent a letter to the central bank, saying interest rates should be cut in an effort to limit capital inflow and thus upward pressure on the baht.
    The BOT has shrugged off this pressure, saying lower interest rates are not the main driver in inflows and keeping rates low will only help fuel an unsustainable rise in asset prices.
    Thailand’s headline inflation rate eased to 3.39 percent in January from December’s 3.63 percent but the BOT said inflationary pressures had increased somewhat due to higher oil prices.
    The central bank targets core inflation of 0.5 to 3.0 percent and has forecast average core inflation of 1.7 percent in 2013, down from 2012’s 2.1 percent, and 1.6 percent in 2014. Headline inflation is forecast of 2.8 percent in 2013, down from 2012’s 3.0 percent.
    Last month the BOT said it was keeping a close eye on the risks from persistently high credit growth, rising household debt and volatile capital flows.
    Although the global economy has improved in the last month and the outlook is improving, the BOT said the “global economic recovery is still subject to downside risks, from the eurozone’s sovereign debt problems and uncertainties regarding the US fiscal consolidation.”
    It noted that Chinese and Asian economies were expanding well on the back of stronger domestic demand and better exports while domestic consumption and investment should support the US economy. The eurozone economy will take time to recover and growth in Japan has yet to gain traction but planned fiscal and monetary stimulus should stabilise the economy.
    
    www.CentralBankNews.info


India As an Investor-Friendly Country

By Harjeet

The attractiveness of the Indian market is regularly substantiated through the investments made by various multinational corporations in the country, which demonstrate their belief in the strong fundamentals of the Indian economy. The Government of India policies backed with positive business environment, availability of talented workforce and stable outlook for the macro-economy has made India a global hub for international players to park their funds in various investment sectors.

There is a parallel process of business and industry with various countries taking note of the opportunities that recent economic developments in India have created for them.

Projections

As per the Government projections, Indian infrastructure landscape would attract investments worth Rs 49,000 billion (US$ 881.29 billion) during the 12th Five Year Plan period (2012-17), with at least 50 per cent funding from the private sector.

Sectors

For overseas Indians, India offers a tremendous opportunity for investment and wealth building as India is slated to grow at the rate of 8%-10% for the next few decades. There are various investment sectors where non-residents of Indians (NRIs) can explore money-spinning deals and do profitable business.

Investment Options

Most of the Indians who have migrated to foreign countries for professional and personal reasons, still feel the desire to be associated with their mother land in some way or the other. They try to make investments in India through different avenues. There are numerous investment options for NRIs in India that can yield them lucrative benefits and profitability both in short run as well as long run. A few of them are as follows:

  • For the NRI who is looking for high returns, attention should be concentrated on the huge number of central and state sponsored projects in key infrastructural sectors like education, healthcare and construction
  • In general NRI investment is made through three major sectors. These include bank accounts, investment in immovable properties and investment in securities and debts
  • There are many types of bank accounts. The regulations vary according to the repatriation of the interest income
  • The securities in which the NRI can invest through the automatic route include agriculture, mining, alcohol brewing, power, industrial explosives, hazardous chemicals, drugs and pharmaceuticals, transport, insurance, industrial parks, non banking financial institutions etc. You do not need the approval of the Reserve Bank of India (RBI) to invest in these securities. In some cases, the approval of the Foreign Investment Promotion Board (FIPB) may be required. These include sectors like tea, infrastructural companies except telecom, publication of newspaper and periodicals, courier service and single brand product retailing
  • If you are looking for investment opportunities with repatriation benefits, you will have to invest in mutual funds, term deposits and bonds for at least three years
  • A NRI can invest in proprietary and partnership firms in India, but the income will not be repatriated outside the country
  • NRI can directly invest in real estate in India except if you are buying agricultural lands or plantations. Investments in housing schemes and commercial properties are free

About the Author

Harjeet is an Indian – born mass-market novelist, who covers the world internet related topics. He writes columns and articles for various websites and internet journals in the domain of Investments.


Dispelling Some Big Myths About Economic Forecasts

By MoneyMorning.com.au

The financial media makes a living discussing the machinations of the economy and markets. Talking heads yap away about this economic indicator pointing to better times and that statistic signalling a coming recession.

People pass themselves off as ‘experts’ on economic matters and the general public assumes that they must know the answers and can predict the future of the economy better than a layman.


But the fact is not one person on this earth can predict the future. Sure you can get it right every now and again, even a broken clock is right twice a day as the saying goes. And the more general and sweeping the statements that you make the harder it is for anyone to pin you down and say that you were wrong.

Professor William Sherden wrote a book called The Fortune Sellers: The Big Business of Buying and Selling Predictions. Sherden tested the accuracy of leading economic forecasters over many decades.

The Investment Watch blog said his research concluded that there’s ‘no way economic forecasting can improve since it is trying to do the impossible’.

I will repeat his 11 findings as revealed in the above blog here because I think it is important for us to dispel the myths that are continually propagated…

Here they are:

1. Economists’ predictions are no better than guesses

Forecasting skill of economists is no better than guesstimates by Main Street investors.

2. Government economists often worse than guesses

Sherden discovered that predictions made by the elite economists on the President’s Council of Economic Advisors, the Federal Reserve Board, and even the non-partisan Congressional Budget Office were actually worse than guessing.

3. Long-term accuracy is impossible

The accuracy of forecasting declines the longer the lead times.

4. Turning points cannot be predicted

Economists cannot predict the crucial turning points in the economy, confirming Siegel’s research. Worse, the vast majority of all long-term predictions fail.

5. No specific forecasters are better than the rest of pack

Sherden also learned that no particular forecasters were consistently more accurate.

6. No forecaster was more expert with specific statistics

No forecaster has consistently higher skills in predicting any one economic statistic.

7. No one ideological orientation was better

No ideology perspective consistently produced superior forecasts.

8. Consensus forecasts do not improve accuracy

But still, the press and their readers love those lists, averages and consensus forecasts.

9. Psychological bias distorts forecasters and their forecasts

Some economists are naturally optimistic and bullish. Others are naturally pessimistic bears. Some are conservative, some progressive. Why? Look inside their brains or at their DNA. Every economist has mental biases and political ideologies that distort their choice of research topics and data selection, and therefore skew their predictions.

10. Increased sophistication does not improve accuracy

Sorry folks, but all the new scientific methods, technologies, algorithms and computer models of the economy can make forecasts worse. At least give skilled Wall Street insiders an even better edge over naive retail investors.

11. No improvement over the years

Finally, Sherden says there’s no evidence that economic forecasting has improved in recent decades, despite vast new technologies.

That’s a pretty damning set of findings to say the least. And yet every single night on the news we wheel out someone to comment on that day’s price action in the market. They come up with some reason why prices moved the way they did and they make a sweeping statement about what will come next. What a farce.

So, have I just done myself out of a job?

Not so fast. I’ll explain why in my other Money Morning article for today: How a Share Trader Approaches the Market

Murray Dawes
Editor, Slipstream Trader

Join me on Google Plus

From the Port Phillip Publishing Library

How a Share Trader Approaches the Market

By MoneyMorning.com.au

The job of the share trader is not to tell the future. The job of the share trader is to accept that they don’t know the future and then structure their share trading activity accordingly.

I think accepting that the future is unknowable is the first step in creating a sound share trading strategy.

Your whole way of thinking about the market is transformed when you look at it in this way. The first question you ask yourself when you know you don’t know the outcome is, ‘When am I wrong?’ Also you can withdraw your ego from proceedings because you aren’t trying to predict the future to prove your self-worth.

The game of share trading becomes one of probabilities.

My long term aim is to have a strike rate (percentage of winning trades) of at least 50% and a risk reward of 2:1, meaning that I will make twice as much on my winners as I lose on my losing trades.

The fact is that the long term results contain a lot of volatility. You can have periods of a 20% strike rate and then periods of an 80% strike rate which averages out to 50%. It can be pretty tough to keep your eyes on the long term figures when you have been share trading with a 20% strike rate, I can assure you.

The psychological battles that a share trader must engage in are immense. And it’s usually this issue that brings most share traders undone.

Anyone can repeat the top ten trading rules that are necessary to succeed, but actually adhering to them in the heat of battle is another thing entirely.

It is only through actual experience trading the markets with real money that we can learn about our own weaknesses.

And the market is determined to prod at our weaknesses at every opportunity.

Most of the price action these days is trading algorithms hunting for share traders’ stop losses. First they suck you into trading and then whip you out of your position. It really is a battle of man vs machine and at the moment I reckon the machines are winning.

The only way to survive in the current market as a share trader is to start thinking like the share trading algorithms. Where are share traders stop losses? Once share traders are stopped out the market will usually reverse.

It is this sort of thinking that lead me to focus on false breakouts rather than breakouts.

There is a far higher probability that a breakout will fail to follow through than continue. The risk that needs to be taken when fading (going against) a breakout is minimal because you are selling into strength or buying into weakness. Therefore you can place your stop loss above or below the most recent extremity in price.

With this method you can join longer term trends by, for example, buying the false break of the lows in an uptrend or selling the false break of the highs in a downtrend.

Analysing the German Index

With this in mind let’s have a quick look at the current chart of the DAX, which is the index for the German stock market.

The DAX has broken out to new multi-year highs recently, but the momentum has shifted back to the downside over the past few weeks.

German DAX Daily Chart

German DAX Daily Chart
Click here to enlarge

Source: Slipstream Trader


My intermediate trend signal is now down (The 10 day EMA below the 35 day SMA) and share prices are now resting on the high from April 2011 (see solid blue line in chart above).

If prices snap below the lows from last week of 7,537 I would expect to see some profit taking come out of the woodwork. I wouldn’t be surprised to see a pretty sharp fall towards the 200 day moving average at 7,060 which is over 6% lower than current levels.

Also notice the indicator in the bottom half of the chart. It’s a 10 day average true range as a percentage of the price and inverted on the scale. It basically shows rises and falls in volatility. As the line rises volatility is falling and vice versa.

You can see on the chart that whenever volatility has fallen to current levels over the past few years and then turned back up a top has formed and the market has sold off over the next few months.

Will history repeat? I think so.

But as I said at the start, I know that I don’t know the future. All I know is that now is a good risk/reward moment to start looking at the German DAX as an investment opportunity to profit from the short side.

Murray Dawes
Editor, Slipstream Trader

Join me on Google Plus

From the Port Phillip Publishing Library

Daily Reckoning: Shock Monetary Therapy: Should You Cut Back Your Exposure to Gold?

Money Morning: The Poster-Child for the US Shale Gas Revolution

Pursuit of Happiness: My Goals Now I’m 64

Can Turkey Cause a Global Power Shift in Joining the SCO?

By MoneyMorning.com.au

Is Turkey about to join the Shanghai Cooperation Organization (SCO)?

After years of delay on its application to join the European Union (EU) as a full member, Turkey has made overtures to the SCO as an alternative to the EU.

Turkish Prime Minister Recep Tayyip Erdogan said after a meeting with Russian Prime Minister Vladimir Putin that Turkey was seriously considering becoming a member of the SCO instead of continuing its efforts to join the EU.

‘The European Union needs to stop stalling us,’ Erdogan said. ‘We have a strong economy. I told [Putin], “You should include us in the Shanghai Five [the former name of the SCO] and we will say farewell to the European Union.” The Shanghai Five is much better off economic-wise. It is much more powerful. We told them, “If you say come, we will”.’

What’s the Shanghai Cooperation Organization?

The SCO’s full members are China, Russia, Kazakhstan, Kyrgyzstan, Tajikistan and Uzbekistan. Mongolia, India, Iran and Pakistan have observer status in the SCO while Turkey is a dialogue partner along with Sri Lanka and Belarus.

Originally formed in 1996 to demilitarize the border between China and the former Soviet Union, the SCO was expanded in 2001 to include Uzbekistan.

According to a background study by the Council on Foreign Relations, the SCO has the potential to be an important body for regional energy and security cooperation in Central Asia, but has so far not achieved anything substantial.

Both China and Russia have secured bilateral agreements with other SCO members to build pipelines from the energy-rich Caspian Sea region to their respective home markets but this has taken place outside of the SCO.

‘The competing efforts of Russia and China to secure influence in the region are a potential obstacle to extensive SCO energy cooperation,’ the Council on Foreign Relations concluded.

If genuine energy cooperation could be achieved by the SCO, particularly if it included Iran, that would be a boon for Turkey, which depends on imported energy to fuel its rapidly growing economy.

Would SCO Bid Affect Turkey’s NATO Status?

Turkey is a member of NATO, while the SCO is seen as acting as a counterweight to American interests in Central Asia – if not outright anti-American.

The SCO has called for U.S. troops to leave the region but the U.S. has military bases in several Central Asian countries, including SCO members Kyrgyzstan and Uzbekistan, to support the war in Afghanistan.

Although those bases are subject to bilateral agreements with the countries involved and not with the SCO, the issue of what happens to those bases when the U.S. withdraws from Afghanistan at the end of 2014 will be a thorny one.

Of course, the U.S. has a major military presence in Turkey. If Turkey joins the SCO, what will happen to the U.S. bases there? Will Turkey want to withdraw from NATO?

As the U.S. State Department said, if Turkey joins the SCO, it will be ‘interesting’.

SCO a Cover for Big Power Diplomacy?

Many experts feel that the SCO can never be an effective security or energy cooperative organization because of its membership.

Russia has a proprietary interest in the Central Asian countries Kazakhstan, Kyrgyzstan, Tajikistan and Uzbekistan, which used to be part of the Soviet Union, and clearly wants to keep rival China out.

For its part, China wants to get access to the energy-rich area around the Caspian Sea which, according to the BP Energy Survey, holds about 21% of the world’s oil and 45% of the world’s natural gas.

Would Russia or China really welcome Turkey, a significant power with regional ambitions of its own, into the SCO?

That, too, would be ‘interesting’.

Jeff Uscher
Contributing Writer, Money Morning

Join Money Morning on Google+

From the Archives…

Four Things to Look Out for When Buying Gold Stocks
15-02-2013 – Kris Sayce

Here’s One Way to Eke More Gains from this Rising Stock Market
14-02-2013 – Kris Sayce

When Will the Inflationary Stock Boost End?
13-02-2013 – Murray Dawes

Gold Stocks: Back Up the Truck
12-02-2013 – Dr. Alex Cowie

The Next Surge in the Gold Price Looms: It’s Time to Buy Gold Now
11-02-2013 – Dr. Alex Cowie

EURUSD breaks above downward trend line

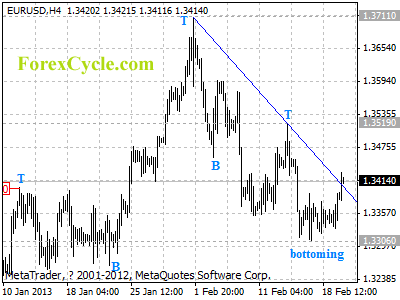
EURUSD breaks above the downward trend line on 4-hour chart, suggesting that a cycle bottom is being formed at 1.3306 on 4-hour chart, and lengthier consolidation of the downtrend from 1.3711 is underway. Further rally could be expected and the target would be at 1.3475 area. Key resistance is at 1.3519, as long as this level holds, one more fall towards 1.3100 is still possible, only break above 1.3519 could signal completion of the downtrend.

eurusd

Daily Forex Forecast

Turkey cuts short-term rates, holds policy rate, raises RRR

By www.CentralBankNews.info     Turkey’s central bank kept its policy rate steady at 5.50 percent but continued to shift its daily interest rate corridor downwards to support growth but tightened its reserve requirements to slow down the growth of credit from a continuing inflow of capital that is putting upward pressure on the Turkish lira.
    The Central Bank of the Republic of Turkey (CBRT), which started narrowing its interest rate corridor in September 2012, cut the overnight lending rate, which forms the ceiling of the corridor, by 25 basis points to 8.50 percent and the overnight borrowing rate, which forms the floor, to 4.50 percent.

    “The Committee has indicated that credit growth displays a significant acceleration amid
strong capital inflows,” the central bank said following a meeting of its monetary policy committee.
    “Accordingly, it was deemed appropriate to implement a measured tightening through reserve
requirements, while delivering a limited downward shift in the interest rate corridor,” it added.
    The reserve requirements were raised by 25 basis points for lira deposits for up to one year but less than three years and by 50 basis points on most foreign currency deposits, effective March 1, draining some $940 million from the market.
    The central bank said domestic demand remained moderate “while exports continue to increase despite weak global activity,” which is narrowing the current account deficit.

    The central bank also said the daily funding of liquidity via one-week actions would be set between 0.2 and 6.5 billion Turkish lira until the policy committee’s next meeting and the upper limit for one-month repo auctions was set at 2.5 billion lira.
    In the event that liquidity conditions change, the bank said it would provide funds beyond the limits.

   “Ongoing uncertainties regarding the global economy necessitate the monetary policy to
remain flexible in both directions,” the CBRT said.

    Turkey’s inflation rate rose to 7.31 percent in January, up from December’s 6.16 percent, but the bank said in its statement that it expects inflation to continue to decline.
    The central bank targets annual inflation of 5.0 percent, the same as in 2012 when inflation averaged 6.2 percent, down from 10.4 percent in 2011.
    While narrowing and shifting the interest rate corridor downward last year, the CBRT kept the benchmark one-week repo rate steady until December when it was cut by 25 basis points, the first cut since August 2011.
    Turkey’s Gross Domestic Product rose by 0.2 percent in the third quarter from the second quarter for annual growth of 1.6 percent, down from 3.2 percent in the second and 2.3 percent in the first quarter.

   The economy is estimated to have expanded by 2.5 percent last year, down from 8.5 percent in 2011. The central bank forecasts 2013 growth of 4 percent or higher.

    www.CentralBankNews.info