AUD/USD: Greenback Falls to Aussie on Chinese Data

Even as market participants take in a wait-and-see approach to risk sentiment, the US dollar is perceived to move lower against the Australian currency today. Investors eye the results of the central bank meetings across the Atlantic today, while awaiting corporate earnings reports. But with Australia and China registering favorable economic data earlier today, the Aussie is likely to benefit in the currency market.

In a morning note earlier, Ishaq Siddiqi, market strategist at ETX Capital said that neither the Bank of England nor the European Central Bank is expected to change its monetary policy. “Instead central bankers are likely to wait for more economic data to see how the economic activity is faring in 2013 before making any decisions.”

Earlier today, the Australian Bureau of Statistics reported that home-building approvals in the Land Down Under advanced in November, for a third time in the past four months. The Reserve Bank of Australia lowered borrowing costs five times from November 2011 to October to buttress the economy as a resource investment boom is predicted to peak this year, which in turn encouraged plans for apartment projects. The number of permits granted to build or renovate houses and apartments gained 2.9 percent from October, when they fell a revised 5.1 percent, according to the report.

Further, the Chinese report released earlier showed that imports rose to a record in the nation’s biggest overseas market. China’s exports rose 14.1 percent in December from a year earlier while imports increased 6 percent, leaving a trade surplus of $31.6 Billion, according to the Customs General Administration of China.

“The Chinese data is a whole lot better than anyone expected with both imports and exports accelerating,” said Mike Jones, a currency strategist at Bank of New Zealand in Wellington. “That will only add to recent investor optimism that the Chinese rebound has got legs and should take the Aussie dollar higher.”

Considering these fundamental data, a long position is recommended for the AUDUSD. Be on the lookout still for probable technical corrections as the price index already indicates that the currency pair is already overbought.

For more news, analysis, technical charts and candlestick analysis, visit AlgosysFx Forex Trading Solutions.

All Eyes on EU Minimum Bid Rate Today

Source: ForexYard

Higher-yielding assets took losses throughout the European session yesterday, following a disappointing German Industrial Production figure that led to fresh concerns regarding the pace of the euro-zone economic recovery. Meanwhile, speculations about future monetary easing in Japan weighed down on the JPY. Today, the main piece of economic news is likely to be the EU Minimum Bid Rate and ECB Press Conference, scheduled to respectively take place at 12:45 and 13:30 GMT. If euro-zone interest rates are lowered from their current 0.75%, risk aversion may result in significant euro losses.

Economic News

USD – Dollar Capitalizes on Global Economic Data

The US dollar saw upward movement against both its riskier and safe-haven currency rivals yesterday, as the combination of disappointing German economic data, and speculations regarding future monetary easing in Japan boosted demand for the greenback. The GBP/USD fell more than 70 pips during European trading, eventually reaching as low as 1.5995. Against the Japanese yen, the greenback gained close to 90 pips during the first part of the day to trade as high as 87.73, not far from a recent 2 ½ year high.

Today, in addition to euro-zone news which is forecasted to generate heavy market volatility, dollar traders will also want to pay attention to the US Unemployment Claims figure, set to be released at 13:30 GMT. The figure is expected to come in at 361K, slightly below last week’s 372K. A lower than expected result today, would signal improvements in the US labor market and may result in dollar gains during afternoon trading.

EUR – Euro Bearish Ahead of EU Interest Rate Decision

The euro took losses against most of its main currency rivals yesterday following the release of a disappointing German Industrial Production figure which generated fears that the EU is slipping deeper into recession. The EUR/USD lost more than 50 pips during the mid-day session to trade as low as 1.3037. Against the Japanese yen, the common-currency fell more than 70 pips, eventually reaching as low as 114.03 before bouncing back to the 114.40 level during afternoon trading.

Turning to today, euro traders will want to pay close attention to the EU Minimum Bid Rate at 12:45 GMT, followed by the ECB Press Conference at 13:30. While most analysts predict that euro-zone interest rates will be kept at 0.75%, traders will want to note that if a surprise cut takes place, the euro could take heavy losses. Furthermore, if the ECB signals during the press conference that interest rates may be reduced in the near future, risk aversion is likely to weigh down on the common-currency.

Gold – Gold Takes Minor Losses as Dollar Strengthens

Gold took minor losses during European trading yesterday, as a bullish US dollar made the precious metal more expensive for international buyers. Gold prices fell close to $10 an ounce during mid-day trading to eventually reach as low as $1656.00.

Turning to today, gold traders will want to pay attention to a potentially significant euro-zone interest rate decision, set to take place at 12:45 GMT. If interest rates are kept at their current level of 0.75%, the euro could recoup some of its recent losses against the greenback, which could boost the price of gold during afternoon trading.

Crude Oil – Euro-Zone Data Likely to Generate Volatility for Oil

Despite speculations that demand for oil has fallen in the US, the world’s leading consuming country, crude prices saw upward movement yesterday. The commodity advanced more than $0.70 a barrel during mid-day trading, eventually reaching as high as $93.62 by the end of the European session.

Today, euro-zone data is likely to be the deciding factor in the direction oil prices take. If interest-rates in the EU are cut from their current level of 0.75%, or the ECB signals that the region has slipped deeper into recession, risk aversion is likely to cause oil to reverse yesterday’s gains.

Technical News

EUR/USD

The Bollinger Bands on the weekly chart are beginning to narrow, indicating that a price shift could occur in the coming days. That being said, most other technical indicators place this pair in neutral territory, meaning a definitive trend is difficult to predict at this time. Taking a wait and see approach may be the best strategy for this pair.

GBP/USD

The Bollinger Bands on the weekly chart are narrowing, indicating that this pair could see a price shift in the coming days. Furthermore, the MACD/OsMA on the same chart has formed a bearish cross, indicating that the shift could be downward. Opening short positions may be the best option for this pair.

USD/JPY

The Relative Strength Index on the weekly chart is currently in overbought territory, indicating that a downward correction could occur in the coming days. This theory is supported by the Slow Stochastic on the same chart, which has formed a bearish cross. Opening short positions may be the smart move for this pair.

USD/CHF

While the Williams Percent Range on the daily chart has crossed over into overbought territory, most other long-term technical indicators place this pair in neutral territory. Traders may want to take a wait and see approach, as a clearer picture is likely to present itself in the near future.

The Wild Card

NZD/CHF

The daily chart’s Slow Stochastic has formed a bearish cross, signaling that this pair may see a downward correction in the near future. Furthermore, the Williams Percent Range on the same chart is currently in overbought territory. Forex traders may want to open short positions for this pair, ahead of possible downward movement.

Forex Market Analysis provided by ForexYard.

© 2006 by FxYard Ltd

Disclaimer: Trading Foreign Exchange carries a high level of risk and may not be suitable for all investors. There is a possibility that you could sustain a loss of all of your investment and therefore you should not invest money that you cannot afford to lose. You should be aware of all the risks associated with Foreign Exchange trading.

Central Bank News Link List – Jan. 10, 2013: ECB to hold fire as euro zone economy shows glimmers of hope

By www.CentralBankNews.info Here’s today’s Central Bank News link list, click through if you missed the previous link list. The list comprises news about central banks that is not covered by Central Bank News. The list is updated during the day with the latest developments so readers don’t miss any important news.

Poland does not rule out more rate cuts if economy slows

By www.CentralBankNews.info     Poland’s central bank, which earlier today cut its policy rate for the third time in a row, said it did not rule out further rate cuts if the economic slowdown is protracted and there are limited risks of higher inflationary pressures.
      The National Bank of Poland’s (NBP) warning is slightly less hawkish than its statements from November and December when it said it “will” ease policy if data confirmed a protracted economic slowdown.
    The NBP’s Monetary Policy Council said new data had confirmed a “considerable slowdown” and this was limiting wage and inflationary pressures.
    The central bank expects economic growth to remain moderate in coming quarters and this poses the risk of inflation falling below the bank’s target. But today’s rate cut should help support economic activity and limit this risk.
    “The Council does not rule out further monetary policy easing should the incoming data confirm a protracted economic slowdown and should the risk of increase in inflationary pressure remain limited,” the NBP said.
    Earlier today the central bank cut its reference rate by 25 basis points to 4.0 percent. Its other interest rates were also cut by 25 basis points. Last year the central bank reduced rates by a net 50 basis points, cutting both in November and December.

     The bank said data showed that global economic activity was still weak in the fourth quarter of last year and this weak activity was conducive to reducing inflation in many countries.
    Although financial market sentiment had improved recently, Poland’s economic activity remains weak, with industrial and construction output down in November and annual growth in retail sales in real terms was only just slightly above zero.
     Poland’s third quarter Gross Domestic Product rose by only 0.4 percent from the second quarter with the annual growth rate falling to 1.4 percent from 2.5 percent in the third quarter and 3.5 percent in the first quarter. In 2011 Poland’s economy expanded by 4.3 percent.
    The central bank said both household and corporate lending growth had continued to weaken and unemployment is continuing to rise.
    Poland’s inflation rate fell to 2.8 percent in November from 3.4 percent in October and 3.9 percent in September. The central bank targets inflation of 2.5 percent, plus/minus one percentage point, and expects the target to be reached this year. In 2014 inflation is forecast to drop further to 1.5 percent.

    www.CentralBankNews.info


What Lower Interest Rates Mean for Australian Stocks in 2013

By MoneyMorning.com.au

Australian stocks on the Australian share market climb higher

Here’s a report from the Australian that won’t surprise you one jot:


‘The three best-performing major super funds in Australia are all corporate funds run for in-house employees. Not only that, but two of the three are funds run for the benefit of bank staff, in this case Goldman Sachs and Commonwealth Bank.’

It’s a well-known fact that if you want to be rich and gain influence, the best way to do it is to work for Goldman Sachs (or as it’s also known, Government Sachs).

But if you can’t get a job at Goldman’s you’ll need to find other ways to get rich (forget about gaining influence, it’s overrated).

So today we’ll look at what is still the best way to build wealth in Australia…

As we wrote recently, 2012 turned out to be a great year for Australian stocks. The blue-chip S&P/ASX 200 index gained 14%. The gain was even bigger if measured from the June low.

Still, over the past year, the Australian stock index has been one of the best performers among Western stock indices. The following chart shows the comparison between the Australian stock market (blue line), the US S&P 500 (yellow line), the UK FTSE 100 (red line), and Japan’s Nikkei 225 index (green line):

following chart shows the comparison between the Australian stock market (blue line), the US S&P 500 (yellow line), the UK FTSE 100 (red line), and Japan’s Nikkei 225 index (green line)
Click here to enlarge

Source: Google Finance


The above stock chart tells you two things. First, it tells you that when stocks move up, they can move up pretty quickly. Two-thirds of the Australian stock’s 2012 gain came in the last six weeks of the year.

But look at the left hand side of the chart. That’s where you’ll get the second message. By March, the Nikkei 225 had gained 22%, and by May the Aussie index had gained 7%. Yet it wasn’t long before both indexes had given up all those gains before rallying again.

So while the stock market looks great right now, there’s always the risk that it could do an about turn and hit the skids.

Even so, we still like the look of stocks, despite the recent rally. Here’s why…

Lower Interest Rates to Send Stocks Higher

There’s no doubt in our mind that market insiders are doing their best to create and maintain another asset bubble. That has been obvious for some time – bond prices are near record highs (due to low bond yields), commodity prices are on the rebound, and even some property markets are starting to recover.

We’ve heard reports that after crashing in 2011, Perth house prices have taken off like a rocket again.

On top of that, stock markets the world over are on the march higher. The US stock market is within a sniff of its record high, and the Australian stock market is now at the highest point since early 2011. Of course, for the Aussie market there’s still some way to go before it reaches the 2007 high.

But if the trend from overseas happens here, as the Reserve Bank of America (RBA) cuts interest rates further, it will force investors to take even bigger risks. And that means more demand for dividend paying stocks, and more demand for risky assets.

Today the RBA has the benchmark interest rate at 3%. But according to a survey of bank economists by the Australian Financial Review (AFR), most have the RBA cutting the cash rate further within the first six months of this year.

The median forecast is for a cash rate of 2.75% by June. One bank, Australian & New Zealand Banking Group [ASX: ANZ] reckons the cash rate will fall to 2% by the end of the year.

If you think that sounds crazy, just consider this, the average difference (spread) between the US Federal Funds Rate and the RBA Cash Rate is about two percentage points. As the chart below shows:

average difference (spread) between the US Federal Funds Rate and the RBA Cash Rate
Click here to enlarge

Source: Fuller Money


The above chart only goes to 2011. Right now the spread is 2.75 percentage points…and fast approaching the two percentage point average.

A Bumper Two Years for the Australian Share Market?

Of course, as the chart also shows, rarely does it sit at the average. Most of the time, it straddles either side (hence why it’s an average). So odds are as the Aussie dollar stays high, and the domestic economic outlook worsens, this will force the RBA to cut rates even further.

Right now, we couldn’t completely ignore the possibility of the RBA cutting rates below 2% in 2014…perhaps even below 1.5%.

That will make dividend paying stocks even more attractive, and despite the poor economy, will likely push share prices higher.

And don’t forget, the Aussie government has just abandoned its promise to return to a surplus. With Aussie government debt ($261.8 billion) much lower than other Western economies, more spending is on the cards.

In short, while investing in stocks is always risky, if Australia follows the pattern of other economies and other markets, 2013 and 2014 could shape up to be a bumper two-year stretch for the Aussie market.

Cheers,
Kris

From the Port Phillip Publishing Library

Special Report:
The Big Money Secret of Ironstone Mountain

Daily Reckoning:
A North Korean Investment Opportunity

Money Morning:
How Central Banks Are Letting Inflation Get Out of Control

Pursuit of Happiness:
Are You Brave Enough to Break From Technology?

Australian Small-Cap Investigator:
Five Simple Steps to Picking Winning Small-Cap Stocks

My Investing Resolution for 2013: Profit With the Rulers of the Universe

By MoneyMorning.com.au

investment in 2013

How are we to invest our money in 2013? Well, we can start with recognising a simple fact – we can no longer rely on the old rules of investing.


In the past we had an idea that investors were rational. It was thought that we all took on board all the information that was available to us before we invested. That we were calm, reasoning individuals – completely impervious to the influence of other investors, not to mind the actions of central banks and the City.

Because investors were rational, the financial industry was able to come up with all sorts of sophisticated models for pricing assets. These models were largely created during a scientific renaissance that saw NASA put a man on the moon.

But today, who needs to know about internal rates of return and the capital asset pricing model? Heck, even Black and Scholes’s theory on options pricing that belies much of the modern banking industry is under threat…

The actions of the central banks have laid waste to all of this pseudo-science. It turns out that human action can override any natural laws of economics and finance.

Today investment comes down to expectations. Specifically, what do we expect the central elite to do?

Because as an investor, it comes down to how can you piggy-back on what the big boys are up to. It’s the masters of the universe – an elite of bankers, hedge funds, and speculators who largely determine whether your investments will make money or not.

For instance, towards the tail-end of last year, the best performing asset class was – wait for it…Greek government bonds. Incredible…where did that come from?

It was of course the policy of Europe’s central bank that ultimately put a rocket under what had been a terrible investment. The hedge funds and speculators that predicted ECB policy made hundreds of millions by buying up Greek debt for cents on the euro.

Going into 2013, I want to spend more time helping you to get in on these big deals. I want to spend more time interpreting central bank policy and less time using the classic financial rules that I grew up with. And I’ll make a start today.

My New Year’s Investment Resolution

Just look at the early trading days in January. The markets have been all over the place.

First off, it was Obama’s relative victory in fiscal cliff can-kicking (of course, we’ll be coming back to that very soon!). The markets whooshed into a frenzy.

And barely a day later, the precious metals markets took a pasting – volatility like I’ve never seen before. Why? Because the Fed published some notes on its supposed policy to rein in its money-printing antics. Of course it’s rubbish. The Fed won’t give up on money printing any more than I’m planning to give up hot dinners for the new year.

The Fed’s statement was all about modelling expectations… and sending the opposition the wrong way.

We also know that Japan’s elite is going to make its presence felt this year. No wallflowers they. Japan isn’t going to see its phenomenal industrial base slide under without a fight. And ever since the government started muttering about what is effectively money-printing to infinity, it’s put a rocket under the Nikkei. It’s now up over 20% since mid-November. That’s serious money! Here’s the chart that proves it…

Japanese Stocks are on Fire

Japanese stocks are on fire

Source: ADVFN


The point is that today we need to know more about politics, about the intentions of the elite and all that follow them, than we need to know about traditional finance.

MoneyWeek has been talking about the impact that the British government will have on our wealth this year. If you haven’t read their End of Britain report…well, you really should just read it.

My own New Year’s resolution is to follow government and central bank moves more closely. And more importantly, I want to predict their moves – and how it affects markets. It seems kind of tawdry – but it’s nonetheless a necessity.

On Wednesday, I’ll give you my thoughts on the big moves that I see shaping up for this year.
And, to be honest, I won’t apologise too much for spending so much time thinking about the dark art of political prognostication this year. Because heck, that’s where the money is!

The early days of January have an eerie way of foretelling what the year will bring. And the markets are feeling jubilant – all off the back of our ebullient leaders. Expect Japanese-style central action to ripple across the globe.

2013…yeah…bring it on.

Bengt Saelensminde
Contributing Writer, Money Morning

Publisher’s Note: This article appeared in MoneyWeek

From the Archives…

The Talisman of Fear: Why Gold Remains the Foundation of Wealth
4-1-2013 – Kris Sayce

We Got it Wrong With Dividend Stocks…And Investors Still Made Money
3-1-2013 – Kris Sayce

A Contrarian Investment Prediction for 2013
2-1-2013 – Greg Canavan

The Rockers and Shockers of 2012
31-12-2012 – Kris Sayce

Will 2013 Show Us Up?
29-12-2012 – Callum Newman

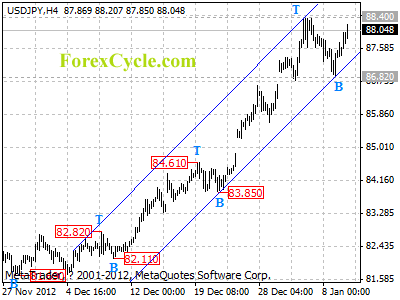
USDJPY is facing 88.40 previous high resistance

USDJPY is facing 88.40 previous high resistance, a break above this level will signal resumption of the uptrend from 82.11, then next target would be at 90.00 area. Initial support is at the lower line of the price channel on 4-hour chart, as long as the channel support holds, the uptrend will continue. Key support is at 86.82, only break below this level could indicate that lengthier consolidation of the longer term uptrend from 77.14 (Sep 13, 2012 low) is underway, then the following downward movement could bring price back to 86.00 zone.

usdjpy

Forex Signals

Limited Fall by the Greenback against the Aussie

Risk confidence in the markets ought to direct the safety bet US dollar lower than the Australian currency today as corporate earnings season starts to kick in. Global stock exchanges today are showing that despite profit-taking from the early surge due to the new year, the bulls are starting to come back.

US stock index futures are pointed to a higher open on Wall Street today, following gains in Europe and Asia in earlier exchanges. after Dow component Alcoa kicked off earnings season with better-than-expected results. Late yesterday, Alcoa, the largest aluminum producer in the US and a bellwether stock for the state of the US economy, kicked off earnings season with a positive outlook for 2013, as reported by CNBC and Reuters. These price movements in the stock markets pave the way for an appreciation in the risk confidence of market participants heading into the New York session.

From a report by Joseph Ciolli of Bloomberg, “I think most of the story is flows and repositioning,” said Greg Moore, a currency strategist at Toronto-Dominion Bank by phone from Toronto. “It’s been very quiet, there’s been very little data out, pretty few fundamental changes.”

A long position is recommended for the AUDUSD in light of corporate earnings. However, the bullish run by the currency pair is seen to be limited data from the Land Down Under showed that Australian retail sales unexpectedly declined for the first time in four months. Consumer spending on household goods and clothing in November was less due to a weaker employment outlook. Sales dropped 0.1 percent to A$21.5 billion from a month earlier, when they were unchanged, according to the Australian Bureau of Statistics.

For more news, analysis, technical charts and candlestick analysis, visit AlgosysFx Forex Trading Solutions.


A Hangover in Booze Stocks?

By The Sizemore Letter

boozeFor the past year, it’s been a swinging-from-the-chandeliers party in booze stocks.  High-end alcohol distillers have kept investors buzzed in an otherwise sobering stretch.

Diageo (NYSE: $DEO), the biggest and best diversified of the lot, is up 37% over the past 52 weeks.  But Pernod-Ricard (Pink:$PDRDY) and Beam, Inc. (NYSE:$BEAM) are both up more than 20%, and Brown-Forman Corp (NYSE:$BF-B), the maker of the iconic Jack Daniels Tennessee Whiskey, was up by nearly 35% through early December before backing off recently.

These are fantastic numbers for a mature business like spirits.

In early November, I wrote favorably about booze stocks, noting that “the premium spirits business has been a rare source of growth in recent years, much of which has been generated by rising sales to emerging market consumers and particularly Chinese consumers.” (See Whiskey Stocks to Burn the Throat).

All of this is still true, of course.  In fact, with China recovering, it’s truer than ever.

Furthermore, in their branding, high-end spirits companies have major intangible assets that take decades to build and are almost impossible to replicate.  To give an example, in much of South America “whisky” does not refer to a type of distilled spirit.  It specifically means Johnny Walker scotch, and usually Black Label.  This kind of branding power creates incredible barriers to new entrants.

It would be virtually impossible to start a new scotch brand today (see Diageo: the Ultimate 12- to 18-Year Play) and this is a fact that is not lost on investors in the sector.

An exception would be high-end vodka, which is subject to trendiness and tends to have trouble building a dedicated clientele.  The “it” vodka at posh bars tends to change from year to year.  There is a reason for this. Vodka doesn’t have to be aged and has no “official” standards.  Anyone with a deep-pocketed marketing team can create a new “premium” brand, mass produce it in a factory, and pimp it at bars a week later.

And let’s not forget that all vodka tastes like water (it’s the only spirit for which “quality” is defined by how watery it tastes), and for most people it’s just something to mix in a cocktail.  I consider it an ingredient for girly drinks that no self-respecting man should ever be seen drinking in public (with the possible exception of a vodka martini, and even then only if your name is Bond…James Bond).  You would never see “Skinny Girl Bourbon,” dammit.  And if we do, I swear I’ll quit drinking.  Forever.

I digress, but my points stand.  Liquor is a fantastic business to be in.

Unfortunately, I can’t say the same for liquor stocks.  At current prices, they are simply too expensive.  Beam, Inc., which was a recommendation of the Sizemore Investment Letter until recently, trades for nearly 30 times earnings.   Brown-Forman trades for nearly 25.

Part of this is due to hopes that Diageo or Pernod-Ricard will make a bid for one or the other (or both) as a way to strengthen their position in the lucrative American whiskey market.  But as I wrote recently,  such a deal would seem unlikely at the moment.  Diageo is busy absorbing some of its other acquisitions of recent years, and Brown-Forman and Beam have market caps of 13 billion and 10 billion, respectively.  That would be a big shot glass to swallow for either Diageo or Pernod-Ricard.

So, you have a buyout premium built into the prices of stocks that are not likely to get bought out anytime soon.  That’s a hard sell.

Diageo itself is modestly overpriced at 23 times earnings.  If you already own Diageo and you have a long time horizon (and Sizemore Capital does own Diageo in some client accounts), I think it is reasonable to hold on and reinvest your dividends.  But at current prices, I would not recommend making any large new investment.

In 2012, we enjoyed the party in booze stocks.  But at this point, I recommend tossing your car keys to the barkeep and catching a cab.  2013 might bring a mean hangover.

SUBSCRIBE to Sizemore Insights via e-mail today.

The post A Hangover in Booze Stocks? appeared first on Sizemore Insights.

Taking Advantage of Recent Lows in the Volatility Index

By JW Jones, OptionsTradingSignals.com

One of the newest option products to appear in our universe as an options trader is the option series designed to trade the volatility index (VIX). The VIX is a measurement of the implied volatility of the S&P 500 index.

To review quickly, the implied volatility of an options series is reflective of the aggregate market opinion of the future volatility of a given underlying asset. In terms of the Volatility Index, the price is the current market opinion of the future volatility in the S&P 500 Index over the next 12 months.

As are all attempts to predict the future, this value does not always reflect accurately the actual volatility as it plays out prospectively, but at a practical level it is the best we can do. As sage philosophers have long noted, “the future isn’t what it used to be.”

The importance for traders is the well established and generally known inverse correlation between prices for the given underlying and the measure of implied volatility, in this case our VIX value. What is typically less known is the fact that levels of implied volatility correlate even more closely to the velocity of the price move of the underlying asset in question.

Because rapid price moves occur far more frequently to the downside, it follows that the general correlation between price and implied volatility is inverse. A fundamental characteristic that underscores the logic of this trade is the strong tendency of the VIX to revert to its recent mean. While this is not a certainty, it is unquestionably a high probability outcome.

For professional traders, much of the focus of hedging activity has recently moved to establishing protective positions in this index rather than such older techniques as buying out-of-the-money protective index puts. However there are some well recognized pitfalls in this approach that lay in wait for the retail trader not aware of some of the nuances inherent to this approach.

One of the major risks in trading this product derives from the fact that both options and ETFs are based on the value of VIX futures. Because there is no mandatory mathematical linking of the value of these futures in the several available expiration months as is routinely present in the options series with which most traders are familiar, a huge and not generally recognized risk exists.

The founders of one of the major retail options brokers have repeatedly cautioned that the single major cause of irreparable account ‘blow ups” they witnessed were the result of time spreads, aka calendar spreads, in this VIX product.  This is the result of the ability of the various expiration months to move without mutual correlation in response to significant market events.

The result of this observation is the practical consideration that time spreads in the VIX must never be traded. No calendar spreads must ever be considered when trading the VIX. Failure to follow this admonition will subject your account to risk far beyond what you consider to be remotely possible. Simply put, “Don’t do it.”

So what trades in the VIX carry reasonable and definable risk? A wide variety of trades including those with both defined and undefined risk is feasible. Such trades include verticals, butterflies, condors, and simple long and short options.

Long time readers know that I strongly prefer to structure positions to include at least a component of positive theta within my trades. Positive theta simply means that the spread has a component that will benefit from the passage of time. Let us consider a modified butterfly position; this position is commonly termed a broken wing butterfly.

First, let us review the current chart pattern of the VIX:

Chart1

As can clearly be seen in the chart above, the VIX is at multi-month lows, and perusal of even longer term charts confirm this value is at multi-year lows. Given this situation, the probability of a move upwards toward its recent mean is overwhelmingly high.

In order to give sufficient duration to our trade, I would like to look at a butterfly structure approximately 3 months into the future in order to allow for mean reversion of the VIX.

The P&L chart for our broken wing April put butterfly is displayed below:

Chart2

As can be clearly seen, the trade structure has no upper bound of profitability and the risk to the lower side is the total amount paid to establish the butterfly. As such, this is a defined risk trade that will profit from a reversion of the VIX to its mean.

We welcome you to try our service to see more high probability trades that capitalize on current market conditions. Over the past two years, the service’s performance track record has steadily beaten the S&P 500 Index while taking significantly less risk.

Simple ONE Trade Per Week Trading Strategy?
Join www.OptionsTradingSignals.com today with our 14 Day Trial

JW Jones

This material should not be considered investment advice. J.W. Jones is not a registered investment advisor. Under no circumstances should any content from this article or the OptionsTradingSignals.com website be used or interpreted as a recommendation to buy or sell any type of security or commodity contract. This material is not a solicitation for a trading approach to financial markets. Any investment decisions must in all cases be made by the reader or by his or her registered investment advisor. This information is for educational purposes only.