Financial Repression All Over Again

By MoneyMorning.com.au

Hedge funds that trade in the debt markets ‘have never had it so good’, as Henny Sender noted in the FT last week.

Financial conditions are as loose today as they were in 2007. That’s what Ben Bernanke himself said in a speech last month. As a result, companies are piling into the market to borrow money, and investors are lapping up their debt.


About the same amount of high-yield bonds (‘junk’ bonds) have been issued this year as in 2007. And according to JP Morgan, more of these high-risk loans are being dished out with fewer conditions than ever before. Companies are also borrowing cheap money to fund payment of dividends.

In other words, the Fed’s quantitative easing (QE) policy is working. By printing money to buy government bonds (Treasuries, as they’re known in the US), the Fed has driven down interest rates on US Treasuries. It’s also been buying mortgage debt.

As a result, those who want to make any money in the markets, are being pushed further out the ‘risk curve’, as the jargon would have it. What this means is that they are buying ever-dodgier investments in a desperate hunt for returns.

As James Montier of GMO puts it: ‘Bernanke’s first commandment to investors goes something like this: Go forth and speculate. I don’t care what you do as long as you do something irresponsible.’

There are lots of downsides to this. Not least of all, prices now don’t reflect risk ‘at all’, as Sender notes. ‘Should Philippine government debt really be yielding 3.6%?’ she asks.

This mispricing of risk is exactly what happened before the big bust in 2008. So what happens next?

What Does this Mean for Investors?

That depends. How long can the Fed maintain this policy of ‘financial repression‘?

Financial repression is a strategy for buying time while you heal the underlying problems with your economy. You try to stop the whole thing from having a cataclysmic crash, while allowing bursts of inflation to erode your debts.

It’s basically a massive tax on savers of all kinds. As Sender notes: ‘households cannot earn anything on their savings, pension funds are badly underfunded and insurers cannot generate enough investment income.’

But it’s not an easy tightrope to walk. As Scott A Mather pointed out in a piece for bond fund manager Pimco last year, the danger is that alongside financial repression, you get: ‘asset booms / busts, uncontrollable bouts of inflation, sudden stops in economic activity from loss of confidence, or capital flight.’

Moreover, financial repression might not work as well now as it did following World War II, simply because growth prospects in the developed world aren’t as good as they were then.

So plenty can go wrong. This all sounds very depressing. How do you cope with it as an investor?

Well, the good news is that the answer is the same as it usually is: buy stuff that’s cheap and avoid stuff that’s expensive. Bonds in general are too expensive, as we can see pretty clearly from the above examples. Because of this, you run too much risk of losing money in real terms if you invest in bonds today.

What about stocks? As Montier puts it, GMO ‘don’t like stocks as an asset class compared to what we think fair value should be. However, the alternatives are generally really awful.’

The key is to realise that all along this financial repression tightrope, the markets are still going to ‘swing between irrational exuberance and the depths of despair.’

So if you can buy assets when markets are unfairly neglecting them, and sell them when they are over-priced, you should still be able to make a decent return after inflation.

John Stepek
Contributing Editor, Money Morning

Publisher’s Note: This is an edited version of an article that originally appeared in MoneyWeek

From the Archives…

Now it’s the Turn of These Small-Cap Stocks to Rally…
31-11-2012 – Callum Newman

Why It’s Possible to Buy AND Sell This Market
30-11-2012 – Kris Sayce

William Knox D’Arcy: The Greatest Australian You’ve Never Heard Of
30-11-2012 – Callum Newman

Why I’m Bullish on These Beaten-Down Stocks
28-11-2012 – Kris Sayce

Natural Gas to Rule the World
27-11-2012 – Dr. Alex Cowie

Financial Repression All Over Again

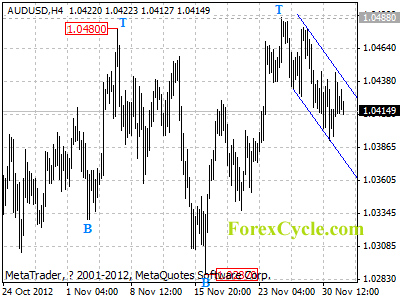
AUDUSD stays in a downward price channel

AUDUSD stays in a downward price channel on 4-hour chart, and remains in downtrend from 1.0488. Initial resistance is now at the upper line of the channel, as long as the channel resistance holds, the downtrend could be expected to continue, and the target would be at 1.0350 area. Key resistance is located at 1.0460, a break above this level will indicate that he fall from 1.0488 has completed, then the following upward movement could bring price to 1.0550 zone.

audusd

Daily Forex Forecast

SP 500 Index at a Crucial Crossroad

David A. Banister- www.MarketTrendForecast.com

We had an interesting 131 point SP 500 decline from the summer-fall highs of 1474 to the recent 1344 lows. Interesting because in the work that I do, we focus on crowd behavioral patterns, sentiment, and Elliott Wave Theory. There is no one technical analysis methodology that works all the time, so it’s important to incorporate other elements into your work to help with some clues. Let’s examine the crossroad we are at right now around 1420 on the SP 500 and why the next move may be a “tell” as they say in poker.

The correction from the 1474 highs can be read as a 3 wave correction, which in Elliott Wave Theory is corrective against the major trend, which so far has been up. 3 wave corrections serve to work off over zealousness of the crowd and above average bullish sentiment. To be sure, at the 1474 highs the sentiment surveys were running pretty hot and near 3 year highs, a flag that waved a warning sign for us. The correction though worked off that sentiment and at 1344 was in fact a Fibonacci 61.8% retracement of the rally from 1257-1474 that we witnessed this summer. These type of Fibonacci fractal retracements at 61.8% are common correction patterns in bull cycles.

What we need to see near term on this crossroad then is a clear cut rally over the 1424 area, which now is a 61.8% upwards retracement of the drop from 1474-1344. Why is that important to clear? Because 61.8% also is a common upwards retracement for a wave 2 counter-rally in a downward trend. Clearing that hurdle would indicate that the rally from the 1344 lows is more than just a counter-trend rally, and likely the confirmed start of a solid leg upwards towards highs for this bull market cycle.

This is why we like to draw these lines in the sands and let our subscribers be aware of what to watch and why. See the chart below to get an idea of where we are at in the current cycle:  Consider joining us so we can help you with daily updates on the SP 500 and Gold, stop scratching your head and guessing as to the patterns in the markets today! 33% discount if you go to www.MarketTrendForecast.com and sign up, and or sign up for our free weekly reports.


David A. Banister- www.MarketTrendForecast.com


Gold, Silver and Miners in Stage 1 Accumulation Mode

By Chris Vermeulen, GoldAndOilGuy.com

We don’t hear much about gold and silver anymore on the news. This time last year you could not go 5 minutes without a TV or radio station talking about them.  Why is this? Simple really, precious metals have been building a Stage 1 Basing Pattern for the last 12 months. This boring sideways trading range is how the market gets most of those long holders out of an investment before it starts another move up. The saying is “If the market doesn’t shake you out, it will wait you out”.

We all know time is money so the above statement makes a lot of sense doesn’t it? Instead of having your money sitting in an investment that has clearly displayed a large sideways range with month and possibly years before any significant breakout will occur, why would you want their money in it doing nothing? There are other opportunities which you could be putting your money into that could generate more gains until the precious metals sector sets up with a high probability trading pattern.

The good news is that gold, silver and precious metal miner stocks are forming a very large Stage 1 Accumulation pattern on the weekly chart. This points to a multi month rally in prices if they breakout above our resistance levels.


Gold & Gold Miner Stocks Weekly Analysis:

The chart below shows a lot of analysis and to the untrained eye this may look messy and confusing, so take your time to review it. In short, what I am showing are sideways price patterns using the previous highs and lows for support and resistance levels. The analysis shows the shift in prices from bearish (down), to Neutral (sideways). The exciting part about this pattern is that a new bull market should emerge if my analysis is correct. Now, I’m not talking about 5 -10% move here, I’m talking about a multi month and possibly a yearlong rally in precious metals that could allow some individuals to retire early if played properly…

A break above our red dotted resistance lines should trigger aggressive buying in gold miners along with physical gold bullion.

Gold Miners ETFs

In the past month I have been giving out some of my Stage 1 trading ideas which have generated some decent gains for those who follow along. All but one have generated gains with FSLR 12.5%, FB 12%, RIMM 54%, AAPL 5%, TLT 2.5%, XLU 1.5%, and KOL down -5.2%. Keep in mind that you can follow my trading charts live for free and get some of my stock and ETF trading ideas here: https://stockcharts.com/public/1992897


Silver & Silver Miner Stocks Weekly Analysis:

This chart of silver and silver miner stocks (SIL), shows a very similar pattern to that of its big shiny sister (Yellow Gold). Silver carries a lot more risk because of its industrial usage. Also this commodity is thinly traded and can move very quickly on a daily basis compared to gold. Because of these quick price movements it has attracted a lot of speculative money which also has increased the volatility. More often than not silver will move 2-3 times more on a percentage bases than that of yellow gold.

Silver Miners ETFs


Battle of the Miner ETFs Weekly Performance:

This chart compares three precious metals miner ETFS (GDX – Gold Miners, SIL – Silver Miners, NUGT 3x Leveraged Gold Miners).

Silver miners have held up the best because the herd saw how big the move was a year ago and are front running the next potential rally. But, depending on how you read the charts and sentiment it may be pointing to the dormant gold miners for a bigger than expected rally. But debating which one will breakout and run the most is a conversation/debate of its own and even I can argue both sides. The safe play is that even if gold miners (GDX & GDXJ) underperform  the silver miners (SIL), the NUGT which is 3x leveraged gold miners should be the same if not outperform silver miners.

Precious Metals Mining Stocks


Precious Metals & Miners Trading Conclusion:

In short, I favor trading the miners over physical bullion simply because the charts show much more profit potential than if one was to buy the bullion exchange traded funds GLD and SLV.

The market seems to be setting up for some very large moves in 2013 and members of my trading newsletter should do very well. Be sure to join and follow along at GoldAndOilGuy.com

Chris Vermeulen


3 Dividend Stocks for Those Who Like to Live Dangerously

By The Sizemore Letter

One of my favorite scenes in the classic James Bond spoof Austin Powers is when Powers sits down at the blackjack table occupied by Dr. Evil’s Number 2. (see “Bond Investing.  JAMES Bond Investing.”)

Number 2’s cards give him 17…and because he “likes to live dangerously” he says “hit me.” (Number 2 has x-ray vision that lets him see that the next card was a 4, but that is not particularly important in this metaphor.)

I also like to live dangerously.

Power’s cards give him 5…and because he “also likes to live dangerously” he decides to stay.

Of course, Powers loses to the house.  It is mathematically impossible to bust when you have a total of five; you would need at least two more cards to exceed 21.  So Power’s decision to stay was not living dangerously; it was a case of not understanding the rules of the game.

This is how I feel when I see investors chasing yield in some dodgy sectors of the market.  Not only are they living dangerously, they are failing to appreciate that they are taking risks at all.

I’ll start with mortgage REIT Chimera Investment Corp (NYSE: $CIM), which yields an impressive 13.7%.

When you hear “REIT” you automatically think of productive real estate.  But that is not at all what Chimera is.  In fact, it has far more in common with a high-flying hedge fund than it does with a staid old real estate investment.  Mortgage REITS like Chimera play the spread game, borrowing large sums of money cheaply and investing it (generally) in mortgage bonds and their derivatives.

The ability of mortgage REITS to maintain their massive dividends depends on the spread between the short-term rates at which they borrow and the prevailing market rate on the mortgages they buy.  Well…have you checked mortgage rates lately?  They are at all-time lows.  And with Bernanke’s QE Infinity in full effect, that’s not likely to change.

But let’s say mortgage rates start climbing tomorrow.  That’s great for future mortgage purchases, but what about the existing portfolio?  It’s book value gets hammered, and the investment manager may be forced to liquidate and sell at a loss if short-term borrowing rates rise.

I’m not telling you to never buy a mortgage REIT.  In fact, I myself have a small position in Two Harbors Investment Corp (NYSE:$TWO) in some of the portfolios I manage.  My point is that these are not your grandpa’s REIT.  If you want stable dividend growth from a pool of real estate, consider something like Realty Income Corp (NYSE:$O).  But invest in mortgage REITs at your own risk.  (Lest you think I am being dramatic, Chimera has seen its share price swing from $3.16 to $1.81 and back to $2.69 over the past 12 months.)

Next on the list is SandRidge Permian Basin Trust (NYSE: $PER), which yields 14.3%.  Oil and gas royalty trusts have become popular in recent years as yield-hungry investors have had a lack of better alternatives.  But these should not be confused with oil-and-gas-based Master Limited Partnerships (MLPs).

I love MLPs.  They pay high and growing streams of tax-deferred income while (generally) taking little commodity price risk. They operate like toll roads, getting paid for the volume of oil and gas they transport, irrespective of the market price.  If bought at a reasonable price, they are about as close as you can get to a perfect investment.

Alas, none of this holds true for oil and gas trusts.   The trusts are highly sensitive to the price of energy and to engineering estimates of their reserves.  But more than this, they are not going concern businesses; they are depleting assets.  You shouldn’t expect long-term capital gains from these; the high income you receive today is all you’re going to get.

Again, this is not to say that you should never buy an oil or gas trust.  Under the right set of circumstances, you can make a killing in them. But these are highly-speculative investments and should not be confused for safe and stable dividend producers.

Finally, I’ll throw out France Telecom (NYSE: $FTE) as an example.  Investors have flocked to American and European telecom stocks in recent years because the high dividend payouts seemed too good to ignore.  I recommended Spanish telecom giant Telefonica (NYSE: $TEF) two years ago primarily for its exposure to Latin America, but its 8% dividend at the time was certainly a sweetener.

Alas, it was too good to be true.  With its domestic market in free fall and its borrowing costs surging, Telefonica suspended its dividend to conserve cash.

Though France Telecom did not face a crisis on the level of Telefonica, it too recently had to cut its dividend, from €1.40 to €0.80.  This dropped the yield from the mid teens to about 9% today.

Even at the reduced payout, France Telecom is one of the highest yielding stocks in the world.  But it operates in a brutally competitive market.  Telecom services are a commodity where the dominant factor to consider is price.  Given that the mobile phone market is saturated in Europe, the only way a provider can grow is at the expense of a rival.  This is a zero-sum game, and it’s not good for profits.  (And this says nothing of fixed-line phone service, which is going the way of the dodo bird.)

Again, I’m not saying that investors should always steer clear of telecom firms.  I still own Telefonica because I consider it an attractive growth play in Latin America.  But telecoms are no longer conservative utilities.  They operate in a brutally-competitive market, and investors should buy at their own risk.

Disclosures: Sizemore Capital is long TWO, O and TEF. This article first appeared on InvestorPlace.

The post 3 Dividend Stocks for Those Who Like to Live Dangerously appeared first on Sizemore Insights.

Gold “Remains in Long Run Uptrend”, Euro Gains After Merkel Comments on Greece

London Gold Market Report
from Ben Traynor
BullionVault
Monday 3 December 2012, 07:30 EST

SPOT MARKET gold prices fell back below $1715 an ounce Monday morning in London, more-or-less in line with where they were two weeks ago after failing to hold gains made during Asian trading.

“Gold is still following its long term uptrend from 2008 lows,” say technical analysts at Scotiabank, “with support from the uptrend at $1632.”

Silver fell back to around $33.50 an ounce, also in line with last week’s close, while stocks edged higher and commodities were broadly flat.

Euro gold prices meantime came close to one-month lows as the Euro rose to a one-month high against the Dollar after comments from German chancellor Angela Merkel that suggested more Greek debt might eventually be written down.

Greece revealed details Monday of the bond buyback program announced last week, through which the government will buy back its bonds currently trading at a discount to par value.

The government has said it will spend up to €10 billion buying back its own bonds, though it is only prepared to pay up to a maximum percentage of the face value of the debt. Bondholders will compete to get the best price for a given maturity, with Athens setting the minimum price range (depending on bond maturity) at 30.2% to 38.1%, with the maximum range at 32.2% to 40.1%.

“[The prices are] higher than previously published or announced,” says Spyros Politis, chief executive of an Athens-based fund management firm that holds Greek government debt.

“At the moment it looks as if it will be successful, or if they miss the target, they will miss it by a small margin. Anything that reduces the overall debt burden is good.”

Chancellor Merkel meantime said over the weekend that a further write down of Greek debt might be possible if Greece’s budget moves into primary surplus – meaning the government takes in more in revenues than it spends before debt payments are taken into account.

“If Greece one day can rely once again on its own revenue,” Merkel told German newspaper Bild am Sonntag, “without having to borrow, then we’ll have to look at this situation and make an evaluation.”

“[This is] the end of denial,” says ING Groep economist Carsten Brzeski.

“It’s definitely a shift, but on the other hand, it’s obvious [that a write down will be needed].”
Germany’s manufacturing sector saw improved conditions last month compared to a month earlier, although output still appears to have declined, according to purchasing managers index data published by Markit Monday.

Germany’s manufacturing PMI rose from 46.0 in October to 46.2 last month, with a figure below 50 indicating sector contraction.

Manufacturing in the Eurozone as a whole also continued to contract but at a slower rate, last month according to PMI data, while it was a similar story for the UK.

China’s official November PMI meantime rose from 50.2 to 50.6. Similar data for the US are due to be published later today.

Negotiations between Republicans and Democrats over how to avoid the so-called fiscal cliff are set to continue this week, with both sides still in disagreement.

“There’s no path to an agreement that does not involve Republicans acknowledging that rates have to go up for the wealthiest Americans,” US Treasury secretary Timothy Geithner told CBS viewers Sunday.

“The president is asking for $1.6 trillion worth of new revenue over 10 years,” said Republican John Boehner, the House of Representatives speaker.

“[This is] twice as much as he has been asking for in public.”

In New York, the so-called speculative net long position of gold futures and options traders – measured as the difference between bullish and bearish contracts held by noncommercial traders – rose for the third week running in the week ended last Tuesday, Commodity Futures Trading Commission data show.

Overall open interest however fell from a week earlier, while the period does not cover last Wednesday, which saw gold drop 1.5% in a few minutes.

“The market remains sustained by the promise of continued monetary accommodation,” says Standard bank commodities strategist Marc Ground.

“The Fed is not going to respond to stronger-than-expected data with tighter policy immediately and, more importantly, the interest rate markets are not going to expect the Fed to change course. If rates can’t rise materially on strong data the Dollar is unlikely to rise materially.”

The world’s biggest gold exchange traded fund SPDR Gold Shares (GLD) saw its bullion holdings rise to a new record on Friday at 1348.8 tonnes, while November saw the largest monthly sales of gold investment coins by the US Mint since July 2010.

Ben Traynor
BullionVault

Gold value calculator   |   Buy gold online at live prices

Editor of Gold News, the analysis and investment research site from world-leading gold ownership service BullionVault, Ben Traynor was formerly editor of the Fleet Street Letter, the UK’s longest-running investment letter. A Cambridge economics graduate, he is a professional writer and editor with a specialist interest in monetary economics. Ben writes and presents BullionVault’s weekly gold market summary on YouTube and can be found on Google+

(c) BullionVault 2012

Please Note: This article is to inform your thinking, not lead it. Only you can decide the best place for your money, and any decision you make will put your money at risk. Information or data included here may have already been overtaken by events – and must be verified elsewhere – should you choose to act on it.


Sterling Drops against the Euro on Increased Optimism

By TraderVox.com

Tradervox.com (Dublin) – The sterling has declined against the euro for the third week in a row where it touched its weakest level in more than a month. The strong euro has been boosted by bets the European policy makers are doing everything possible to resolve the debt crisis dampening demand for the safe haven currencies. The pound remained little changed against the dollar after a report released last week showed gross domestic product climbed by one percent in the third quarter.

The pound declined against the  euro as German parliament approved the rescue package for Greece after a Euro zone finance ministers meeting on November 27, agreed to ease rescue terms for debt-stricken country. UK gilts appreciated as the Bank of Canada Governor Mark Carney was appointed to lead the Bank of England, making him the first foreigner to head the bank.

According to Neil Jones, the head of European hedge-fund sales at Mizuho Corporate bank Ltd in London indicated that the pound decline against the euro has been instigated by the short-term European sentiments over Greece. He also noted that Carney is well respected and suggested that his appointment has been positive for the pound and UK assets. The pound has dropped by 1.4 percent over the last six months, making it one of the worst performing currencies among the ten developed nations’ currencies.

It dropped by 0.3 percent from its November 23 close to 81.18 pence per euro at the close of trading on Friday, dropping to its weakest level of 81.33 pence since October 23. The currency remained little changed against the dollar at $1.6023 and closed the week at $1.6011. According to Ian Stannard, a London-based currency strategist at Morgan Stanley, the selling mood for the sterling will turn more negative as the sterling has been relatively supported by the safety seeking mood in the market.

Disclaimer
Tradervox.com is not giving advice nor is qualified or licensed to provide financial advice. You must seek guidance from your personal advisors before acting on this information. While we try to ensure that all of the information provided on this website is kept up-to-date and accurate we accept no responsibility for any use made of the information provided. Opinions expressed at Tradervox.com are those of the individual authors and do not necessarily represent the opinion of Tradervox.com or its management. 

Article provided by TraderVox.com
Tradervox.com is a Forex News Portal that provides real-time news and analysis relating to the Currency Markets.
News and analysis are produced throughout the day by our in-house staff.
Follow us on twitter: www.twitter.com/tradervox

AUDCAD: Central Bank Policy Decisions Send the AUDCAD Lower

The skirmish between the two commodity dollars this week opened with a bearish start, as the Canadian dollar gained advantage over the Australian currency on speculations over monetary policy decisions tomorrow. A steep 49-pip dive from the 1.0368 price high led exchanges to the price low of the AUDCAD, where downside exchanges are projected to further benefit the North American ComDoll.

Tomorrow, both the Bank of Canada and the Reserve Bank of Australia are scheduled to make public their policy decisions for the remainder of the year. Speculations of policy moves have been rampant the past few months, though both the BOC and the RBA have kept their interest rates on hold for the past month.

For the Canadian central bank, the December 4 meeting is anticipated to yield another non-change after reports last week on gross domestic product and the current-account deficit signaled the nation’s economic outlook is not as robust as it was considered earlier this year. Economic growth slowed to a 0.6 percent annualized pace in the third quarter as consumer spending gains were offset by falling business investment and the fastest export decline since the end of the last recession. For the month of September, the economy seemed to have been stalled, despite a 0.1 percent forecast by economists. Current-account deficit likewise grew to C$18.9 Billion in the third quarter, from C$18.4 Billion in the previous three months. Nevertheless, these economic data only point out that the previously anticipated increase in the 1.0 percent policy rate becomes “less imminent”, reiterating BOC Governor Mark Carney pronouncement on October 24. It seems that the “appropriate” tighter monetary policy Carney has been saying since April would be pushed farther along the road, given the risks to economic growth.

On the other hand, the RBA is believed to lower interest rates tomorrow to shield the economy from a slowdown in mining. Capital expenditure data last week showed that mining investment in 2012-2013 is projected at A$109.4 Billion, lower than the A$119 Billion that was forecast three months ago. Bloomberg reports that, “traders see an 83 percent chance the RBA will lower its overnight cash rate target by a quarter of a percentage point at next week’s meeting, a Credit Suisse Group AG index based on swaps showed. That compares with a 73 percent likelihood shown yesterday.”

True enough, Retail Sales in October failed to meet market expectations of 0.4 percent, as the data came out with a 0.0 change. This reflects that consumers have cut spending on household goods. Additionally, the Building Approvals report for tomorrow is estimated to show a minus 1.8 percent change for October. These economic fundamentals bode ill for the Aussie today, and likely even until tomorrow.

Considering the effect of these news on AUDCAD price activity, a sell bias is recommended today. Technical price corrections are still likely, so take a cautious approach.

For more news, analysis, technical charts and candlestick analysis, visit AlgosysFx Forex Trading Solutions.

Higher-Yielding Assets Give up Gains Ahead of Busy Trading Week

Source: ForexYard

Riskier currencies and commodities, including the euro and gold, reversed some of their recent gains on Friday afternoon after a credit rating downgrade of the European Stability Mechanism and European Financial Stability Fund. This week, a batch of potentially significant news events out of the euro-zone and US virtually ensure market volatility. Traders will want to pay attention to the US ISM Manufacturing PMI today, Tuesday’s Spanish Unemployment Change figure, followed by a Spanish bond auction and the US ADP Non-Farm Employment Change on Wednesday, Thursday’s EU Minimum Bid Rate, and finally to Friday’s US Non-Farm Payrolls figure.

Economic News

USD – Key US Employment Data Set to Drive Markets This Week

The US dollar was able to gain on several of its main currency rivals on Friday as investors shifted their funds to safe-haven currencies following the credit rating downgrade of two EU financial institutions. Against the Swiss franc, the greenback gained more than 40 pips during the first part of the day, eventually reaching as high as 0.9291, before closing out the week at 0.9279. The GBP/USD fell more than 70 pips during the mid-day session, eventually reaching as low as 1.5987 before a slight upward correction brought the pair to 1.6010 when markets closed for the weekend.

This week, several key indicators out of the US are likely to generate market volatility. Today, the ISM Manufacturing PMI could help the dollar extend some of its recent gains if it comes in above the forecasted 51.5. Later in the week, traders will want to remember that the all-important US Non-Farm Payrolls figure is scheduled to be released this Friday. Analysts are forecasting that the figure will come in substantially lower than last month’s result. If true, the dollar could take heavy losses as a result.

EUR – Credit Ratings Downgrade Hurts Euro

The euro took losses against several of its main currency rivals on Friday, following the credit rating downgrade of both the European Stability Mechanism and European Financial Stability Fund. After trading as high as 1.3025 during the early morning session, the EUR/USD began falling and eventually finished out the week at 1.2984. Against the Japanese yen, the euro fell close to 50 pips over the course of European and US trading before closing out the week at 107.08.

This week, in addition to a batch of key US data that is virtually certain to generate volatility for the euro, several news events out of the EU are set to impact the marketplace. Tuesday’s Spanish Unemployment Change followed by a Spanish bond auction on Wednesday will be closely watched by investors with worse than expected data likely to weigh down on the euro. Thursday’s Minimum Bid Rate and ECB Press Conference are also expected to result in losses for the euro if they signal an economic slowdown in the euro-zone.

Gold – Gold Falls amid Global Economic Uncertainties

The price of gold fell during afternoon and evening trading on Friday, as uncertainties regarding the pace of the EU economic recovery, combined with US “fiscal cliff” worries, led to risk aversion in the marketplace. The precious metal lost over $20 an ounce, eventually trading as low as $1708.11 before a slight upward correction brought prices back to $1714.51 when markets closed for the week.

This week, gold traders will want to pay attention to euro-zone news, specifically out of Spain. Any signs that the Spanish government is closer to formally requesting a bailout package could result in risk taking, which may help gold recover some of Friday’s losses. Additionally, if the US Non-Farm Payrolls report comes in above expectations on Friday, gold could see upward movement as a result.

Crude Oil – Crude Oil Sees Gains Ahead of Non-Farms Report

The price of crude oil advanced more than $1 a barrel on Friday amid signs that demand in the US may increase in the near future. As the world’s leading oil consuming country, demand in the US often has a significant effect on the price of oil. Crude was able to gain throughout the day before closing out the week at $88.95.

This week, US economic news is likely to have the biggest impact on oil prices. Traders will want to pay attention to today’s ISM Manufacturing PMI, Wednesday’s ADP Non-Farm Employment Change and Crude Oil Inventories figures, and Friday’s Non-Farm Payrolls. Any better than expected news may be taken as a sign that demand in the US will increase further, which could help crude extend its bullish trend.

Technical News

EUR/USD

The Williams Percent Range on the weekly chart has crossed over into overbought territory, indicating that downward movement could occur in the near future. Additionally, a bearish cross has formed on the daily chart’s Slow Stochastic. Going short may be the wise choice for this pair.

GBP/USD

The Bollinger Bands on the weekly chart are beginning to narrow, indicating that this pair could see a price shift in the near future. Furthermore, the MACD/OsMA on the same chart is close to forming a bearish cross. Opening short positions may be the wise choice for this pair.

USD/JPY

The Slow Stochastic on the weekly chart appears to be forming a bearish cross, indicating that a downward correction could occur in the near future. Additionally, the Williams Percent Range on the same chart has crossed over into overbought territory. Opening short positions may be the wise choice for this pair.

USD/CHF

While the Williams Percent Range on the weekly chart is in oversold territory, most other long-term technical indicators show this pair range trading. Taking a wait and see approach may be the best option here as a clearer trend is likely to present itself in the near future.

The Wild Card

EUR/AUD

The daily chart’s Slow Stochastic is close to forming a bearish cross, indicating that a downward correction could occur in the near future. Additionally, the Williams Percent Range on the same chart has crossed over into overbought territory. This may be a good time for forex traders to open short positions ahead of a possible downward breach.

Forex Market Analysis provided by ForexYard.

© 2006 by FxYard Ltd

Disclaimer: Trading Foreign Exchange carries a high level of risk and may not be suitable for all investors. There is a possibility that you could sustain a loss of all of your investment and therefore you should not invest money that you cannot afford to lose. You should be aware of all the risks associated with Foreign Exchange trading.