What’s so Important about Gold?

By MoneyMorning.com.au

Gold is no longer a contrarian bet.

It features regularly in the money sections of newspapers. There are ‘we buy your gold’ shops everywhere. And more and more funds and financial services companies are setting up to cash in on the boom.

It’s not a bubble either. It’s still held in contempt by the economic ‘elite’. Apart from the odd dissenting voice buried in the back pages, you’ll rarely find a pro-gold story in the FT or The Economist, for example.

But gold’s appeal has certainly been rediscovered by the wider investing public. And it’s little wonder why. Because those ever-so-clever central bankers screwed up badly.

The Best Way to Think of Gold

I find that the best way to think of gold is as a currency.

Gold has been used as money throughout history. That’s because it’s well suited to being money.

It’s durable – you don’t have to worry about it rotting or rusting, so you can hold on to it if you don’t want to spend it right away.

It’s fungible – one bit of gold of a given quantity is just like another. And it’s portable, within reason.

Indeed, gold had an official role in the monetary system right up until 1971, when Richard Nixon severed the link between gold and the US dollar.

What’s special about gold is that it’s a currency that no one can print. You have to dig it out of the ground. It also can’t go bust. History is littered with paper currencies that are literally worthless. Gold’s value has never fallen to zero.

So at a time when central banks are printing money like mad, with no clear idea of what impact it might have, it makes sense that demand for gold increases. Because, to put it simply, the amount of paper money in the world is going up a lot faster than the amount of ‘real money’ – gold.

That’s the case for owning it, and I think it’s a sensible one. But how much of it should you own?

Gold as Insurance

I like gold. But after 11 years of constant increases, I believe we’re nearer to the end of the gold bull market than to the start. This is the stage where more and more people are going to start piling in for the wrong reason. They’ll buy gold because it’s going up, not because it’s a sensible investment.

That means that this is also the stage where – even though there are likely higher peaks ahead of us – some people are going to start getting badly burnt in the inevitable panic sell-offs.

So it’s important to get your rationale for buying gold right. It’s not 2001 anymore. You can’t just buy it and sit on it, safe in the knowledge that chances are, it will never ever be that cheap again, and that you’ll always be able to sell at a profit.

And if you’re hoping to ‘ride the bubble’ when it comes, put that thought out of your head right now. That way, financial disaster lies. Timing a bull or bear market is painful. No one can know when the final peak or trough will come.

So what do you do?

Well, another way to think of gold is as an insurance policy. You don’t put your entire portfolio in gold. It’s something that you hold to insure the rest of your portfolio against financial disaster.

The possibility of such a disaster seems quite high just now, which is why the insurance policy (gold) is more expensive than it once was.

So we’d suggest that you invest 5-10% of your portfolio in some form of physical gold (gold stocks are separate – they’re driven by more than just the gold price, and they’re certainly not insurance).

And when you check your portfolio every six months or so, you rebalance accordingly – if gold’s share of your portfolio is creeping higher, sell some and invest in something else. If it’s dipping, then top it up.

That way, you’ll profit from the inevitable ‘bubble’ phase. But you won’t be left over-exposed when prices go down, as they one day will.

And when the gold bull-run is over, you’ll be pleased. Because when the gold price re-enters a bear market, it’ll be because the wider economy is finally turning around. And you’ll be able to buy cheap insurance again for the next crisis.

John Stepek
Contributing Editor, Money Morning

Publisher’s Note: This article originally appeared in MoneyWeek

From the Archives…

Beer and Tax in Retirement
5-10-2012 – Nick Hubble

Possibly the Most Important Thing You Will Ever Read in Money Morning
4-10-2012 – Nick Hubble

What Central Bank Money Printing Means for Small-Cap Stocks
3-10-2012 – Kris Sayce

This is What a Million Dollars of Liquid Gold Looks Like
2-10-2012 – Dr. Alex Cowie

Japan’s Energy Crisis and the Take Away for Aussie Investors
1-10-2012 – Dan Denning

What’s so Important about Gold?

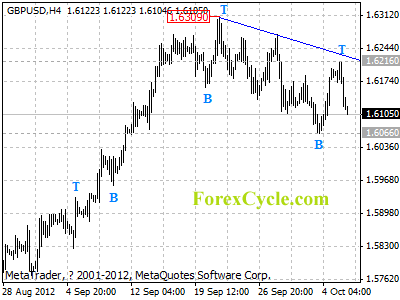
GBPUSD pulled back from 1.6216

GBPUSD failed to break above the resistance of the downward trend line on 4-hour chart, and pulled back from 1.6216 last Friday, suggesting that a cycle top has been formed on 4-hour chart. However, the fall from 1.6216 would possibly be correction of the uptrend from 1.6066, as long as 1.6066 support holds, another rise to re-test the trend line resistance is still possible, a clear break above the trend line could bring price to 1.6500 area. On the downside, a breakdown below 1.6066 support will indicate that the pair remains in downtrend from 1.6309, then deeper decline to 1.6000 area could be seen.

gbpusd

Daily Forex Forecast

Central Bank News Link List – Oct. 8, 2012: Field narrows for next Bank of England chief

By Central Bank News
Here’s today’s Central Bank News link list, click through if you missed the previous link list. The list comprises news about central banks that is not covered by Central Bank News. The list is updated during the day with the latest developments so readers don’t miss any important news.

Central Bank News Link List – Oct. 8, 2012: Osborne confronts small world of BOE as choice looms for governor

By Central Bank News
Here’s today’s Central Bank News link list, click through if you missed the previous link list. The list comprises news about central banks that is not covered by Central Bank News. The list is updated during the day with the latest developments so readers don’t miss any important news.

Economic Gloom or Recovery? 5 Signs That One is Ahead

The economy has never really recovered since the 2007-2009 financial crisis
October, 2012

By Elliott Wave International

Several signs suggest economic contraction instead of expansion.

The first was recent front-page news: 8.1% August jobless rate. The number would have been higher, but it excludes people who gave up the job search.

The second is summed up by this Sept. 4 Bloomberg headline:

Food-Stamp Use Climbs to Record

Nearly one in seven Americans use food stamps. Before the downturn it was one in 10.

You can find the third sign at the other end of the income scale.

The chart shows that after a multi-decade bull market that tracked the major stock indexes, lobster prices (per pound) peaked in 2005, one year ahead of the global downturn. The timing of the lobster price top is so close to the downturn in home prices that the Maine Department of Marine Resources noted, “Interestingly, a ‘lobster bubble’ coincided with the national ‘housing bubble’ in 2006. … The six-year divergence between per-pound prices and total pounds (shown by the trendlines on the chart) suggests that lobster mania will not be back for a long time. Luxury is a classic byproduct of a bubble.

The Elliott Wave Financial Forecast, August 2012

Speaking of the parallel trend of lobster and home prices, a Sept. 18 Wall Street Journal excerpt reveals the fourth sign of a deflationary trend:

Mortgage lending declined to its lowest level in 16 years in 2011 amid weak demand for mortgages and tighter lending standards.

A Sept. 19 Reuters article says the latest housing data is mixed:

U.S. housing starts rose less than expected in August as groundbreaking on multifamily home projects fell, but the trend continued to point to a turnaround in the housing market.

Yet we’ve seen “hopeful signs” of a housing recovery before. The larger trend for real estate points in the opposite direction.

The fifth sign is summed up in this Sept. 18 CBS headline:

Median Income Worse Now Than It Was During Great Recession

The article says:

The median income for American households in 2009 – the official end of the Great Recession – was $52,195 (in 2011 dollars), while the median income dipped to $50,054 last year, falling 4.1 percent over two years. … The recovery is the “most negative for household income during any post-recession period in the past four decades.”

The “Great Recession” never ended. A more accurate way of describing the state of the economy is the onset of “depression.”

Have you prepared your portfolio for what’s ahead? See below for an offer to view 8 chapters of Robert Prechter’s New York Times bestseller, Conquer the Crash.


8 Chapters of Conquer the Crash

This free, 42-page report can help you prepare for your financial future. You’ll get valuable lessons on what to do with your pension plan, what to do if you run a business, how to handle calling in loans and paying off debt and so much more.

Get Your FREE 8-Lesson “Conquer the Crash Collection” Now >>

This article was syndicated by Elliott Wave International and was originally published under the headline Economic Gloom or Recovery? 5 Signs That One is Ahead. EWI is the world’s largest market forecasting firm. Its staff of full-time analysts led by Chartered Market Technician Robert Prechter provides 24-hour-a-day market analysis to institutional and private investors around the world.


WEEKLY MARKET OVERVIEW

FUNDAMENTAL OVERVIEW
The biggest news event of the week will be release of United State’s unemployment data coming up on Friday, October 5th. General forecast suggest the rate to be stable compared to last month’s According to American Bureau of Economic Analysis, consumer spending increased 0.1% in previous month. However, American household savings rate went down to 3.7% from previous 4.1%. The data suggest that consumers had to pay for their spending from savings and not from rising income level. Thus, a sustainable increase in demand and recovery of the economy is not likely to happen anytime soon.
Across the pond, what will move the markets the whole week around the world  is data coming up from Eurozone. According to Eurostat (EU’s statistics department) mentioned that consumer inflation has gone up from seasonally adjusted annual rate of 2.7% to 2.6% in the previous month. Based on that we presume European Central Bank will not be lowering the rates this month. However, increasing the policy rate will hurt the recovering economy. Hence, ECB is likely to leave their interest rate to current level.
Disappointing news from Japan continues as their industrial output decreased more than expected levels during August. Japan’s Ministry of Economy, Trade and Industry reported that industrial production fell to -1.3% compared to -1% from July 2012. Beside reducing export orders from Japanese car and electronics industries, Japan is facing boycotts and political downturn in China which will likely to impact the export market of Japan.  As a result Japan’s Nikkei 225 average fell 73.65 points last week, a -0.83% decrease overall.

INTERESTING PAIRS OF THE WEEK

EUR/USD

EUR/USD had a mid-term bullish run since July 25. However, for the last several days, the pair has been sloping downwards. We expect that 200 SMA support at 1.2800 will hold the pair. However, if price manages to close below 1.2780 this week, expect the pair to continue its longer term bearish trend indefinitely.

GBP/USD

The pair rallied to 1.6300 and it was an unsustainable move. However, GBP/USD has formed a decent upward equidistant channel as illustrated in the chart. If the pair manages to close below the lower trend line of the channel, expect it to retrace and continue downwards. However, most likely the pair will be ranging this week.

USD/JPY

Technically, USD JPY is in a range market with a slight bearish sentiment. However, Bank of Japan is unlikely to let the pair appreciate as it will hurt their export market. Last Friday, USD/JPY had a bullish candle engulfing previous 3 days. We are expecting the pair to move upwards to 78.10 area to test last week’s resistance. If broken, this week the pair could reach as far as 78.60. Expect USD/JPY to stay range bound till Friday. Once the US unemployment data is released we will have ample data to formulate a directional bias in the pair. Till then a range bound market is expected this week.
Visit exchange-rate.ca to get all the exchange rates .
BestForexTradingPlatform.uk offers you to get the best forex trading platform and start trading forex like a pro.

Pakistan cuts rate to 10% on improved inflation outlook

By Central Bank News
    The central bank of Pakistan cut its policy rate by another 50 basis points to 10.0 percent, a move that was expected by economists, due to an improved outlook for inflation.
    The State Bank of Pakistan (SBP), which also cut its policy rate by 150 basis points in August, for a total of reduction of 200 basis points this year, said inflationary expectations persisted due to high rates in the past, but this may change as inflation continues to decline.
     “A consistent deceleration in inflation since May 2012, to 8.8 percent in September 2012, is more than earlier estimates. Thus, despite an expected uptick in H2-FY13 the overall inflation outlook has improved,” the SBP said in a statement.
    With the decline in inflation to 8.8 percent from 9.10 percent in August, inflation hit its lowest rate since December 2009, a move that fueled hopes the SBP would cut rates today. The SBP said it was increasingly likely that it would meet its 9.5 percent inflation target for fiscal 2013.

    The SBP called on comprehensive fiscal reform and a lower government deficit, which would have a positive influence on commercial banks that currently find it easy to avoid lending to the private sector by extending credit to the government without any risk.
    “A declining interest rate environment should leads towards a rethink of this strategy,” the SBP said, noting that lending to the private sector declined to an annual rate of 0.7 percent at then end of fiscal 2012 from 22.4 percent in fiscal 2008.
    A persistent shortage of energy is also holding back the private sector and the SBP called for an overhaul of the governance of the energy sector, which would also help growth and lower the amount of subsidies and thus the borrowing requirements.
    “Thus, at a broader level, the effectiveness of SBP’s current monetary policy stance continues to weigh upon improvement in the fiscal position, better availability of energy, and an increase in foreign financial flows,” the SBP said.
    Pakistan’s Gross Domestic Product expanded by an annual rate of 3.67 percent in the second quarter from 3.04 percent in the first quarter.
    The SBP said it would also strengthen its liquidity management framework and would issue details of these measures separately.
 
    www.CentralBankNews.info

Dollar Gold “Decidedly Bullish”, Targets $2400 by Mid-2013 as Indian Demand Turns Higher

London Gold Market Report
from Adrian Ash
BullionVault
Fri 5 Oct, 07:10 EST

WHOLESALE U.S. Dollar gold prices slipped 0.4% from new 11-month highs in London trade Friday morning, dipping beneath $1790 per ounce as European stock markets crept higher.

Wholesale silver bullion prices eased back below $35.00 per ounce – but also held 1.1% up for the week – as commodities held flat and major-economy government bonds ticked lower.

The Euro currency held above $1.30 despite a sharp drop in Germany’s industrial orders data.

Latest US jobs market data were due just ahead of the start of New York trade, with analysts expecting on average a rise of 113,000 last month from August.

“The labour market needs to improve for QE3 to end and, if it does not improve as the Fed wants, other [monetary policy] measures will be introduced,” reckons Standard Bank strategist Steven Barrow.

“If the third round of quantitative easing leads to further weakness of the US Dollar, [other] central banks may be prompted to switch more cash reserves into gold,” says Evy Hambro, co-manager of the UK’s giant Blackrock Gold & General mining-stock fund.

The chart of Dollar gold prices, says a new report from Hambro’s team, “has turned decidedly bullish with the 50-day moving average rising above the 200-day moving average.

“The last time this happened was in February 2009…shortly after the implementation of QE1. Then, gold was $900 and never looked back. Should we witness a similar rally, prices would be taken to $2,400 by midsummer next year.”

Bank analysts and trading desks today cited “further support” for gold prices from geopolitical tension over fighting on the Syria-Turkey border, plus the fast-spreading industrial unrest in South Africa – world #6 for gold mining output.

Japan’s Toyota Motor Corp.  said workers would return today to its Durban plant after it granted the 5.4% pay rise demanded during 4 days of wildcat stoppages.

Toyota’s car sales in China were 40% down in September  from the same month last year, it said today, amid violent protests and consumer boycotts sparked by Japan’s purchase of disputed islands in the East China Sea.

“The gold market and for that matter most markets love big figures and tend to gravitate towards them,” says David Govett at privately-owned commodities broker Marex Spectron.

“The $1800 level may not be the most important figure technically, but…if we can break above and hold this should give us impetus towards the mid-1800s.”

Calling momentum in the gold price “impressive” however, one London market-maker says “Buyers have been meeting a good deal of sellers – the [mining] producers.

“Hence we find it impressive that the market did not pull back.”

Looking at the $1791-1800 price level, “Thick producer and physical offers were present on the last 2 attempts through this area,” agrees Swiss refinery MKS’s Moudi Raad in Geneva.

“I think we will have to see some significant macro news to push us through this.”

Over in India, meantime – home to the world’s heaviest gold consumers, with private households accounting for 1 ounce in every 5 sold worldwide over the last decade – importers of gold bullion have been re-stocking their inventory on the recent dip in Rupee gold prices, the Economic Times reports.

“There has been a sustained pickup in the last 10-15 days as people are comfortable with the current rates,” the paper quotes Harshad Ajmera of the JJ Gold House wholesalers in Kolkata.

Next month brings the Hindu festival of Diwali, typically the peak season for India gold demand amid the post-harvest wedding season.

Adrian Ash
BullionVault

Gold price chart, no delay   |   Buy gold online at live prices

Adrian Ash is head of research at BullionVault, the secure, low-cost gold and silver market for private investors online, where you can buy gold today vaulted in Zurich on $3 spreads and 0.8% dealing fees.

(c) BullionVault 2012

Please Note: This article is to inform your thinking, not lead it. Only you can decide the best place for your money, and any decision you make will put your money at risk. Information or data included here may have already been overtaken by events – and must be verified elsewhere – should you choose to act on it.


AUD/USD: Jobs Data Seen to Highlight Weak US Labor Market

Article by AlgosysFx Forex Trading Solutions

The US dollar is deemed to regain strength opposite the Australian dollar on reduced appetites for risk as today’s highly awaited Non-Farm Payrolls report is foreseen to underscore the lingering weakness of the labor sector. Meanwhile, sentiment for the Aussie is presumed to deteriorate further as a gauge of construction shrank the most in twelve months in September.

American employers are believed to have added 114,000 jobs last month, higher than the 96,000 count seen in August but still short of what is considered needed to slash the jobless rate. Indeed, the Unemployment Rate is estimated to edge up from 8.1 percent to 8.2 percent, in part because more Americans likely resumed the hunt for work. Apart from continued uncertainty regarding slowing growth overseas, economists blame the so-called fiscal cliff for the slowdown in hiring. A failure by Congress to avoid automatic tax hikes and government spending cuts is seen to take away about $600 Billion from the economy next year, the Congressional Budget Office warned.

Job growth proved strong at the start of the year, but it began to put on the brakes in March. Job gains averaged around 96,000 from February to August, well below the 125,000 normally needed just maintain the jobless rate steady. Unemployment has remained stuck above 8 percent for more than three years, and the economy is still around 4.7 Million jobs short of where it stood when the 2007-2009 recession started. According to economists, manufacturing payrolls are seen to have been flat in September after posting their first drop in almost a year in August. Employment in construction is also expected to show little improvement. Government payrolls are also projected to have declined for the seventh straight month. The only upside is the recorded jump in automobile sales. With job growth continuing to be lackluster, average hourly earnings are seen to have inclined by only 0.2 percent last month after a stagnant reading in August.

Over to the Land Down Under, the Australian Industry Group reported that its construction performance index contracted last month by the most in 12 months as residential and commercial construction continued to fall. The sector has been contracting for 28 consecutive months, with steep declines in activity, employment and deliveries highlighting its weakness. With the sluggish US labor market and the weak Australian building sector, risk-off trades are believed to take center stage, warranting a short position for the AUD/USD today.

For more news, analysis, technical charts and candlestick analysis, visit AlgosysFx


70 Second Market Outlook – Metals, Dollar, Bonds, Stocks, Energy

By Chris Vermeulen, TheGoldAndOilGuy.com

Over the past year we have had some really interesting things unfold in the market. Investing or even swing trading has been much more difficult because of all the wild economic data and daily headline news from all over the globe causing strong surges or sell offs almost every week.

For a while there you could not hold a position for more than a week without some type of news event moving the market enough to either push you deep in the money or get stopped out for a loss. This has unfortunately caused a lot of individuals to give up on trading which is not a good sign for the financial market as a whole.

The key to navigating stocks which everyone thinks are overbought is to trade small position sizes and focus on the shorter time frames like the 4 hour charts. This chart is my secret weapon and giving you both large price swings which daily chart traders focus on while also showing clear intraday patterns to spot reversals or continuation patterns with precise entry/exit points.

While I could ramble on about why the stock market is primed for major long term growth from this point forward I will keep things short and simple with some 4 hour and daily charts for you to see what I see and what I am thinking should unfold moving forward.

Keep in mind, the most accurate trading opportunities that happen week after week are the quick shifts in sentiment which only last 2-5 days at most which is what most of my charts below are focusing on…

Dollar Index – 4 Hour Chart

This chart shows a mini Head & Shoulders reversal pattern and likely target over the next five sessions. The dollar index has been driving the market for the past couple years so a lower dollar means higher stock and commodity prices.

Dollar Index Trading

Dollar Index Trading


Bond Futures – 4 Hour Chart

Money has been flowing into bonds for the past couple weeks with most traders and investors expecting a strong correction in stocks. As you can see the price of bonds hit resistance this week and as of Thursday has now started selling off. Money flowing out of this “Risk Off” asset means money will move to the “Risk On” investments like stocks and commodities.

Bond Futures Trading

Bond Futures Trading


Gold Futures – Daily Chart

Gold is stuck in both categories in my opinion. It is a “Risk Off” safe haven when people are scared of falling stock prices, and it is also a “Risk On” speculative investment when people are feeling good about the market. Gold has been trading at key resistance for a couple weeks and looks as though it’s starting its next rally.

Gold Futures Trading

Gold Futures Trading


Silver Futures – Daily Chart

Silver is in the same boat as gold though it carries much more volatility than gold. Expect 2-4% swings regularly and sloppy chart patterns in this metal.

Silver Futures Trading

Silver Futures Trading


SP500 Futures – Daily Chart

As much as everyone hates to buy stocks up at these lofty prices I hate to say it but I think they are going to keep going up and they could do this for a long time yet. If the dollar index continues to break down then I expect the SP500 to rally another 3% from here (1500) in the next 1-2 weeks.

SP500 Futures Trading

SP500 Futures Trading


Crude Oil Futures – 4 Hour Chart

Crude oil has not had much attention from me in the past few months. While it has had big price action many of those big days took place on news causing an instant price movement making this extra dangerous to trade. I continue to watch rather than get attached to it.

Crude Oil Futures Trading

Crude Oil Futures Trading


Natural Gas Futures – Daily Chart

Natural gas has been a great performer for us in the past 6 months as all the short positions slowly get covered. I just closed out my natural gas ETF trade this week with a 31.9% gain and plan on getting back in once the chart provides another low risk setup.

Natural Gas Futures Trading

Natural Gas Futures Trading


Trading Conclusion:

In short, I feel the dollar index along with bonds will correct over the next few weeks. That will trigger buying in stocks and commodities. Keep in mind natural gas dances to its own drum beat. The dollar does not have much affect on its price and most times natural gas is doing the opposite of the broad market. Get My Pre-Market Trading Analysis Video and Intraday Chart Analysis EVERY DAY – www.TheGoldAndOilGuy.com

Chris Vermeulen