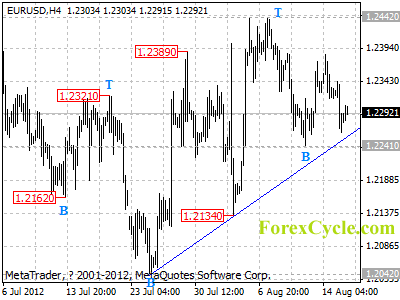
EURUSD is facing the support of the upward trend line from 1.2042 to 1.2134 again, rebound could be expected after touching the trend line, and another rise to test 1.2442 would likely be seen. On the downside, a clear break below the trend line will indicate that that rise from 1.2042 has completed at 1.2442 already, and the longer term downtrend from 1.3486 (Feb 24 high) has resumed, then the following downward movement could bring price to 1.1700 area.
Investing in Drug-Resistant Antibiotics
Article by Investment U
View the Investment U Video Archive
In focus this week: investing in drug resistant antibiotics, how the drought may ding the EMs and the SITFA
Small drug companies that are developing antibiotics for some of the scariest infections, those resistant to traditional antibiotics, haven’t gotten much attention from the market, but that’s all about to change.
A new law called the “Generating Antibiotics Incentives Now Act,” GAIN, will make it much more profitable to work on ways to kill these super bugs.
The two companies a Barron’s article mentioned, Cubist Pharmaceuticals (Nasdaq: CBST) and Cempra (Nasdaq: CEMP), have bright futures in these new drugs. The drugs in their pipelines could double in value.
The new GAIN law would allow these companies to have the FDA review period cut by a third and will have 10 years of market exclusivity to hold off generics. Over the next decade these new drugs could generate as much as $2 billion, says David Holman, an analyst with Decision Resources.
An RBC Capital Markets analyst says the Cubist drug Cubicin could reach super star status by 2017. Cubicin is used to fight potentially fatal infections from bacteria like MRSA.
And, earnings for Cubist are expected to grow by 27% a year for the next few years.
Cempra has two antibiotics due to enter Phase III clinical trials, solithromycin and taska. Taska is unique because it’s used for chronic infections that can take months and years to treat, but analysts think it could be 2016 before they turn a profit. But this is one you should keep an eye on.
The fear of drug resistant bugs will drive this segment of the market and it is definitely something you should have on your bogey board…
The Drought Hits the EMs
Jeremy Grantham, the Chief investment Strategists of Boston-based GMO, just sent out a 17-page letter to his investors that addressed what he called the strains the world will feel because of increasing demand and strained supplies of water and grain.
Grantham says we’re already five years into a global food crisis that will threaten the poorer countries of the world, many of them EMs, with malnutrition, starvation and even collapse.
But David Riedel of Riedel Research, an EM research firm, said the biggest threat to the EMs may be the inflation that results from increased food costs driven by the drought here in the U.S.
The drought in this country has already significantly pushed up corn and wheat prices. The Teucrium Soybean Fund, symbol SOYB, and the Corn Fund, symbol CORN, are up 20% this year alone.
Corn yield estimates were revised downward in June by 12%, soybean yields are expected to be their smallest in four years and grain futures are up across the board.
The situation, according to Riedel, is most serious for China, who’s the largest importer of U.S. soybeans and a big food importer.
If food inflation puts enough pressure on the Chinese, they may have to rethink their credit loosening policy. If that happens there may be an even greater slowing in the second-biggest economy on earth.
Higher food prices for countries that rely heavily on food imports, China in particular, will not be good for growth.
Grantham stated in his letter to his investors that this food situation is being underestimated by just about everyone but some military establishments.
That’s also not a good thing and this isn’t something we want to have sneak up on us. Keep an eye on grain and corn estimates, and their prices. If the drought numbers are as bad as everyone is predicting, this could be a completely unexpected negative for the EMs….
Finally, the SITFA
This week it goes to those countries that are paying their Olympic athletes for medals.
It seems Italy, specifically the government of Italy, is paying their athletes as much as $150,000 per gold medal, and in the U.S. a gold medal is worth $25,000, paid by the Olympic committee.
That was news to me. I thought these folks were amateurs.
But, the big cheek smacker winner this week is North Korea who gives their medal winners cars, apartments and an instant boost in status, even full-size refrigerators. Wow!
If they don’t win, well, they could end up with an all-expense paid trip to a labor camp. I’m serious, this is not out of the question, especially if they are found to have dishonored Kim Jong-Un by losing to the U.S. or South Korea.
I’m not making this up, labor camps.
Talk about motivation. Hmm, let’s see, a refrigerator or a few years in a labor camp… tough choice.
Good Investing,
Steve
Article by Investment U
Why the Meltdown At Knight Capital (KCG) Was a Good Thing
Article by Investment U
By now, most traders and investors are aware of the boondoggle at Knight Capital (KCG) two weeks ago.
In less than an hour, the firm’s computers executed a series of orders – involving millions of shares – that were supposed to be spread out over a period of days. The resulting loss – almost four times the company’s 2011 profit – crippled the firm and brought it to the edge of bankruptcy.
This glitch, coming on the heels of the Flash Crash in March 2010, where the Dow suddenly plunged nearly 1000 points only to recover those losses within minutes, has further eroded the confidence of many investors. Indeed, some are throwing in the towel, insisting that the stock market is too treacherous a place – and certainly no home for your hard-earned savings.
“Faster, Easier, Cheaper and More Transparent”
This increasingly commonplace view is almost certainly wide of the mark. The truth is the individual investor has never had it better. Technology, competition and, yes, even regulation have combined to make trading faster, easier, cheaper and more transparent than ever before. Better still, today’s deep-seated skepticism about the stock market is handing you an opportunity on a silver platter. Here’s why…
SEC Chairman Mary Schapiro called Knight’s glitch “unacceptable.” And indeed it was. But circuit breakers in individual stocks were instituted after the Flash Crash. These guide the exchanges in determining which trades can be rescinded, giving the marketplace greater certainty. And the Knight incident will speed up a proposed rule to increase penalties on firms whose systems don’t work as designed.
This is part of the long march toward greater investor protection. In 1997, for example, a settlement between regulators and Nasdaq market makers accused of price fixing dramatically reduced the spread between buy and sell orders, saving traders millions of dollars.
When I was a stockbroker in the 1980s, the spread between stocks was often an eighth of a point, sometimes a quarter. In the 90s, it changed to a sixteenth of a point. In 2001, the SEC required prices to be quoted in decimals rather than fractions of a dollar, narrowing spreads even further. In the past decade spreads were reduced to pennies – and some stock spreads today are a fraction of a penny. This is all good. Tighter spreads mean bigger net profits for traders.
Money Loves Speed…
Executions are also vastly improved. In the 1990s, it took minutes to get a trade confirmation. By 2004, the average order was filled in 12 seconds. Today, it’s less than a second. That’s a huge advantage, especially in a fast-moving market.
These days, individual investors with a high-speed internet connection are likely to receive real-time quotes and news feeds. They have more sources of information and analysis than ever, and much of it – like Investment U itself – is free.
And this widespread skepticism about the stock market? It’s not just a good thing. It’s what investors who understand the psychology of the market actively seek: a bleak outlook.
According to the Investment Company Institute, last year investors yanked $132 billion from mutual funds that invest in U.S. stocks, the fifth straight year of withdrawals. And – thanks to gathering storm clouds in Europe – April saw this biggest net redemption of equity funds of any April in 17 years.
Don’t Follow the Herd
How can this be a good thing? Because heavy net mutual fund redemptions are an excellent contrarian indicator. When investors pile into equity funds willy-nilly, as they did in the late 90s for example, it generally means the end of the bull market is near. And when they cash out in a big way, as they have over the past several years, it means stocks are a bargain. Those who understand stock market psychology aren’t surprised that the stock market has doubled since the March 2009 lows – when pessimism was rampant – and remains cheap today at just 13 times trailing earnings.
Gallup recently asked Americans: “If you had a thousand dollars to spend, do you think investing it in the stock market would be a good or bad idea?” A clear majority answered “bad idea.”
This is good news indeed. Investment legend John Templeton once observed that bull markets are born on pessimism, grow on skepticism, peak on optimism and die on euphoria.
Do you seriously believe we are anywhere near optimism or euphoria about stocks?
Me neither. And that’s a good indicator this bull market has legs.
Good Investing,
Alex
Article by Investment U
How Self-Driving Cars Are Coming Sooner Than You Think
Article by Investment U
Every so often, an invention comes along that completely changes the world.
For instance, the automobile and the airplane revolutionized how people travel.
And the computer and the internet allowed us to communicate and analyze data faster than anyone thought possible a few decades ago.
Fast-forward to today, and Google (Nasdaq: GOOG) is next in line to change the world in a way we’ve never seen before.
How’s it set to do so?
Self-driving cars.
The Future of Transportation
When Sebastian Thrun was 18, he lost his best friend to a car accident.
From that moment, he vowed to make cars better so people don’t need to die just driving from one place to another.
Today, he’s a Google VP and helped build Google’s driverless cars. In 2011, he spoke at a TED Conference and showed everyone just how revolutionary self-driving cars could be.
Even more promising, Google announced last week that of its dozen self-driving cars on the road, they’ve logged 300,000 miles and “there hasn’t been a single accident under computer control.”
Such data presents a strong case why self-driving cars may be necessary in today’s society.
The sad fact is, according to the U.S. Census Bureau, there are nearly 11 million auto accidents each year in America. Of those wrecks, 35,000 of them are fatal.
That’s 96 deaths per day just because someone made a mistake driving a car.
Even worse, it’s estimated there are some two million fatal crashes around the world every year.
It’s scary to think about.
But this is where self-driving cars could help. Not to mention the fact that they could also be used to reduce traffic jams and aggressive driving, as well.
Google says driverless vehicles could make a sizeable impact on the auto market by 2020. However, Ford (NYSE: F) is looking to bring them to consumers even sooner than that.
By 2017, the company expects an autonomous-driving mode will be available in its vehicles. That’s just five years away.
What’s more, there are at least five other driverless car projects underway around the world.
A few include projects at Audi, Volkswagen (OTC: VLKAY.PK) and Volvo (OTC: VOLVY.PK).
However, you may not have to wait for car companies to profit from the next revolution in car technology.
Looking Behind the Scenes
It’s estimated that autonomous vehicles generate about 1GB of data per second.
Now multiply that number by the vast number of cars on the road, and you’re looking at a massive amount of data to process and analyze.
That’s why companies involved in the big data space are also poised to gain from driverless cars.
Already, Oracle (Nasdaq: ORCL) helped Audi complete a TTS research car that completed a 12.4-mile climb of Pikes Peak in Colorado. It’ll almost certainly continue to be a major player the more driverless vehicles break into the marketplace.
Raytheon (NYSE: RTN) is another company that’s notably worked on driverless vehicle projects.
Nevada, California and Florida have all recently passed legislation that legalizes the use of autonomous vehicles. And Oklahoma and Hawaii are considering rules to legalize driverless cars as early as this year.
Momentum is moving quickly for self-driving vehicles. It’s going to be fun watching this revolutionary technology improve the driving experience.
Good Investing,
Mike
Article by Investment U
Bullish On Equities? Long Apple At New High Instead
On July 16th we posted a bullish technical setup that was developing on Apple (AAPL). We were rather bearish on equities at the time and didn’t take the trade, however with the recent market rally it may be time to take another look at potentially taking a long on Apple. In doing so, let’s take a look at some of the underlying fundamentals and events that are driving the stock. Before that however, I should point out a position on Apple should be incorporate alongside an outlook on the general market as it will trade in step with the direction of the market. I am suggesting that rather than taking a position in QQQ or SPY, a long position in Apple may be optimal.
As of Fridays close Apple was trading around $620 with a P/E of 14.6 and a dividend yield of 1.705%. I’ll quickly point out to the novice investors that Apple isn’t in fact expensive as many believe it to be. A P/E under 15 is quite low for a company that’s maintained considerable growth, especially in comparison to other high flying tech stocks such as Amazon (AMZN) and LinkedIn (LNKD), with P/Es of 289 and 954 respectively.
Contributor “Post At Eventide” put out a recent article that had a great graph illustrating the cash per share compared to the P/E. If we were to overlay that will the stock price we would see that both cash per share and the market price has continued to increase while there has been moderate P/E compression. With cash increasing, P/E decreasing and already low, and a dividend yield that’s outperforming the 10year US bond, a long in Apple truly looks good fundamentally.
AAPL PE Ratio
Rumors have it that the IPhone 5 release is in the very near future, with leading tech site Mashable citing a potential date of Septembers 12th. It goes without saying that the iPhone has been an incredible success to date and continues to be a significant source of profits for the company. That being said, there has been considerable discussion about the new Samsung Galaxy being the “Apple iPhone Killer”. And, anyone who happened to tune into the Olympics over the last two weeks likely noticed the large marketing campaign Samsung launched in order to build up its brand for the Galaxy SIII.
There are quite a few problems with the “iPhone Killer” thesis however:
- Apple products are already highly integrated into many households, with the average American household owning at least one Apple product. With the entire suite of products working seamlessly together, it is unlikely that a large majority will be quick to shift to Samsung
- While the Samsung SIII offers a larger screen that may appeal to some users, it won’t necessarily appeal to everyone. Further, beyond the difference in screen size, the remaining phone specs and prices are comparable.
In the rumor mill has also been substantial chatter to the possibility of the iPad mini. As was the case with the initial iPad, there has been mixed reactions about the viability of this product. However Apple to date has not provided any reason to doubt their new product implementation, and the introduction of the iPad mini could be another significant source of profits for the company.
With potentially two new products in the pipeline, and the stock trading down at a 2 year low P/E, it may be time to look for a long term entry position into Apple. I’ll note that as of Friday’s close the recommended trade we put out was already up 6% from our entry around $580.
From here I think a break above $645 will trigger more buying by long term investors sparking another rally that could last 2-3 weeks before having a small pullback in price.
If we take a look at an updated chart, we tend to see lighter volume levels prior to breaking out into a new rally and that is a signature sign that investors are averaging up (buying new highs) as there is technically no resistance/sellers at higher prices. Instead there are only levels which investors will see as profit taking levels which temporarily pulls price down or stops it from moving any higher.
AAPL – Apple Stock Weekly Trading Chart
Get Our Weekly Trade Ideas & Market Analysis Here: www.TradersVideoPlaybook.com
AAPL Trade Considerations for Option Expiration Week
By JW Jones – www.OptionsTradingSignals.com
“The girls all get prettier at closing time.”
~ Mickey Gilley ~
Option trading is not “just the same as stocks.” It turns on the three primal forces ruling an options trader’s world- time to expiration, price of the underlying, and implied volatility.
As expiration approaches, the forces of time exert their strongest influence of the cycle on a trader’s positions. In today’s blog, written as August expiration is but a few days away, I want to call attention to some of the practical considerations traders would be well advised to incorporate into their trading plan.
Pundits have long cited the aphorism that there are only two sure things in life- death and taxes. Options traders must incorporate a third inevitability- the time component (aka the extrinsic component) of an option premium goes to zero at the closing bell of options expiration. This occurrence is neither negotiable nor avoidable and it occurs with clockwork like precision.
A recent change to the market has introduced an important new element to the long standing monthly expiration cycle. The tremendous popularity of weekly options has rendered every Friday the end of an expiration cycle.
It is critically important to recognize this new phenomenon because it allows tailoring of strategies to fit more precisely the anticipated time frame in which the trader’s hypotheses play out.
Let us consider some of the practical implications of this cyclical pattern. I have discussed before in this blog the fact that erosion of time premium is not linear across the life of an option but accelerates dramatically as expiration approaches. Expiration week is where this acceleration reaches its greatest pace as it heads to zero at Friday’s closing bell.
What is often not immediately understood by the new option trader is the radical change in the risk / reward ratio of a trade produced by this erosion. Consider a simple one legged trade. A trader who was bullish on AAPL during the price weakness in late July could have chosen to sell naked puts to reflect his price view. The graph below shows the trade of selling short the August 545 strike put at mid day on Thursday July 26 with 23 days to expiration:
AAPL Option Trading
The trader would have taken a credit of around $425 for each contract he sold on this trade with a probability of success of 84%. The trade could have been closed last Friday for $16/contract locking in $409 per contract less commission.
While the probability of AAPL trading below the 545 strike as August expiration approaches is close to 0, it is not O. To accept the risk of a Black Swan event occurring in order to capture the remaining 3.8% of the initial credit is not smart trading. The general rule-of-thumb I follow in this type of trade is to close or roll up the position to a higher strike when 80% of the initial credit received has been captured.
Perhaps the most nuanced effect of time to expiration is seen in the behavior of the butterfly trade construction. To review briefly, remember that the classic butterfly is constructed in either calls or puts and consists of both a debit and a credit spread which share the same short strike.
Butterfly positions have the interesting characteristics of responding only minimally if at all to price movement when far out in time from expiration. These same trade structures will react violently to price movement when little time to expiration remains.
An example could be constructed during the July AAPL price rout. Let us assume a trader was sufficiently prescient to predict the price recovery. In order to capture this hypothesized movement, he could have purchased the August 605/-625/645 in a (+1/-2/+1 standard butterfly ratio) call butterfly spread on July 26th. This trade structure is a defined risk position where the maximum risk is the cost of entering the position.
This position would have been very inexpensive because of two factors:
1. Implied volatility was elevated, rendering the butterfly cheap.
2. The center strike where the options were sold short and the point of the theoretical maximum profitability had less than a 5% chance of being in-the-money.
The P&L graph for this position at the time of entry is presented below:
AAPL – Apple Option Trading
Several practical points bear emphasis. First, the maximum potential profit from this low probability trade is in excess of 1800%. This trade construction which cost around $100 per spread at the time could have been closed last Friday for a profit of over $850 per spread.
Second and the point germane to today’s discussion is the behavior of the trade with regard to time. Notice that the broken lines, representing intermediate time points in the trade achieve nowhere near the full profit potential that exists when expiration arrives.
However, not to be missed is the fact that the range of profitability narrows dramatically as expiration is approached. It is for this reason that most experienced butterfly traders remove profitable trades before their wild relationship to price is activated as expiration gets quite close.
I want to be very clear about this demonstrated butterfly trade. This is not a typical trade I would enter because of its low probability of success. I present it as a purely educational exercise to demonstrate the behavior of these frequently encountered trade structures.
I invite you to try my service to follow my trades and understand how the nuanced behavior of options can be used to deliver highly profitable trades.
Happy Trading!
Simple ONE Trade Per Week Trading Strategy?
Join www.OptionsTradingSignals.com today with our 14 Day Trial
Jw Jones
This material should not be considered investment advice. J.W. Jones is not a registered investment advisor. Under no circumstances should any content from this article or the OptionsTradingSignals.com website be used or interpreted as a recommendation to buy or sell any type of security or commodity contract. This material is not a solicitation for a trading approach to financial markets. Any investment decisions must in all cases be made by the reader or by his or her registered investment advisor. This information is for educational purposes only.
Naughty or Nice Part 2: 5 Delightfully Sinful Dividend Stocks
This is Part 2 of a two-part series on “Naughty and Nice” dividend stocks.
In the last article, I gave you five socially-responsible stock picks that you could feel good about owning. Now, we’re going to go a very different direction. In this article, I’m going to give you five delightfully naughty dividend-paying stocks to consider.
I’ll start with a confession: I love sin stocks, and I always have. Because they are politically incorrect, companies in the tobacco, alcohol and defense industries tend to trade at lower valuations and higher dividend yields than the broader market. In effect they are perpetual value stocks, and investors with no qualms about investing in stocks with social stigmas attached to them benefit from this pricing.
For a longer explanation on the virtues of being bad, see “The Price of Sin.”
As I’ve written before, “Not All Sin Stocks are Created Equal,” and not all vice investments are strong dividend payers. But the following five stocks all pay current yields well in excess of the market average.
I’ll start with a sin stock standard, American tobacco giant Altria ($MO). As the poster boy for Big Tobacco, Altria is probably the most hated company in history. If Altria were a movie character, it would be Darth Vader.
It also happens to be the most profitable investment in history, according to Jeremy Siegel’s The Future for Investors. Dr. Siegel’s calculation assumed the reinvestment of dividends, of course. And when you buy shares of Altria, you should accept that you are buying the stock specifically for its dividend because the company’s business is in long-term terminal decline. Cigarette smokers will continue to light up, but their ranks are not growing and cannot be expected to.
At current prices, Altria yields 4.70%. This is a little lower than I would normally like to see for a tobacco stock, but it still makes Altria one of the highest-yielding stocks in the S&P 500.
Some of the best values in the vice sphere are in the “merchant of death” category, and the next stock is one that I covered in “Five Smart Money Dividend Stocks” as a stock owned by Magic Formula guru Joel Greenblatt: defense and aerospace firm Northrop Grumman Corporation ($NOC).
Northrop Grumman makes the sort of toys you might expect to see in a James Bond movie. Its aerospace division sells hardware and systems to government agencies for use in various mission areas, including intelligence, surveillance and reconnaissance, battle management, strike operations, electronic warfare, missile defense; earth observation and space exploration.
Northrop Grumman trades for just 9 times expected 2013 earnings and yields an impressive 3.3% in dividends.
Next on the list is one of Northrop Grumman’s competitors, Raytheon Company ($RTN). Raytheon offers integrated defense systems, including integrated air and missile defense, naval combat systems, and intelligence systems.
Raytheon is priced comparably to Northrop Grumman, trading for just 9 times earnings and yields 3.6%.
The entire defense sector is attractively priced at this time, and Northrop Grumman and Raytheon are two excellent dividend stocks.
Moving down the list of all things naughty, we come to booze. And the single best play in the world of spirits is British-based Diageo PLC ($DEO), the largest and most diversified seller of premium alcoholic beverages in the world.
Diageo’s brands include Johnnie Walker scotch, Smirnoff vodka, Baileys Irish Cream liqueur, Crown Royal Canadian whiskey, Captain Morgan rum, Jose Cuervo tequila and many, many others. The company has been a long-time favorite of the Sizemore Investment Letter for its exposure to emerging markets; Diageo already gets 40% of its revenues from emerging markets, and this number grows every year (see “Diageo: the Ultimate 12 to 18 Year Play”).
Diageo is a current constituent of the Mergent International Dividend Achievers Index, meaning the stock has a long history of raising its dividend, and currently yields a respectable 2.0%.
Another stock in the alcohol sphere I like is Dutch mega-brewer Heineken NV ($HINKY).
The global beer market is dominated by the Big 4—Anheuser Busch InBev ($BUD), Heineken, SABMiller ($SMBRY) and Carlsberg—though beer sales have been stagnant in the company’s core American and European markets. Sales are booming in emerging markets, however, and the Big 4 continue to gobble up small local brands with reckless abandon.
Heineken is unique among Western multinationals in that it is not only a great indirect play on rising incomes in the developing world, but it is a great play on the development of Africa in particular. Heineken already gets roughly a quarter of its revenues from Africa, and this percentage will only rise over time as the African middle class grows and develops.
Heineken pays a decent dividend of 2.1%.
So there we have it. Investors looking to build an income portfolio have their choice of both naughty and nice dividend-paying stocks. I recommend they take their pick of both.
Disclosures: Sizemore Capital is long MO, DEO and HINKY. This article first appeared on InvestorPlace.
Related posts:
Central Bank News Link List – Aug 15, 2012
By Central Bank News
- Some UK central bankers tempted to boost bond buying (Reuters)
- Rate hikes expected in 2013 (Herald Sun) (Australia)
- BOJ’s ballooning bond holdings cause for concern (Asahi Shimbun)
- BoE’s Bean says inflation outlook unchanged – media (Reuters)
- Interest rates unlikely to come down in a hurry (DNIndia)
- RBI proposes stricter banks’ exposure norms to group cos (FirstPost)
- Samoa central bank says devaluation no export panacea (RNZI)
- www.CentralBankNews.info
Good Economic News “Bad for Gold”, Paulson, Soros Add to Gold ETF Positions
London Gold Market Report
from Ben Traynor
BullionVault
Wednesday 15 August 2012, 07:00 EDT
THE WHOLESALE MARKET gold price fell back below $1600 an ounce during Wednesday morning’s London trading, hitting its lowest level for nearly two-weeks, while European stock markets also traded lower, as analysts speculated on the prospects for a third round of quantitative easing (QE3) from the Federal Reserve following the release of positive US economic data.
“The market is disappointed that [gold] was not able to revisit the July high of $1633,” says the latest technical analysis note from bullion bank Scotia Mocatta.
“The closest support comes in at $1584.”
The silver price fell as low as $27.60 per ounce this morning – down 2% for the week so far – while other commodities were broadly flat and US Treasury bond prices fell.
A day earlier, the gold price dropped over 1% in less than an hour Tuesday, as the Dollar rallied following publication of better-than-expected US retail sales data.
“Good news for the economy is bad news for gold,” says Yuichi Ikemizu, Standard Bank’s head of commodity trading, Japan.
“Current data reduce the probability of QE3,” adds Commerzbank head of commodity research Eugen Weinberg, “which means that gold may find it difficult in the near term to make any significant price gains.”
“Any accelerated rally is unlikely to sustain,” agrees Pradeep Unni, senior analyst at commodity brokerage Richcomm Global Services in Dubai.
“Gains beyond $1630 seem to be a near impossibility unless QE is announced from either [Europe] or the US. Gold is supported at 1585-1590.”
Here in the UK, the unemployment rate fell to its lowest level in 12 months over the three months to June, dropping to 8.0%, according to figures published by the Office for National Statistics Wednesday.
“There’s an Olympic Games effect,” says Tom Vosa, head of market economics, Europe at National Australia Bank.
“So the expectation will be that this is short-lived and [the unemployment rate] will pop back up again in maybe August or September.”
The Bank of England’s Monetary Policy Committee meantime voted unanimously to leave interest rates and quantitative easing on hold when they met earlier this month, minutes of the meeting published Wednesday show.
“For most members, the decision this month was relatively straightforward,” the minutes say.
“For some members, the decision was nevertheless more finely balanced, since a good case could be made at this meeting for more asset purchases.”
The Bank increased the size of its asset purchase program, otherwise known as quantitative easing, to £375 billion last month, while its main policy rate has stayed at a record low 0.5% since March 2009.
British bank Standard Chartered has agreed to pay $340 million to settle the case brought against it by the New York State Department of Financial Services, which accused StanChart of being a “rogue institution” over dealings with Iran.
Over in Europe, Greece is planning to ask for an extra two years in which to implement its austerity program, extending it until 2016, according to documents obtained by the Financial Times.
Spain’s banks meantime have become increasingly reliant on funding from the European Central Bank, with total net lending by the Eurosystem to credit institutions growing more than sevenfold over the 12 months to July, FT Alphaville reports.
“This emphasizes the continual struggles that the Spanish banks are having in funding themselves and the huge role that the ECB now has in funding the banks of the periphery,” says a note from Rabobank.
In the US, Paulson & Co., the hedge fund run by John Paulson, increased its holding of shares in the world’s largest gold ETF the SPDR Gold Trust (GLD) during the second quarter, Securities and Exchange Commission filings published Tuesday show. Paulson & Co. raised its stake by 26% to 21.8 million shares.
Soros Fund Management, which sold most of its GLD position last year, doubled its stake during the course of Q2 to take it to 884,400 shares. Hedge fund Eton Park Capital meantime sold its entire GLD position in Q2.
The overall volume of gold bullion held by the GLD fell by 7.1 tonnes to 1279.5 tonnes over course of Q2, while the Dollar gold price dropped 3.8%, the biggest quarterly fall since Q3 2008. The GLD held 1258.1 tonnes as of the end of Tuesday’s trading.
Gold value calculator | Buy gold online at live prices
Editor of Gold News, the analysis and investment research site from world-leading gold ownership service BullionVault, Ben Traynor was formerly editor of the Fleet Street Letter, the UK’s longest-running investment letter. A Cambridge economics graduate, he is a professional writer and editor with a specialist interest in monetary economics.
(c) BullionVault 2011
Please Note: This article is to inform your thinking, not lead it. Only you can decide the best place for your money, and any decision you make will put your money at risk. Information or data included here may have already been overtaken by events – and must be verified elsewhere – should you choose to act on it.
Euro-Zone Data Signals Further Economic Downtrend
Source: ForexYard
The euro fell against the US dollar yesterday, following the release of a worse than expected German economic sentiment figure and GDP data which signaled an economic contraction in the euro-zone. At the same time, better than expected news out of the US resulted in gains for crude oil during the afternoon session. Today, US news is once again expected to generate volatility. Traders will want to note the results of the Core CPI figure, Empire State Manufacturing Index and TIC Long-Term Purchases. Any positive data may lead to additional risk taking in the marketplace, which could result in additional gains for commodities and higher-yielding currencies.
Economic News
USD – US Retail Sales Give USD a Boost vs. JPY
The USD/JPY shot up to its highest level in almost a month yesterday, after positive US retail sales data signaled to investors that the American economic recovery is progressing quicker than originally thought. The pair was up more than 50 pips during European trading to reach as high as 78.92. A slight downward correction later in the day brought the dollar down to the 78.80 level. Against the Swiss franc, the greenback also saw gains of around 50 pips before peaking at 0.9743. By the afternoon session, the USD/CHF was trading around the 0.9730 level.
Turning to today, dollar traders will want to pay attention to a batch of US news scheduled to be released during mid-day trading. The Core CPI and Empire State Manufacturing Index, both set to be released at 12:30 GMT, have the potential to lead to additional gains for the greenback if they come in above their forecasted levels. Additionally, the TIC Long-Term Purchases at 13:00 GMT may signal additional growth in the US economy if it comes in above the expected 47.5B.
EUR – EU GDP Data Weighs on Euro
Economic contraction in the euro-zone, highlighted by yesterday’s Flash GDP figure, turned the euro bearish against several of its main currency rivals, including the US dollar and British pound. After solid gains during Asian trading, the EUR/USD fell from a high of 1.2384 to the 1.2.325 level by the end of the European session. Against the GBP, the common-currency dropped close to 30 pips to trade as low as 0.7856 by the start of the afternoon session.
Today, a bank holiday throughout much of the euro-zone means that risk appetite in the marketplace is likely to be determined by a batch of US news scheduled to be released during mid-day trading. Any signs of growth in the US economy may lead to risk taking among investors which could boost the euro against safe-haven currencies like the Japanese yen. That being said, if the US indicators come in below their forecasted levels, investors may shift their funds to safe-haven assets, which could result in the euro extending yesterday’s losses.
Gold – Gold Tumbles Following US Data
Positive US retail sales data yesterday signaled a boost in the US economic recovery and caused investors to lessen expectations that the Fed will move to initiate a new round of monetary stimulus. As a result, higher yielding assets like gold took significant losses during the mid-day session. The precious metal fell more than $25 an ounce to reach as low as $1590.62. An upward correction later in the day brought prices slightly above the psychologically significant $1600 level.
Today, gold traders will want to once again pay attention to a batch of US news, as it will likely determine risk appetite among investors. Should the news once again come in above the forecasted levels, gold could take additional losses during the afternoon session.
Crude Oil – Positive US News Sends Oil Higher
Oil received a boost during European trading yesterday, after positive US retail sales data signaled to investors that demand in the world’s largest energy consuming country could go up. Crude gained over $1 a barrel over the course of the day, and eventually peaked at $93.89. A slight downward correction brought the commodity to the $93.25 level later in the day.
Today, in addition to any developments in the Middle East, oil traders will want to pay attention to the US Crude Oil Inventories figure, set to be released at 14:30 GMT. The US inventories figure has come in below the forecasted level for the last two weeks, indicating that the American economy is growing. If today’s news once again signals an increase in oil consumption, crude prices could advance further during afternoon trading.
Technical News
EUR/USD
A bullish cross appears to be forming on the weekly chart’s MACD/OsMA, indicating that upward movement could occur in the coming days. That being said, most other technical indicators show this pair range trading, making a definitive trend hard to predict. Taking a wait and see approach may be the best choice at this time.
GBP/USD
Most long term technical indicators place this pair in neutral territory, meaning that a definitive trend is hard to predict at this time. Taking a wait and see approach may be the best option, as a clearer picture is likely to present itself in the near future.
USD/JPY
The Bollinger Bands on the weekly chart are narrowing, signaling that a price shift could occur in the coming days. Additionally, the Williams Percent Range on the weekly chart is currently about to drop into oversold territory, indicating that the shift could be bullish. Going long may be the right approach for this pair.
USD/CHF
Both the Williams Percent Range and the Relative Strength Index on the weekly chart are very close to crossing into overbought territory, signaling that downward movement could occur in the coming days. Traders will want to closely watch these two indicators. If they do signal that the pair is overbought, it may be a good time to open short positions.
The Wild Card
Coffee
A bullish cross on the daily chart’s Slow Stochastic indicates that an upward correction could occur in the near future. Additionally, the Williams Percent Range has crossed into the oversold zone. This may be a good time for forex traders to open long positions, as bullish movement could occur shortly.
Forex Market Analysis provided by ForexYard.
© 2006 by FxYard Ltd
Disclaimer: Trading Foreign Exchange carries a high level of risk and may not be suitable for all investors. There is a possibility that you could sustain a loss of all of your investment and therefore you should not invest money that you cannot afford to lose. You should be aware of all the risks associated with Foreign Exchange trading.