Silver Hits 2-Month High, “Stability Mandate” Means ECB Bond Buying “Would Not Be Same as Bailout”

London Gold Market Report
from Ben Traynor
BullionVault
Tuesday 21 August 2012, 07:15 EDT

SPOT MARKET prices to buy silver rose to their highest level in two months Tuesday, hitting  $29.09 per ounce– 3.5% up on last week’s close – after extending gains from yesterday’s trading.

“This changes [silver’s] posture to bullish,” says the latest technical analysis note from bullion bank Scotia Mocatta.

“There was congestion in the $28.00 area and this should provide some support, while the next target is the $29.90 high from June.”

Dollar gold prices meantime climbed to their highest level so far this month this morning, hitting $1626 per ounce.

By contrast, the gold price in Euros traded lower, falling to €42,069 per kilo (€1308 per ounce), just below last week’s close, as the Euro extended gains against the Dollar to breach $1.24.

Stocks and commodities also traded higher, while US, UK and German government bond prices fell, following fresh reports that Eurozone policymakers are looking at ways of limiting the borrowing costs faced by struggling single currency members.

European Central Bank president Mario Draghi has received the backing of fellow ECB Executive Board member Joerg Asmussen, who tells Germany’s Frankfurter Rundschau that a new program to buy Eurozone government bonds will be “better designed” than previous ECB interventions.

“A currency can only be stable if its future existence is not in doubt,” says Asmussen.

“We operate within our mandate, which is primarily aimed at guaranteeing price stability in the medium term for the entire Euro area.”

Britain’s Telegraph newspaper meantime says it can “confirm reports” from Germany’s Der Spiegel that ECB staff are studying plans to put a limit on Italian and Spanish sovereign bond yields.

“[Asmussen’s] choice of wording is crucial,” says the Telegraph’s Ambrose Evans-Pritchard.

“If it can be shown that the ECB is acting to avert [Eurozone] break-up – known as “convertibility risk” – bond purchases would no longer be deemed a bail-out for Italy and Spain.”

Spain successfully auctioned €4.5 billion of 12- and 18-month debt Tuesday, at lower borrowing costs than those faced at similar auctions last month.

Elsewhere in Europe, Jean-Claude Juncker, who heads the Eurogroup of single currency finance ministers, is due to visit Athens tomorrow to discuss Greece’s request for an extension on its austerity program.

“The market focus is on the meetings that are happening in and around Greece and the key question is whether or not they allow an extension to the fiscal adjustment program,” says Geoff Kendrick, head of European currency strategy at Nomura in London.

The adjustment required from struggling European nations “is at best only half complete”, according to a report published by Moody’s this week.

China’s central bank meantime injected 220 billion Yuan into the financial system Tuesday, although borrowing costs still ticked higher, Bloomberg and Reuters report.

The People’s Bank of China used so-called reverse repos, exchanging its cash for borrowers’ securities for an agreed period, in an effort to boost current levels of market liquidity. The use of reverse repos is an alternative to cutting interest rates or the reserve requirement ratio, the proportion of their assets institutions are required to hold as reserves.

“The market demand is quite large,” one Shanghai trader told Reuters this morning.

“Monday’s demand was really heavy. The central bank’s action today basically just satisfied current demand, but didn’t in any way exceed it in a way that would bring rates down.”

“We still expect a reserve requirement cut,” adds Dariusz Kowalczyk, Hong Kong-based strategist at Credit Agricole.

Chinese platinum imports doubled last in July compared to a year earlier, while imports of silver bullion fell by 4%, Reuters reports, citing customs data.

Ben Traynor
BullionVault

Gold value calculator   |   Buy gold online at live prices

Editor of Gold News, the analysis and investment research site from world-leading gold ownership service BullionVault, Ben Traynor was formerly editor of the Fleet Street Letter, the UK’s longest-running investment letter. A Cambridge economics graduate, he is a professional writer and editor with a specialist interest in monetary economics.

(c) BullionVault 2011

Please Note: This article is to inform your thinking, not lead it. Only you can decide the best place for your money, and any decision you make will put your money at risk. Information or data included here may have already been overtaken by events – and must be verified elsewhere – should you choose to act on it.


Central Bank News Link List – Aug 21, 2012

By Central Bank News

    Here’s today’s Central Bank News link list, click through if you missed the previous link list. The list comprises news about central banks that is not covered by Central Bank News. The list is updated during the day with the latest developments so readers don’t miss any important news

EUR/USD: EU’s Economic Rewiring Spurs the Euro

Article by AlgosysFx Forex Trading Solutions

As the Euro area peripheral nations are at best halfway through correcting the economic imbalances that helped cause the debt crisis, the European currency advanced by 8 pips versus its American complement. The pressing on with structural reforms and adjustments, both in the periphery and the core, have already taken places to a significant degree.

The Euro is likely to persist to appreciate seeing that policymakers in the struggling nations of Europe’s periphery are trying to rewire their economies to generate the growth they need to pay their debts. The European Union and the International Monetary Fund have pledged at least 393 Billion Euros in aid to Greece, Ireland, Portugal and Spain to help them pay their bills while they implement reforms. Moody’s noted progress in some countries’ trade balances and labor competitiveness.

Meanwhile, although US consumer sentiment improved in early August to the highest in three months as sales at retailers and low mortgage rates spurred Americans to boost their buying plans, the disappointing growth and hiring in the spring deters a continued concern about the outlook of the US economy. With stubbornly high unemployment and a weaker global economic picture, some analysts have raised their expectations that the Federal Reserve could launch a new round of bond buying to help prop up the economy.

Hence, the competitiveness gains in the Euro area periphery that seems to have come about as a result of improvements in productivity versus the concerns about jobs and growth in the US accordingly sees that a buy position be apt for the EUR/USD pair.

For more news, analysis, technical charts and candlestick analysis, visit AlgosysFx


Forex Daily review- 21.08.2012

Forex Daily review brought to you by REAL FOREX | www.Real-forex.com

Tracking the EUR/USD pair
Date: 20.08.2012   Time: 17:41 Rate: 1.2339
Daily chart
Last Review
The price came back to the 1.2290 balance level, while this is used for a long period as a basis for its movements up and down. Descending of the price and closure of a candle under the Bollinger’s moving average will probably lead the price to a Bearish move with first target on the lower lip of the Bollinger band. On the other hand, breaching of the 1.2436 price level will probably lead the price towards the next resistance on the 1.2692 price level.
 
Current review for today
The price continues its movement sideways while being consistent about holding close to the 1.2290 balance point. Descending of the price and closure of the candle under the Bollinger’s moving average will probably lead the price to a bearish move while its first target is the lower Bollinger band. On the other hand, breaching of the 1.2436 price level will probably continue towards the next resistance on the 1.2692 price level.
 
You can see the chart below:
eur/usd 
 
4 Hour chart
Date: 20.08.2012   Time: 17:51 Rate: 1.2340
Last Review
On the last trading day the price has performed a descending move and at the moment it is holding on the ascending trend line which is connecting the lows (purple line connecting between points 2 and 4). Breaking of the trend line and the 1.2250 price level will probably lead the price to the last low on the 1.2134 price level at first stage. On the other hand, stoppage of the price on the mentioned trend line and breaching the 1.2367 price level in a proven way will probably lead the price for another checking of the 1.2444 price level.
 
Current review for today
The price is ranging between the 1.2250 and the 1.2387 price levels for several days. Breaching the upper ranging level will probably lead the price to the 1.2444 Fibonacci correction level at first stage. On the other hand, breaking of the 1.2250 price level will probably lead the price towards the last low on the 1.2134 price level.
 
You can see the chart below:
eur/usd 
 
GBP/USD
Date: 20.08.2012   Time: 19:59  Rate: 1.5705
4 Hour chart
Last Review
It is possible to see how the Bollinger bands are closing on the price and preventing wide movement to one of the directions. Breaching of the 1.5720 price level will probably lead the price towards the last peak on the 1.5777 price level. On the other hand, breaking of the 1.5658 price level which is use as a support level, will probably lead the price to the next support on the 1.5577 price level.
 
Current review for today
The price has breached the 1.5720 price level but stopped on the trend line connecting the peaks (upper black broken line). It is possible to see that a shrinking ascending price channel was created (black broken lines) and as soon as the price will breach the lower lip of the tunnel it should create a correction move in size of between a third and two thirds of the uptrend started on the 1.5490 price level. On the other hand, a continuation of the uptrend is supposed to lead the price at first stage towards the last peak on the 1.5777 price level.
 
You can see the chart below:
GBP/USD 
 
AUD/USD
Date: 20.08.2012   Time: 18:17 Rate: 1.0453
4 Hour chart
Last Review
The price has performed a correction in size of between a third and two thirds of the downtrend which started on the 1.0540 and still located under the Bollinger’s moving average. Breaking of the 1.0500 price level in a proven way will probably lead the price towards its first target on the 1.0444 price level. On the other hand, if the price will receive its support on the 1.0500 price level and its establishment above the Bollinger’s moving average, will probably lead the price towards the top Bollinger band.
 
Current review for today
The price indeed reached the 1.0444 target level and even broke it, stopped on the 1.0411 price level and corrected the last downtrend which started around the 1.0530 price level. It is possible to see that at the moment a descending price structure is taking place and in addition the price is located under the Bollinger’s moving average. Breaking of the 1.0411 price level followed by the breaking of the lower lip of the ascending price channel (black broken lines) will indicate that it is possible that the price will perform a correction of the uptrend locked in this tunnel (blue broken line) in size of between a third and two thirds, meaning between the 1.0377 and the 1.232 price levels. On the other hand, breaching of the upper lip of the descending tunnel (red broken line) will probably lead the price towards the upper lip of the ascending price channel.
 
You can see the chart below:
AUD/USD 
 
USD/CHF
Date: 20.08.2012   Time: 18:22 Rate: 0.9728
4 Hour chart
Last Review
The price is standing in front of the 0.9750 resistance level while its breaking will probably lead the price to check the 0.9810 price level again. On the other hand, stoppage of the price at the current area and breaking of the 0.9700 price level will indicate that the price will go down to check the 0.9650 price level, which is a 61.8% Fibonacci correction level of the uptrend marked in blue broken line.
 
Current review for today
The price is clearly ranging between the 0.9700 and the 0.9810 price levels. Breaching the 0.9810 price level will probably lead the price to the closest resistance on the 0.9866 price level. On the other hand, breaking of the 0.9700 support level will probably lead the price to the 0.9650 price level which is a 61.8% Fibonacci correction level of the uptrend marked in blue broken line.
 
You can see the chart below:
USD/CHF 
 
USD/JPY
Date: 20.08.2012   Time: 18:30 Rate: 79.38
4 Hour chart
Last Review
The price went back and breached the 78.93 price level, if it will succeed to base above this level, it will make its way at first stage to the 79.20 resistance level, and the breaching of this level will lead the price to the 79.80 price level. On the other hand, only a descending of the price under the 78.46 price level will bring the price back to the ranging area between the 77.94 and the 78.70 price levels.
 
Current review for today
The price indeed based above the 78.93 price level, reached the 79.20 target and came close to the 79.80 price level. Breaching of this level will probably lead the price towards the last peak on the 80.60 price level. On the other hand, stoppage of the price at the current area and its descending under the 79.20 price level will probably lead the price to check the lower Bollinger band.
 
You can see the chart below:
USD/JPY 

The Bloody Oaths and Balance Sheet Imbalances of Australian Banks

By MoneyMorning.com.au

You’ll soon think back longingly to the times when Australian banks were stupidly profitable:

‘Remember the good old days when The Age reported, ‘the combined yearly profits of the big four banks now total more than $1000 for every person in Australia.’ Back then, people thought profits were bad. Ha, little did they know…’

The Australian banks might be profitable right now. But for good reason. It’s their last gasp. Australia’s banks are about to get hit with a double whammy. Banking is about managing the asset side of the balance sheet, and the liabilities side. It’s a question of what to invest in, and how to fund those investments. Both sides are in trouble.

Pretty soon, you’ll be contributing to more than the bank’s profits as a customer. You’ll be on the hook for their government bailouts and their cosy monetary policy relationship with the central bank. You’ll be paying tax, the inflation tax and the interest on Australia’s ballooning sovereign debt. Then you’ll wish the banks were profitable again.

On the asset side, Australian banks are in trouble because the loans they made and the collateral they took are dodgy, to the extent that the banks are now indirectly raiding retirement funds so borrowers can avoid foreclosure. Last year this added up to $100 million taken from retirement savings and shovelled into bank profits.

On the liabilities side, Australian banks are about to go from being awash in funds to needing a central bank rescue. The kind we’ve seen all around the world.

Foreign Lenders About to Desert the Australian Banks

First, to the liabilities – how the banks get the cash they lend. As the Australian economy continues to slow down, Reserve Bank interest rates will fall. That will end the interest rate arbitrage that’s been going on.

Foreign investors, faced with near 0% interest returns in Europe, the US and UK, have been ‘investing’ in Australia to capitalise on our higher rates. That’s provided the banks with plenty of funding. And pushed up the Australian dollar. But if all that foreign cash goes home, it will leave the banks high and dry.

Ben Davies of Hinde Capital told listeners of King World News how this plays out:

Australia is running out of luck. This is a country that’s got an oversized banking system very reliant on external financing. They’re going to have the bursting of a housing bubble. Really, this has been masked to some extent by the great resource boom that’s been coming out of China… So I think what’s going to happen is the RBA is going to continue to reduce rates. At some point there is potentially going to be a balance of payments crisis… I think foreigners could actually pull funding to the Australian banks. I think that the RBA will do what the European Central Bank did, which is… an LTRO type vehicle – provide liquidity – because domestic savers are not in a position to fund the banks in Australia. And obviously they can’t afford for the banks to go down.

Davies also reckons the Australian dollar’s recent strength comes from foreign central bank buying. As an aside, the Australian dollar will collapse if Davies is right and foreign investors pull out of Australian banks.

All the cash will go home, flooding the world with Aussie dollars. That is usually a good thing for exporters because their goods appear cheaper to foreign buyers. But it’s tough for exporters to take advantage of that if the banks have less cash to lend out.

The Australian banks know that foreign capital is about to desert them. They’ve been issuing hybrid securities left right and centre to shore up their funding. And people have been buying the new securities, which have the worst characteristic of debt and the worst characteristics of equity baked into them.

But this source of funding won’t be enough. There aren’t enough savings in Australia to support our huge financial services sector. As soon as debt begins to contract on an economy wide basis, credit bubble businesses like banks begin to struggle because there is less cash to loan out.

The Festering Problem in Australian Banks

In the meantime, over on the asset side of the balance sheet, you’ve got the festering housing bubble. And Australia’s secret sub-prime lenders, who have had some success suing the banks. When loans start going bad and houses cannot be sold for more than the loan taken out to buy them, the banks’ assets will be in trouble.

They’ll be making less money and they’ll be left owning assets that are falling in price.

What’s really worrying, even if you’re not planning on being a borrower or bank shareholder, is that most of the economy is reliant on Australian bank funding. Before banks funded just about all business, businesses funded the purchase of their inventory with equity – cash they brought into the business. Their profit would be the difference between the cost of what they bought and what they sold it for.

But the Australian banks allowed this process to happen on steroids. Instead of only buying the inventory you can afford with investors’ cash, you can now buy vastly more of it using borrowed cash. Once it’s sold, you repay the debt and earn vastly more in profit because of the far larger amount of bought and sold inventory.

Of course, everyone else figures this out. They did more than two hundred years ago. So profit margins were simply squeezed back to where they were before debt financing became the norm. But the economy can still buy and sell the vastly increased amount of goods funded by debt. That makes everyone better off.

Especially the banks. But it also makes things very fragile. If the banks struggle and stop lending, inventory can’t be bought. Shelves go empty.

The hidden problem is that bankers don’t just lend out money they borrow from someone else. They also lend out money they create out of thin air. Without real savings funding borrowing, banking becomes a Ponzi scheme. At some point, the game is up because the banks lent more than they took in. That’s why financial crises happen so easily.

You Won’t Believe This

Don’t worry too much about all this. The bankers have a solution. It’s called ‘The Banking and Finance Oath Limited (BFO)’. You cannot make this stuff up (our emphasis added):

The Banking and Finance Oath Limited (BFO), incorporated last month, will oversee and enforce a voluntary oath of conduct to be sworn by professionals employed across the Australian financial services industry.

This is the oath:

Trust is the foundation of my profession
I will serve all interests in good faith
I will compete with honour
I will pursue my ends with ethical restraint
I will create a sustainable future
I will help create a more just society
I will speak out against wrongdoing and support others who do the same
I will accept responsibility for my actions
My word is my bond.”

Unlike other professions, such as medicine and law, where practitioners are bound by professional oaths for the duration of their careers, the banking and finance oath may endure for only 12 months. If members don’t renew their annual subscription to the company their oath lapses as a binding commitment.

Under the BFO’s constitution, members are also free at any time to terminate their obligations if they believe they are no longer able to adhere to each of the oath’s nine tenets.

Can we read from that that if any banker doesn’t renew membership they’re admitting that they won’t serve all interest in good faith, they won’t compete with honour, they won’t pursue their ends with ethical restraint, they aren’t interested in a sustainable future or a more just society, and they won’t speak out against wrongdoing or accept responsibility for their actions?

It seems their word is their bond, but only for 12 months at a time. And even then, ‘members are also free at any time to terminate their obligations’.

Best of all, the people running this thing are the bankers who it’s supposed to be protecting you from. And the very same ones who will be held responsible when their company is doing something wrong. What do you think they’d do if any whistleblower was dumb enough to come to them?

Until next week,

Your mortgage-free editor,

Nick Hubble

Related Articles

Market Pullback Exposes Five Stocks to Buy

A Housing Bubble… Upon Bubble… Upon Bubble

There is No Safe Haven – But You Should Still Own Gold


The Bloody Oaths and Balance Sheet Imbalances of Australian Banks

Advertising Growth on Demand

By MoneyMorning.com.au

You only have to look at the stick given to the Olympics coverage by Channel 9 in Australia and NBC in the US, to see that network television channels are going through their final days of life as relevant content providers.

The funny thing is, they still can’t see the writing on the wall.

NBC received some of its best ever viewing figures for a non-US Olympics. And according to The Age (during the Olympics), ‘Despite criticism of Nine’s coverage it has been averaging around 1.7 to 1.8 million viewers every night, which Mediaweek editor James Manning said was “probably spot on with what they were hoping for”.’

Both Channel 9 and NBC are making a classic mistake. They see an increase or plateauing of viewership and assume they’re on the right track. What they can’t see are the millions of viewers that didn’t watch their service.

Such as the millions of Americans that used social networking and online applications to watch the Olympics live, rather than being forced to watch delayed coverage on network TV.

People Want Choice

It also explains why Foxtel’s eight-channel coverage knocked Channel 9 for six. As The Age reported, ‘Foxtel attracted its biggest audience ever for an event, with an audience peak of 1.2 million on Sunday night and averaging over 900,000 since then across its eight channels.’

Put simply, about 20% of the Aussie households that have a TV watched Channel 9′s coverage, whereas about 36% of the Aussie households that have cable or satellite TV watched Foxtel’s coverage.

It’s proof that people want choice. They want to decide what they watch and when they watch it…not when a stiff-necked media crony tells them they can watch it. Viewers want a choice of events, not the one event the TV exec chooses.

And if the TV execs want more proof, they should check out the latest advertising growth rates forecast for 2012-2016. They’re not good viewing for network TV execs…or for magazine and newspaper men either:

Data Source: PricewaterhouseCoopers

Free-to-air TV advertising is forecast to grow slower than even outdoor and cinema advertising at just 1.8% per year. Compare that to the 12.1% forecast growth rate for Internet advertising.

The forecasts are in a report by PricewaterhouseCoopers (PwC), Australian Entertainment and Media Outlook 2012-2016.

There are two big reasons for the shift. First, the Internet is still a growing medium. That’s thanks to the advent of social networking websites, but future growth will also come from Internet TV (IPTV).

The Shift Away from Traditional Advertising

The second reason is that online advertising can be tracked, monitored and reported on much more effectively than TV, radio or newspaper advertising.

Advertisers can set up and adjust an online advertising campaign in seconds — Google and Facebook are two of the more popular online advertising markets. This means a company knows exactly how many people have seen their ad, how many of those clicked on the ad, and how many of those actually bought something.

A marketing manager can tell within hours whether a campaign has worked or not. That’s not the same for TV, radio or newspaper advertising. The outcome is much less clear. The ratings and circulation numbers only tell you how many people were tuned in to the TV or radio, and how many bought the paper.

But it doesn’t tell you who actually saw or read the ad. And you can’t be certain whether someone bought the product because of the TV ad at 6:07pm, the radio ad at 8:14pm, or the newspaper ad from the day before (or which newspaper ad in which paper).

In other words, the old style of advertising is immeasurable, whereas Internet advertising is measured down to the individual buyer. And if PwC is right, the new advertising medium is about to take another leap.

As the Australian Financial Review pointed out, ‘PwC predicts mobile advertising spending will achieve compound annual growth rate of 46 per cent over the next four years, to reach $90 million by 2016.’

That’s still only a fraction of the free-to-air advertising market, which stands at $3.3 billion per year. But it’s fast catching up with magazine advertising, which this year fell 8.5% to $571 million.

Given a choice between a high-risk but growing sector and a high-risk but declining sector, we know which we’d rather bet on…Internet all the way.

Kris Sayce
Editor, Money Morning

From the Archives…

A Housing Bubble…Upon Bubble…Upon Bubble
17-08-2012 – Nick Hubble

How Government Extortion is Happening Right Before Our Eyes
16-08-2012 – Kris Sayce

Are Gold Stocks About to Turn?
15-08-2012 – Dr. Alex Cowie

The Amazing Ethanol Scam in the USA
14-08-2012- Jeffrey Tucker

Why I’ve Done a U-Turn on Solar Energy
13-08-2012 – Kris Sayce


Advertising Growth on Demand

Fifty Shades of Government

By MoneyMorning.com.au

On a flight the other day, I noticed that a third of the passengers were reading a certain best-selling book. It got me thinking.

Every politically active group wants something from government, and government is happy to oblige. It’s even more obvious in the election season.

Another way to put it: Government has lots to give in the way of laws, loot, privileges, protections and punishments. Every pressure group and political party has an idea about how its power over us needs to be used.

Does it make any difference who gets the loot, really? Not really, not to you and me. Whether you are taxed to make bike paths in Palo Alto or to fund reconnaissance missions in Kabul, you are still denied use of your money so that politicians and bureaucrats can realize their dreams.

Whether the regulations say that you can’t work for less than $10 per hour or that you can’t buy raw milk at any price, your freedom to make contracts is still being compromised.

We can and will argue interminably about how government ought to be used. Should government prevent gay people from contracting unions or stop private companies from discriminating against people who chose gay unions?

Either way, the state is being brought in to tell people what they can and can’t do. In this sense, the left and the right have more in common than either side cares to admit: Both have a plan for how the state can better manage the social order.

Should tobacco be banned or bailed out? Should banks be made too big to fail or badgered with regulatory restrictions so they can’t do real business? Should corporations be protected and subsidized, or should they be taxed within an inch of their lives? Should fatty foods be mandated as part of a national diet or kept off the menu as a health hazard?

The Only Winner is Always Government

These are the great debates of our time. But these are actually not fundamental debates at all. Either way, the only real winner here is government, its agents, its public spokesmen, its powers and its place in our lives and the culture. This is what remains unquestioned.

Should seniors be able to rob young people of their earnings in order to enjoy a luxurious retirement, or should seniors be especially taxed and punished for using more than their fair share of society’s health care resources? Whichever way that debate ends up, liberty itself suffers, and the property rights of everybody are less secure.

Should religious people be able to control what we watch, read and smoke, or should secular people be able to impose laws that keep religious people from having too much influence over our culture? Either way, government is being granted more control over the social order than it should have.

This is the great tragedy of living under leviathan. People have different ideas about how it ought to conduct its affairs. Who should be rewarded? Who should be punished? Who gets the privileges? Who must bear the cost? It becomes a war of pressure groups, everyone seeking to live at the expense of everyone else.

What is this thing we call government? It consists of the gang with an institutional structure that makes the rules, enforces the rules, and lives by rules that are different from those it imposes on the rest of the population.

We can’t steal, but government can. We can’t kill, but government can. We can’t counterfeit, kidnap, and engage in fraud, but government can. This thing called government, obviously, has a strong interest in maintaining its power, prestige, and funding.

This is true no matter what the structure of the government happens to be. Oligarchy, absolute monarchy, constitutional monarchy, presidential republic, parliamentary republic, democracy – all of them have one thing in common: They create a special caste of citizens that live at the expense of everyone else.

In a democracy especially, government enlists us all in its cause. So long as people are arguing about how to use the government, and not whether it should be used to achieve social and economic goals at all, the government comes out the winner.

All the pressure groups are really just rewarding the political class, transferring power and money from us to them. Precisely what the excuse is – and it changes all the time, sometimes subtly and sometimes dramatically – doesn’t matter to government.

A Different Government – The Time For Change is Now

Government is a chameleon, pleased to wear any cultural or ideological cloak to blend in with its social and cultural surroundings. In a wrangling, struggling, grasping, dog-eat-dog democracy like ours, there are 50 shades of government, each suitable for a particular time and place, each adapted to purposes of the moment, all with the interest of firming up control by the ruling class.

This is what the “political spectrum” is all about. Government dominates and we submit. It puts us in bondage and we obey its discipline. There’s also got to be a good excuse or else we would never put up with this. We have to believe that the government is, in some way, at some level, doing something that pleases us. Maybe even the government is us!

People say that in the “age of faith” of the Middle Ages, religious differences led to wars. Historians who have looked carefully have noticed something different. Governments that want wars are happy to use religion as the excuse.

And so it is today. In the “age of science,” we get scientific social planning in which experts are supposed tell the people with their hands on the controls how to use them.

But whether the excuse is religion or science, security or the environment, nationalism or internationalism, it doesn’t matter to the rest of us. The rights and liberties of the people paying the bill are forever being sacrificed to someone else’s political agenda.

We drag ourselves to the voting booth and look at the names and try to remember what these various people promise to do for us and to us if we ratify their right to rule. Having done so, we are told that we’ve made our choice and now we must live with it.

But maybe it is not really a choice at all. Maybe it is time to let go of our dependency and reject the entire master-slave relationship that is the whole basis of the system itself. Fifty Shades of Government has been the best-seller for hundreds of years. It’s time that the governed write an entirely new book.

Jeffrey Tucker
Contributing Writer, Money Morning

Publisher’s Note: This is an edited version of an article that first appeared in Laissez Faire Today

From the Archives…

A Housing Bubble…Upon Bubble…Upon Bubble
17-08-2012 – Nick Hubble

How Government Extortion is Happening Right Before Our Eyes
16-08-2012 – Kris Sayce

Are Gold Stocks About to Turn?
15-08-2012 – Dr. Alex Cowie

The Amazing Ethanol Scam in the USA
14-08-2012- Jeffrey Tucker

Why I’ve Done a U-Turn on Solar Energy
13-08-2012 – Kris Sayce


Fifty Shades of Government

Mexico: Investing in the Forgotten Emerging Market

By The Sizemore Letter

Mexico gets no love. It’s not quite a developed market, but being next door to the United States it’s not quite remote or exotic enough to be an alluring emerging market either. And starting with the letter “M,” it doesn’t fit into any popular acronyms.

Lest you think I am joking, the four countries that comprise the “BRIC”—Brazil, Russia, India and China—have nothing in common other than the fact that their first letters make a word that sounds good in marketing literature. Mexico, Turkey, and Indonesia would all have been better choices than Russia—all three are promising emerging markets whereas Russia is a decrepit petrostate on the decline—but it’s hard to form an acronym with their first letters. Go ahead. Try. I’m waiting.

Investors who overlook Mexico do so to their own detriment. In addition to being an attractive market in its own right—and the second-largest in Latin America after Brazil—Mexico is also a large investor in other Latin American markets, and some of its multinational companies have a truly global scope.

The Mexican stock market has also been a star performer in 2012. At time of writing, the Mexican IPC Stock Index was up over 10 percent, making it one of the better performing markets in the Americas.

Mexico’s economy is tied closely to that of the United States—“El Coloso del Norte” accounts for more than 70% of Mexico’s substantial exports—so a relapse into recession by the United States would severely crimp growth south of the border. I am not expecting a U.S. recession, however, and instead expect the U.S. economy to muddle through with positive, if modest, growth.

The drug-related violence in northern Mexico is also disconcerting—and bad for cross-border commerce and tourism—though I don’t see it being a deal breaker for investors in Mexican stocks. If I were the CEO of a U.S. manufacturing firm, I might think twice about setting up a new factory in Mexico. But as a portfolio manager looking for access to rising Mexican consumer incomes, the risks are tolerable.

Investors wanting exposure to Mexico can buy shares of the popular iShares MSCI Mexico ETF ($EWW). But today, I’m going to recommend three solid Mexican multinationals I expect will outperform the broader index.

I’ll start with America Movil ($AMX), the international cellular service juggernaut controlled by billionaire Carlos Slim. America Movil is the chief competitor in Latin America of long-time Sizemore Investment Letter recommendation Telefonica ($TEF). America Movil is dominant in the lucrative Mexican market, and it is a force to be reckoned with in most of South America.
Mobile phones are ubiquitous in Latin America, but the market is still far from saturated. And the upgrade cycle to higher-margin smart phones is just beginning.  America Movil is a fine way to invest in the emerging market consumer.

The next pick is Mexican media giant Grupo Televisa ($TV), one of the largest in the Spanish-speaking world.  Televisa is best known in the United States for the soccer games, colorful game shows and (truly awful) telenovela soap operas broadcast by its Univision segment, but the company’s operations include paid television and print media as well.

Like America Movil, Televisa is a play on rising incomes in Latin America and rising incomes and influence among the U.S. Spanish-speaking population. As Latin consumers climb the income scale, the returns to advertising to them rise as well, which benefits media companies.

Mexican and South American consumers are also embracing paid TV in higher numbers, which was the rationale for my recommendation of DirecTV ($DTV) in the Sizemore Investment Letter. This is a long-term trend that should have multiple years to fully play out.

The last pick will be a little more controversial: Mexican cement giant Cemex ($CX). Cemex is one of the largest cement and construction materials companies in the world. Not surprisingly, Cemex got absolutely hammered during the Great Recession, as new building projects ground to a halt in many countries.

Cemex also fell victim to crisis of its own doing. The company borrowed heavily to finance its international expansion, and when the Mexican peso plunged in value during the 2008 meltdown the company fell into financial distress due in part to its use of derivatives.

Cemex’s share price lost more than 90% of its value in the aftermath, but since then the company has stabilized. The share price has more than doubled in the past year, and more gains are likely if conditions in the global construction industry at least remain stable.

Disclosures: Sizemore Capital is long DTV and TEF.

SUBSCRIBE today to get Sizemore Insights via e-mail.

Related posts:

Copper Prices Signaling a Top in the S&P500

By Traders Video Playbook

The past 5 – 6 weeks have seen equity prices move considerably higher amid growing concerns regarding the European debt crisis, the instability of the Middle East, and ultimately the potential for a major economic slowdown in the United States.

U.S. equity indexes have continued to climb the proverbial “Wall of Worry” since the first week of June and have put on an incredible run. This past Friday saw the S&P 500 Index (SPX) post the highest weekly close of 2012. The perma-bears have been calling for a top and continue to run scared as light volume and volatility have given the bulls an edge during August.

The next key overhead resistance level for the S&P 500 Index to hurdle is the 1,440 resistance zone lingering slightly overhead. I try to refrain from calling tops or bottoms as I feel its a fool’s game that ultimately humbles most market prognosticators. If calling tops and bottoms was easy, investors and traders alike would be able to produce monster gains all the time with uncanny precision.

Instead of trying to predict where the S&P 500 Index will find resistance or create an intermediate to longer-term top, I will simply posit some technical and macro-economic data that indicates we are likely closing in on a major top.

As stated above, the recent rally we have seen has taken place on relatively light volume and plunging volatility as measured by the Volatility Index (VIX).


Volatility Index (VIX) Weekly Chart

Volatility Index (VIX) Weekly Chart

Volatility Index (VIX) Weekly Chart


As can be seen above, Friday’s weekly close for the VIX was the lowest in 2012 and ultimately one of the lowest closing price levels in several years. While the VIX is trading at a major intermediate low, there remains a lower support level going back to late 2006 and the early part of 2007 around the 10 price level.

The perma-bulls would argue that we could see those 2006 – 2007 lows tested, but based on September monthly VIX options the option market seemingly is arguing that we are approaching an intermediate low in the Volatility Index. The chart below illustrates the September VIX option chain based on Friday’s closing prices.


Volatility Index (VIX) September Monthly Option Chain

Volatility Index (VIX) September Monthly Option Chain

Volatility Index (VIX) September Monthly Option Chain


Price action is never wrong, but many times a great deal of information can be acquired by simply reviewing option prices. As can be seen above, the VIX closed on Friday at 13.45, a new 2012 low. However, when we consider the prices in the VIX September option chain shown above I would point out that the VIX September 13 Puts are 0 bid.

What this essentially means is that the VIX options market is saying that the Volatility Index is unlikely to move below 13 in September. For readers unfamiliar with options, selling a naked put or using a put credit spread are two trading structures that are bullish regarding the underlying asset which in this case is the VIX.

The VIX September 13 puts are offered at 0.05 on the ask, but are at 0 on the bid. This means that the VIX market makers are not expecting to see the VIX move below 13. Clearly this is not a guarantee as there is never a sure thing in financial markets. However, this pricing situation for the September 13 VIX Puts is favorable for the equity bears in September.

Another key element that veteran option traders understand is that going into a quarterly expiration, volatility typically recedes considerably. In light of that knowledge, experienced option traders would assume that the S&P 500 Volatility Index would have to rise in the intermediate term in order to allow for this volatility contraction synonymous with quarterly expiration.

In layman’s terms, the VIX needs to move higher in the next 3 weeks based on the fact that the September VIX 13 Puts are 0 bid. This is one of several clues that we could be nearing a major top in the S&P 500 Index in the very near future.

When we look at a weekly chart of the S&P 500 Index (SPX) it is obvious that we have a major longer term breakout which occurred this past week. However, there remains additional resistance overhead in the 1,440 – 1,450 price range.


S&P 500 Index (SPX) Weekly Chart

S&P 500 Index (SPX) Weekly Chart

S&P 500 Index (SPX) Weekly Chart


While 1,440 might be a major area where a significant top could form, a rally above this level cannot be ruled out entirely. However, the chart above gives traders and investors a context for where possible tops could form.

A reversal could play out almost immediately at the current levels or we could move considerably higher before finding major resistance that holds. For now, we do not have enough evidence based on the S&P 500 Index price chart to proclaim that a top has formed or will form in the near future.

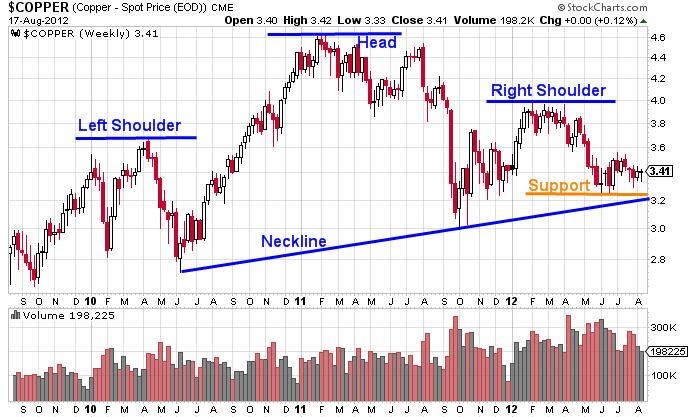
Another underlying asset that I monitor closely is copper futures. Generally speaking, if copper futures are rallying economic conditions tend to be strong. The opposite can be said when copper futures are under selling pressure. Recently copper futures prices have been trading in a relatively tight trading range, but the longer-term weekly chart shown below demonstrates that should prices start to selloff, a major selloff could transpire.


Copper Futures Weekly Chart

Copper Futures Weekly Chart

Copper Futures Weekly Chart

As shown above, there is a monstrously large head and shoulders pattern (bearish) that goes back to early 2010 that has formed on the weekly chart. Should the neckline of this pattern get taken out on a weekly close the selling pressure that could transpire could be devastating regarding the price of copper.

However, a major selloff in copper would also indicate that economic conditions were weakening globally. If copper triggers this bearish pattern, it would likely not be long before other risk assets followed suit.

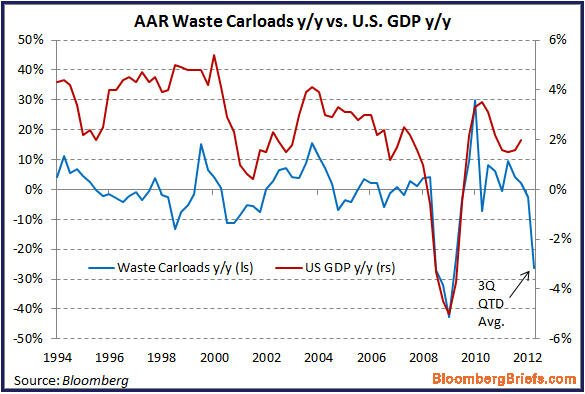
In addition to the possibility that major selling pressure could await copper should that pattern trigger, another macroeconomic data point would argue that economic conditions are already starting to contract. The chart shown below, courtesy of Bloomberg, illustrates the amount of waste hauled by railroad cars and the implicit correlation to U.S. gross domestic product (GDP).


Waste Railcar Loads Versus GDP Chart

Waste Railcar Loads Versus GDP Chart

Waste Railcar Loads Versus GDP Chart


Recently Zerohedge.com posited an article that featured this chart and a link to that article is found HERE. The article and the accompanying chart demonstrate that as more products are produced, additional waste can be expected. As shown above, the amount of waste being produced and hauled by railcar has fallen off a cliff and should longer-term correlations remain intact a contraction in U.S. GDP is likely not far away.

There are a multitude of other topping triggers that I follow that are all screaming that a major intermediate and possibly even a longer-term top is nearby. However, at the moment the price action in the S&P 500 Index (SPX) is arguing otherwise.

Picking tops and bottoms in advance is extremely difficult and generally foolhardy, however when multiple triggers are going off regarding a possible type I pay close attention to price action. While I will not go as far as to say where specifically a top in the S&P 500 Index will form, I believe that a top is forthcoming and could even occur in the next 2 – 3 weeks.

Price is never wrong, and eventually I suspect that price will tell us what we wish to know. For now, I am going into the next few weeks with caution regarding the upside in risk assets. However, it is important to point out that I am not looking to get short risk assets either.

My research indicates that a major inflection point is coming and it could coincide with the Federal Reserve’s Jackson Hole summit. It could coincide with an event that we are unaware of as well. At the moment risk in either direction seems high and caution regardless of directional bias should be exercised. The next few weeks should tell the ultimate tale.

Happy Trading!

Test drive our video analysis and trade idea service for only $1 – www.TradersVideoPlaybook.com

Chris Vermeulen & JW Jones


Gold Market “To Be Driven by Politics This Week”, ECB Intervention “Would Be Like Solving Problems with Drugs”

London Gold Market Report
from Ben Traynor
BullionVault
Monday 20 August 2012, 07:00 EDT

SPOT MARKET gold bullion prices dipped back below $1615 an ounce during Monday morning’s London trading, the level at which they ended last week.

“The 11 week moving average comes in at $1601,” say technical analysts at bullion bank Scotia Mocatta, pointing out that gold has now ended the week above that level for four weeks in a row.

Silver bullion meantime failed to hold on to gains from Monday’s Asian trading, falling back towards last week’s close at $28.10 per ounce this morning in London.

Other commodities were broadly flat, with copper losing some ground, while European stock markets edged higher, with the exception of the FTSE in London, which was slightly down by lunchtime.

“The gold market this week is likely to be driven predominantly by political factors,” says a note from Commerzbank.

Jean-Claude Juncker, head of the Eurogroup of single currency finance ministers, is expected to visit Athens Wednesday to discuss Greece’s request for a two-year extension to its austerity program.

A day later, German chancellor Angela Merkel and French president Francois Hollande are due to meet in Berlin, while on Friday and Saturday Greek prime minister Antonis Samaras is expected in Berlin and Paris to continue discussions over extending the Greek program and possible additional aid.

“We cannot create yet another new program,” said German finance minister Wolfgang Schaeuble on Saturday.

“It is not responsible to throw money into a bottomless pit.”

The European Central Bank meantime is expected to discuss the possibility of setting interest rate limits on sovereign bonds when it meets next month, according to a report in Germany’s Spiegel magazine.

The limits would apply to so-called spreads over bunds – the difference between the interest rate on a given nation’s government bonds and the yield of German government debt – and would trigger ECB intervention in the market, the magazine reported.

Were such a policy to be announced, “many in the market would still have doubts about whether the ECB has the capacity to make [it] work,” says Elwin de Groot, senior market economist at Rabobank.

“[The ECB would need] to pledge unlimited purchases which I think does not really fit with their mandate.”

“If we start doing that, we won’t stop,” said Germany’s Schaeuble Saturday when asked about ECB bond buying.

“It’s like when you start trying to solve your problems with drugs.”

“Despite these objections we would not be surprised at all to see this spread limit idea used,” counters Steve Barrow, head of G10 research at Standard Bank.

Here in London, the Bank of England was “naïve” to think that banks were not behaving dishonestly in making interest rate submissions to the Libor panel, the body that sets the interbank lending rate, a UK parliamentary report published Saturday says.

The report, entitled ‘Fixing Libor: some preliminary findings’, also expressed concern over Bank governor Mervyn King’s role in the departure of Barclays chief executive Bob Diamond, who resigned last month after Barclays was fined for interest rate manipulation.

“Whatever the merits of the action taken by the Governor of the Bank of England and the Chairman of the [Financial Services Authority],” the report says, “the action they took has exposed implicit, and potentially arbitrary, power to force out senior figures in the financial services industry. The return of the ‘Governor’s eyebrows…comes with the need for corporate governance safeguards.”

Over in New York, the so-called speculative net long position of gold futures and options traders – calculated as the difference between the volume of bullish and bearish contracts – fell slightly over the week ended last Tuesday, figures published Friday by the Commodity Futures Trading Commission show.

By contrast, the world’s biggest gold ETF, the SPDR Gold Trust (GLD), saw its biggest one-day net inflow since last November on Friday. The volume of gold bullion held to back GLD shares rose by 0.9% to 1274.7 tonnes – the highest level since July 9.

Here in London, volume of gold bullion transferred between major bullion banks fell by 6.4% in July compared to a month earlier, according to London Bullion Market Association clearing statistics released Friday. Year-on-year the fall was 9%, although the number of individual transfers rose by nearly a third.

The volume of silver bullion transferred also fell last month, down 5.3% from June and 11.5% year-on-year.

Ben Traynor
BullionVault

Gold value calculator   |   Buy gold online at live prices

Editor of Gold News, the analysis and investment research site from world-leading gold ownership service BullionVault, Ben Traynor was formerly editor of the Fleet Street Letter, the UK’s longest-running investment letter. A Cambridge economics graduate, he is a professional writer and editor with a specialist interest in monetary economics.

(c) BullionVault 2011

Please Note: This article is to inform your thinking, not lead it. Only you can decide the best place for your money, and any decision you make will put your money at risk. Information or data included here may have already been overtaken by events – and must be verified elsewhere – should you choose to act on it.