Is the Euro-Zone Crisis Spreading to Germany?

Source: ForexYard

printprofile

At FOREXYARD, we believe in keeping our clients prepared for potentially significant news events. As such, traders will want to carefully monitor the German ZEW Economic Sentiment, scheduled to be released today, at 9:00 GMT. Last month, the German indicator came in well below expectations and caused the Dax 30 to drop suddenly, as can be seen in the chart below.
dax

Don’t miss out on another opportunity to capitalize on market volatility!

If today’s news once again comes in below the forecasted level, fears that the euro-zone debt crisis is spreading to Germany may increase. As a result, riskier currencies and indices, like the EUR, AUD and Dax 30, could see significant losses during mid-day trading. This is an excellent opportunity for forex traders to take advantage of potentially significant news, so don’t miss out!

Read more forex news on our forex blog

Forex Market Analysis provided by ForexYard.

© 2006 by FxYard Ltd

Disclaimer: Trading Foreign Exchange carries a high level of risk and may not be suitable for all investors. There is a possibility that you could sustain a loss of all of your investment and therefore you should not invest money that you cannot afford to lose. You should be aware of all the risks associated with Foreign Exchange trading.

Is This Man the Ultimate Contrarian Indicator for Mining Shares?

By MoneyMorning.com.au

We may have just got our best contrarian signal to start buying mining shares.

This doesn’t come from the markets, economic data, or any traditional measurable observation.

It comes from our own dear Resources Minister, Martin Ferguson.

Under the headline of ‘Australia’s mining boom is over’, Mineweb reports:

‘…at the opening of the Australian Minerals Research Centre in Perth Ferguson said the premium prices China was paying for coal and iron ore were gone … the era of high commodity prices is over and to stay strong Australia must be more productive and develop new technology…’

If you read that as bad news, then read it again — but this time bear in mind you are listening to a politician.

Historically, politicians are not exactly the best forecasters.

It seems not five minutes ago, the government was making plans (and inventing taxes) around a mining boom that was going to infinity…and beyond.

But now — the mining boom is over?

Give me a break!

Just 18 months back, Ferguson himself was bullish as hell, preparing for the commodities boom to keep making Australians rich for years to come.

Commenting on the Australian Bureau of Agricultural and Resource Economics (ABARE) report, Martin Ferguson said ‘the figures showed the resources industry was going from ”strength to strength”’. He then upped the stakes by saying, ‘I expect this trend to continue, with more key projects potentially coming on line.’

The day he said that was a GREAT time to sell.

Within a few months, the Metals and Mining index started a 15 month slide that has shaved 40% off the index’s value.

The Australian Resource Minister – the Ultimate Contrarian Indicator?

The Australian Resource Minister

Source: Slipstream Trader, with Money Morning edits

So forgive me if I don’t seem panicked at his latest comments. If his past form is any guide, you’ll do quite well by investing contrary to his views.

Because now he’s all but claiming the mining boom is over. That tells me we are at (or getting close to) the bottom in mining shares.

A turnaround in mining shares in this market? That probably sounds insane.

It’s hard to imagine when there is bad news everywhere; particularly when our number one customer — China — is in trouble.

We have been China-bashing recently ourselves.

But I couldn’t ignore there were a few decent nuggets of good news in an onslaught of China data last week. You just have to bear in mind that Chinese official data is as trustworthy as an email from a long-lost Nigerian relative.

The first thing to catch my eye was that, although the annual figure fell, the quarterly economic growth has been stable now for 3 quarters. The latest figure of 1.8% was pretty impressive, the same as the first quarter of this year, and not far behind the last quarter of 2011. It’s certainly not falling off a cliff just yet.

Chinese Quarterly Economic Growth Stabilising?

 Chinese Quarterly Growth Stabilising?

Source: Trading economics

The other thing to note is that Chinese bank lending is still increasing (click here for chart).

This is the Chinese government’s main method of giving the system another sugar rush, so we shouldn’t ignore the fact that last month’s lending has just jumped 50% compared to the figure this time last year. The Chinese premier is also out there hinting that the government is planning on more infrastructure spending.

Of course, ultimately these attempts may not keep the Merry-go-round from merrily going round. But at the very least we can expect to see commodities pick up on the back of this in the short term.

I’m certainly getting more bullish on gold stocks again.

But perhaps it’s also time to load up on all mining shares.

Now the Aussie Resources Minister has finally cracked and gone bearish…we must be getting close to a bull market rally.

Dr. Alex Cowie
Editor, Money Morning

Related Articles

Market Pullback Exposes Five Stocks to Buy

The Credit Market Debt Bubble and the Role of Gold

This Gold Price Cycle Shows We’re Headed for a Rise


Is This Man the Ultimate Contrarian Indicator for Mining Shares?

Why My Excitement Level for Gold Stocks Has Risen +33% Since Yesterday

By MoneyMorning.com.au

In yesterday’s Money Morning article on gold stocks I asked the question:

‘What’s the difference between a gold stock investor…and a pigeon?’

I outlined why this could herald a well overdue turnaround in gold stocks.

But gold stocks may have turned already…

The junior gold index, GDXJ, has bounced yet again from a key level. It was up again overnight, and is now up 4% so far this week.

Since I wrote yesterday’s update, I read a great research note from Bullion Vault that increased my excitement level for gold stocks. It points out that gold has gone precisely nowhere for the last 12 months. Every time it has done that in the last ten years, gold has then gained an average of 33% in the following 12 months.

That’s a pretty remarkable observation.

And if this pattern continues, then now is the time to buy gold.

But if you want more than a 33% gain, your best bet is buy gold stocks instead!

I’ve followed four gold stocks in the Diggers and Drillers portfolio, and my analysis says they could be on the cusp of making investors some decent gains.

Dr. Alex Cowie
Editor, Money Morning

Related Articles

Market Pullback Exposes Five Stocks to Buy

The Credit Market Debt Bubble and the Role of Gold

This Gold Price Cycle Shows We’re Headed for a Rise


Why My Excitement Level for Gold Stocks Has Risen +33% Since Yesterday

How Commodity Stocks Provide High Yields and a Hedge Against Inflation

By MoneyMorning.com.au

For years now I’ve been pounding the table on two big themes…

The first is that income investing is a great way to boost not only your returns but your cash flow. And second, that every investor should have a substantial chunk of their portfolio invested in commodity stocks.

Here’s the good news: it is perfectly possible to combine the two strategies, earning the benefits of both worlds.

In fact, by investing in income-producing commodity stocks, you get a steady stream of income along with the best possible protection against the ravages of inflation.

That combination is tough to beat. Let me explain…

Commodity Stocks With Income + Appreciation

The truth is, income investing is crucial for three reasons.

The first is obvious. No matter how well-off you become, the bills just keep getting worse and worse. I never met anyone that couldn’t use more cash.

The next two aren’t nearly as evident to most investors – even though both are of the utmost importance to their portfolios.

Stocks that pay steady, consistent dividends add a measure of certainty to share prices. It’s why top quality dividend stocks typically do well even in bear markets. Conversely, since earnings are so easily manipulated, companies with fancy bottom lines but no dividend usually turn out to be a scam and end up being priced accordingly when things turn south.

Finally, dividends themselves keep management honest (or fairly honest). Cash that is paid out to shareholders cannot be used for grandiose expansion plans, or to pump up the stock price to help inflate top management’s stock options.

As a result, companies that pay decent dividends are less likely to suffer value-destroying scams than those that don’t and are likely to be around longer. For investors, that offers stability – invaluable these days.

Why You Should Favour Commodity Stocks

As for commodity stocks, I’ll be the first to admit they are not a universal panacea. But two long-term factors currently favor them.

The first is in emerging markets which tend to consume more commodity-intensive goods as their national wealth grows.

The second trend is a bit less agreeable though one of the most powerful movers of commodity prices. It’s the world’s central bankers.

For the past five years, global monetary policy has been jammed into accelerator mode, with interest rates far below the inflation rate. This tends to raise commodity prices, especially in gold and silver, since they are thought to be good protection against inflation.

But here’s the payoff for investors: commodity stocks are actually cheap right now.

Commodity prices have come off their spring 2011 highs, indeed declining more than the stock market in general. Still, commodity prices have remained quite strong, so many commodity-related stocks are selling at very attractive valuations. With global monetary policy becoming even more expansive and emerging market growth continuing strong, the stage is set for a sharp commodities-related rally.

In fact, even if the markets as a whole are weak in the second half of 2012, commodity stocks with moderate leverage and good dividends are likely to outperform.

Martin Hutchinson
Contributing Editor, Money Morning

Publisher’s Note: This article first appeared in Money Morning (USA)

From the Archives…

The Credit Market Debt Bubble and the Role of Gold
13-07-2012 – Greg Canavan

How to Survive and Thrive from China’s Bust
12-07-2012 – Kris Sayce

Payday Loans: Why This Lender of Last Resort Isn’t the Bad Guy
11-07-2012 – Kris Sayce

What A Slowing Chinese Economy Means For Pork Chops
10-07-2012 – Dr. Alex Cowie

Late News: Bankers Rig Interest Rates, No-One Fired
09-07-2012 – Dr. Alex Cowie


How Commodity Stocks Provide High Yields and a Hedge Against Inflation

Trading Forex with Elliott Doesn’t Have to be Complicated [VIDEO]

Watch a simple lesson on Elliott waves from Chief Currency Strategist Jim Martens

By Elliott Wave International

Understanding the Wave principle doesn’t have to be hard. In fact, as you’ll see in this 5-minute clip, learning from EWI’s Chief Currency Strategist Jim Martens can be downright entertaining.

Watch as the 20-year veteran analyst explains how learning to use Elliott waves can be as simple as counting to 5 and knowing your A-B-Cs.


Want to learn more? Get 10 Lessons on the Elliott Wave Principle — FREE!The Elliott Wave Basic Tutorial is a 10-lesson comprehensive online course with the same content you’d receive in a formal training class — but you can learn at your own pace and review the material as many times as you like!Get 10 FREE Lessons on The Elliott Wave Principle that Will Change the Way You Invest Forever >>


This article was syndicated by Elliott Wave International and was originally published under the headline Trading Forex with Elliott Doesn’t Have to be Complicated [VIDEO]. EWI is the world’s largest market forecasting firm. Its staff of full-time analysts led by Chartered Market Technician Robert Prechter provides 24-hour-a-day market analysis to institutional and private investors around the world.


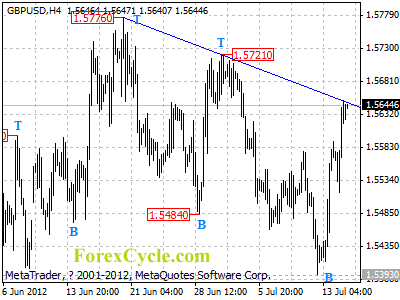
GBPUSD is facing trend line resistance

GBPUSD is facing the resistance of the downward trend line from 1.5776 to 1.5721. As long as the trend line resistance holds, we’d expect the downtrend to resume, and another fall towards 1.5000 is still possible. However, a clear break above the trend line resistance will suggest that the downtrend from 1.5776 has completed at 1.5393 already, then the following upward movement could bring price to 1.6000 zone.

gbpusd

Forex Signals

EMA 75 Swing Strategy

EMA 75 SWING  STRATEGY

Time frame: 1H
Pair: major

Indicators: EMA  75 , YELLOW COLOR

                 ENVELOPES    PERIOD  EMA 75  DEVIATION   0.05  BLUE , RED, COLOR
                 ENVELOPES    PERIOD  EMA 75  DEVIATION   0.10  BLUE , RED, COLOR                                      
                 ENVELOPES    PERIOD  EMA 75  DEVIATION   0.20  BLUE , RED, COLOR
                 ENVELOPES    PERIOD  EMA 75  DEVIATION   0.30  BLUE,  RED, COLOR
                 ENVELOPES    PERIOD  EMA 75  DEVIATION   0.40  BLUE , RED, COLOR
                 ENVELOPES    PERIOD  EMA 75  DEVIATION   0.50  BLUE,  RED, COLOR
              
                 ZIGZAG ,  WHITE

SHORT OR LONG POSITION:  WHEN PRICE HIT  NEAR 75 SMA YELLOW  ENTRY AND EXIT  PRICE HIT BELOW LAST  ENVELOPE LINE  AND RE ENTRY THE A SAME RULE.

STOP LOSS ABOVE  LAST ENVELOPE LINE .


Example below – click for larger view

Unemployment Claims Falls as EUR/USD Edges Closer to Critical Support

By TraderVox.com

Tradervox.com (Dublin) – The weekly jobless claims dropped from 376,000 to 350,000 this week, which is a big shift from the trend experienced before. Most economists have termed this as a one-off event and is not reflective of a change in trend. Such numbers were seen at the beginning of the year, and the current figure is a new four-year low.

Despite such encouraging data, there are reasons to worry as currencies fail to react. The USD/JPY which increases on positive US data is still lower at 79.20 while the EUR/USD is still low at $1.2180. There have been credible explanations of the lower than expected data with some analysts saying this might have resulted from the celebration of the Independence Day in the US which was on July 4, which was in the middle of the week. This might have caused many unemployed people to fail to claim their benefits. Further, economists have also cited that most companies that shutdown for summer were not shut hence significantly reducing the number of unemployment claims.

The EUR/USD pair is edging closer to breaking critical support, and this might be the reason why this pair did not react as support levels show much strength. However, the pair is still at new 2-year low as investors analyze the Spanish bond performance and the FOMC data. The EUR/USD has broken the important support line of 1.22 and there is no other line prior to the critical support at 1.2150. This line was a major separator when the market collapsed after the first Greece bailout in May 2010.

The pair fell after FOMC meeting minutes showed that only two of the members support additional dollar printing as a measure to spur growth while others taking a wait and see stance. Further, bad news came from Europe, where Spain is due to receive 30 billion euros to help its financial institution. However, the government is paying dearly with the PM announcing a 65 billion euro package to solve the debt crisis in the country. This means additional VAT shooting from 18 to 21 percent, unemployment benefit cut, and cancellation of Christmas bonus. These measures will weigh heavily on the people and the market is waiting to see how people will react.

Disclaimer
Tradervox.com is not giving advice nor is qualified or licensed to provide financial advice. You must seek guidance from your personal advisors before acting on this information. While we try to ensure that all of the information provided on this website is kept up-to-date and accurate we accept no responsibility for any use made of the information provided. Opinions expressed at Tradervox.com are those of the individual authors and do not necessarily represent the opinion of Tradervox.com or its management. 

Article provided by TraderVox.com
Tradervox.com is a Forex News Portal that provides real-time news and analysis relating to the Currency Markets.
News and analysis are produced throughout the day by our in-house staff.
Follow us on twitter: www.twitter.com/tradervox

Major Events that Will Affect the GBP/USD Cross This Week

By TraderVox.com

Tradervox.com (Dublin) – The sterling pound closed the week almost a cent higher than the previous week, following some strong releases at the end of the week. The strong Manufacturing production and industrial production reports came in above the market expectation hence boosting the demand for pound as a safe haven. However, the pair has pared its gains at the start of trading on Monday, after Rightmove HPI report showed that the index fell to the least in eight months. The index fell by 1.7 percent.

Other events that will shape the trading of the cross include the CPI data that will be released on Tuesday at 0830hrs and the BOE governor Mervyn King speech thirty minutes later. The CPI data has shown a downward trend in the recent releases and a slight decline is expected this time. The Bank of England Governor Mervyn king will speak at 0900hrs where investors will be keen on sentiments and directions given by the governor.

On Wednesday, the Claimant Count Change and the MPC Meeting Minutes will be released at 0830hrs. The claimant count change disappointed last month as the figure came out stronger than expected. The market expects the data to stand at 7,400 while the unemployment rate is expected to remain stagnant at 8.2 percent. The BOE Meeting Minutes will show the voting patterns during the BOE recent rate decision and the Asset purchases Facility program.

There will be one important event on Thursday and another on Friday where the Retail Sales data will be released on Thursday and the public sector net borrowing will be on Friday; both reports will be released at 0830hrs GMT. The market estimates a drop of 0.6 percent in the July reading of the Retail sales. This indicator is followed closely by investors as it gives the trend of most important gauges of consumer spending. The Public Sector Net Borrowing is expected to came in at 12.5 billion pounds for the month of July.

Disclaimer
Tradervox.com is not giving advice nor is qualified or licensed to provide financial advice. You must seek guidance from your personal advisors before acting on this information. While we try to ensure that all of the information provided on this website is kept up-to-date and accurate we accept no responsibility for any use made of the information provided. Opinions expressed at Tradervox.com are those of the individual authors and do not necessarily represent the opinion of Tradervox.com or its management. 

Article provided by TraderVox.com
Tradervox.com is a Forex News Portal that provides real-time news and analysis relating to the Currency Markets.
News and analysis are produced throughout the day by our in-house staff.
Follow us on twitter: www.twitter.com/tradervox

Central Bank News Link List – July 16, 2012

By Central Bank News

    Here’s today’s Central Bank News link list, click through if you missed the previous link list. The list is updated during the day with the latest news about central banks so readers don’t miss any important developments.