Euro Closes the Week at 12-Year Low against the Yen

By TraderVox.com

Tradervox.com (Dublin) – The euro has continued to decline against the Japanese currency for the fourth week in a row. It closed the week at 12-year low after concerns the region’s debt crisis is worsening increased the demand for safety as the market went into the weekend. Most traders went for the yen, as the demand for the US dollar was dampened by bets on Federal Reserve’s action to stimulate economic growth in the country. The greenback remained unattractive to investors prior to release of data this week expected to show a slowdown in US growth. The Australian dollar closed the week on a high as implied volatility fell to five-year low allowing traders to buy riskier assets. The 17-nation currency dropped despite the approval by European officials on Spanish banks’ loan.

According to Joe Manimbo who is a market analys at Western Union Business Solutions in Washington indicated that there is increased uncertainty in the market which has led to investors running away from the euro. He also added that there is a general hope for additional stimulus from major central banks around the world hence the continued demand for riskier assets.

The 17-nation currency dropped to the lowest levels since 2008 against the pound and dropped to new lows against the Australian dollar. The Spanish borrowing cost also increased to euro-era high which has added to speculations of adverse times ahead for the region. The euro zone currency dropped by 1.6 percent against the yen to trade at 95.43 yen on Friday in New York to record a weekly drop for the fourth week in a row. The euro had touched its lowest since November 2000 of 95.35 yen earlier in the day. The euro also continued to drop for the third week against the greenback, registering a 0.8 percent drop to trade at $1.2157, it also touched its June 2010 low of $1.2144 during trading on Friday.


Disclaimer
Tradervox.com is not giving advice nor is qualified or licensed to provide financial advice. You must seek guidance from your personal advisors before acting on this information. While we try to ensure that all of the information provided on this website is kept up-to-date and accurate we accept no responsibility for any use made of the information provided. Opinions expressed at Tradervox.com are those of the individual authors and do not necessarily represent the opinion of Tradervox.com or its management. 

Article provided by TraderVox.com
Tradervox.com is a Forex News Portal that provides real-time news and analysis relating to the Currency Markets.
News and analysis are produced throughout the day by our in-house staff.
Follow us on twitter: www.twitter.com/tradervox

This Week’s Technical Analysis For Major Pairs

By TraderVox.com

Tradervox.com (Dublin) – The USD has been down against major currencies but remained strong against the euro. However, the Euro has touched new lows against most majors reaching a 12-year low against the yen as new market concerns rose on euro zone debt crisis. Here is the market outlook for major pairs.
EUR/USD: the pair was spirited to break higher, but it had no enough support to breach the 1.2330 line. This pair dropped lower to close the week at just above 1.2150 critical support level. The euro-dollar pair is expected to continue on a bearish trend as Angela Merkel casts doubts on the success of efforts made by the euro zone leaders. The US on the other side is not providing enough data to quell QE3 speculations despite Fed Chairman Ben Bernanke refusing to provide any clues. The range between 1.2144 and 1.2150 is critical and loss of this could lead to a downfall.

USD/JPY: the yen continued to strengthen against the dollar and questions on whether BOJ will intervene are being asked. The pair attempted to reach 79.10 line with no success and fell to 78.46 where it closed. The uptrend support was broken and the pair moved sideways before dropping, there is a bullish outlook on the pair this week however as the dollar recaptures its safe haven demand.

GBP/USD: the cross moved upwards during the week as the pound strengthened against the dollar, but lost some of those gains to close the week at 1.5615. The pair had opened the week at 1.5580; dropped to 1.5517 and then rose to 1.5737 as the 1.5750 resistance line held firm. The pair dropped slightly to close the week at 1.5615. Due to concerns in the US data, the pair has a bullish outlook this week.

USD/CHF: the pair was choppy last week where it increased to 0.9874. The cross opened the week at 0.9806 and dropped to 0.9783 before climbing to 0.9887 as the resistance line of 0.9915 held strong. The pair then shed some of these gains to close the week at 0.9874. The cross is expected to remain within range this week as US safety status continues to lose confidence among investors.

Disclaimer
Tradervox.com is not giving advice nor is qualified or licensed to provide financial advice. You must seek guidance from your personal advisors before acting on this information. While we try to ensure that all of the information provided on this website is kept up-to-date and accurate we accept no responsibility for any use made of the information provided. Opinions expressed at Tradervox.com are those of the individual authors and do not necessarily represent the opinion of Tradervox.com or its management. 

Article provided by TraderVox.com
Tradervox.com is a Forex News Portal that provides real-time news and analysis relating to the Currency Markets.
News and analysis are produced throughout the day by our in-house staff.
Follow us on twitter: www.twitter.com/tradervox

Why Potash Stocks Are Set to Gain From a Global Food Warning

By MoneyMorning.com.au

We enjoyed some great winter sun down in Melbourne this weekend.

On Saturday the thermometer hit a balmy 17°C!

I took my kids down to the park in the morning, and met up with colleague Greg Canavan and his family. After recently moving from Sydney, they are still getting used to Melbourne’s crazy weather. I’ve been here ten years, and I’m still getting used to it!

What was even crazier was that on Saturday, Melbourne was a degree warmer, in the depths of its winter, than London was on Saturday, during the ‘height’ of its summer.

The UK’s ‘summer-time‘ has been a total washout so far. With the London 2012 Olympics round the corner, the Brits are not happy with the freakishly bad weather.

But it’s not just the UK dealing with extreme weather.

The US has been under a heatwave for weeks. The US National Oceanic and Atmospheric Administration is now saying that the US is in the middle of its worst drought since 1956.

The country’s agricultural sector is suffering badly. The corn harvest in particular looks like it is going to be a disaster.

Less than a third of the national crop is in good shape. We’ll have to wait until the harvest to see just how bad it will be, but prices are already soaring in anticipation of a huge drop in production.

The US agricultural secretary was quoted in the Financial Times saying:

‘I get on my knees every day and I’m saying an extra prayer right now … If I had a rain prayer or a rain dance I could do, I would do it.’

Hearing comments like that from the top of the agricultural sector hasn’t helped calm market nerves. The corn price has gone off like a rocket. Since the start of June it has jumped by 45% — setting a new record high.

Corn Price — Up 45% in Just 7 weeks

Source: Stockcharts

The US is now looking to Brazil to help bridge the shortfall. The result is that there won’t be much left over for other countries hoping for some corn this year. The corn market will be very tight.

This highlights the issue of ‘food security’: the increasing threat of inadequate or volatile food supplies for global population. This will be something we will hear more about if this harvest is as bad as they fear. The FT also reported:

‘”I’ve been in the business more than 30 years and this is by far and away the most serious weather issue and supply and demand problem that I have seen by a mile,” said a senior executive at a trading house. “It’s not even comparable to 2007-08.”‘

We could well see another swathe of food riots around the world — mostly in poor countries that bear the brunt of supply shocks — like we did the last time the corn price was at these levels, in 2008.

Then, after the market is reminded of the tragic human cost of crop failures, the global conversation will focus on food security once again.

Part of this conversation will be highlighting the importance of fertilisers to increase production rates.

In short — each year the world tries to feed more mouths with less farmland, while enduring more volatile weather. So farmers need to use fertilisers to make every hectare count.

Why Potash is a Key Resource

Potash (a potassium salt) and phosphate are two of the key raw ingredients for the fertiliser industry. And both of them are produced by mining.

The potash sector had been wallowing since the start of last year, despite potash prices holding firm.

However, the major potash stocks have finally turned around over the last 2 months — roughly in line with the corn price.

Majors like Potash Corp (NYSE:POT) have all jumped more than 20% in this time, while the rest of the mining sector crashed around them.

Potash was the darling of the Aussie market a few years ago, after BHP made a bungled bid for Potash Corp. As the excitement passed, the prices of ASX potash stocks slowly fell, as the hordes moved on.

But while the market has been looking elsewhere, some of these potash stocks have been very busy. I’m still following one of the stocks that I tipped for Diggers and Drillers readers, and the price is less than half of what it was when I tipped it. There is hardly a shortage of under priced resource stocks on the market today, but the value in this stock is remarkable.

Generally, Aussie potash stocks move up and down closely with the Canadian majors.

But so far the Aussie market seems to have completely overlooked the fact that the Canadian potash majors are now rallying.

So we may have a double opportunity here.

At some point, and probably soon, the Aussie potash juniors will start playing catch-up to the 20% rally seen in the Canadians. Meanwhile, the market should also start pricing in the progress made by those stocks that have been quietly getting on with things.

I’ve been watching and waiting for this turnaround, and for some potash stocks it looks like we might be witnessing the very start of it right now. Let’s hope so.

Dr. Alex Cowie
Editor, Money Morning

Related Articles

Market Pullback Exposes Five Stocks to Buy

When the Going Gets Tough, Entrepreneurs Innovate

Is This Man the Ultimate Contrarian Indicator for Mining Shares?


Why Potash Stocks Are Set to Gain From a Global Food Warning

The End of Growth Through Currency Wars

By MoneyMorning.com.au

The Plaza accord was initially set up in 1985 and included five countries; the United States, West Germany, Japan, France and the United Kingdom.

What was it?

The US dollar was strong against all the major currencies towards the end of the seventies, giving American trading partners, like Japan, and Europe a competitive advantage when it came to their exports. This was becoming a political problem for the US. Car manufacturers lost market share and jobs to Japan.

What’s more, Europe and Japan were so addicted to export led growth that domestic consumption fell off a cliff. Economies in Europe, much like Japan, ran huge trade surpluses with the US but actually experienced economic contraction.

The solution was now what’s known as the Plaza Accord of 1985, so called because it was negotiated in September at the Plaza Hotel in New York. Back then it was just the G-5. All five countries agreed to intervene in the currency markets to orchestrate a weaker US dollar.

The point of the whole exercise was to transfer growth from the US market to the rest of the world. The world has stopped growing. The monetary authorities agreed to engineer some growth by weakening the dollar (especially against the Yen and the Deutschmark) and encouraging consumption and investment in the rest of the world. It worked.

It worked too well.

By 1987, the G-5 had expanded to the G-6 to include Canada. The G-6 gathered in Paris to sign the Louvre accord. This time their goal was to strengthen the dollar in the name of stability. Global growth had been rebooted, but the dollar’s slide had resulted in too much volatility in currency and financial markets

The Start of the Currency War

A currency war is fundamentally an attempt to improve economic competitiveness at the national level. The self-defeating aspect of a currency war is that you can only do so at the expense of your neighbours, whom you hope to make your customers. Your growth comes at their expense. They must consume in order for you to save.

This was fine back in 1985 with the Plaza accord. The US could effectively ‘lend’ growth to Japan and Europe. The US ran large current account deficits. But the key difference between then and now was that there was a strong currency (the US dollar) which could be weakened, and weak currencies which could be strengthened.

The US could let the dollar slide because the economy was booming. Jobs were plentiful. The government deficits were growing but not huge. Devaluation hurt, but only to the national pride, not in any noticeable way on a purchasing-power basis.

Today, there is no one currency against which all others can strengthen to everyone’s mutual benefit. Competitive devaluations have become a zero sum game, always costing one country jobs and exports. This is why Brazilian Finance Minister Guido Mantega said in 2010 that the world was in a new currency war. He knew that interest rates were being used by central banks as a weapon to deal with domestic debt problems and boost export competitiveness.

Effectively, everyone in the world is trying to boost their own economic growth by weakening their currency so they can sell their goods to other countries. This has led Europe, Japan, and the US all to the same place: zero real interest rates.

These countries have chosen to deal with deflating asset bubbles and low growth by lowering real interest rates. They’ve avoided a reckoning. But in so doing, they’ve zombified their economies, sucking out all the life of a dynamic market and injecting it with the formaldehyde of unproductive debt. They have also trod the path of currency devaluation down to its logical conclusion.

Protecting Your Investments in a Currency War

What I’m almost certain of is that this is just the beginning. If the currency war moves from interest rates and monetary and fiscal policy to cyber weapons, price manipulation and an attack on the financial architecture of the modern world, then a threat exists that is neither fully understood nor appreciated. So what can and should you about this emerging threat?

How do you create non-financial wealth and personal security?

Short of opting out of the current system and dropping off ‘the grid’ — a radical option that most of us are not in the position to choose and probably wouldn’t choose anyway — what can you realistically do to hedge against major losses in the share market as a result of deleveraging and major disruptions to the economy as a result of the evolving currency war of all against all?

Well, I think the answer lies in thinking about what wealth really is. I don’t mean to get philosophical. But really, it doesn’t hurt to think about why we bother to invest and protect and grow our wealth. Is it for the love of the game? Is it because we enjoy the challenge?

It may be for those reasons. But fundamentally, wealth creation and preservation is about having the freedom to live the life you’ve imagined for yourself, a life of purpose and creation and value, whatever value means to you. Financial wealth helps us achieve those ends. But it is not an end in itself.

Building non-financial wealth means taking steps to improve your quality of life and personal security. For me, that means appraising the financial system with honest and sceptical eyes.

It then means reducing the amount of my wealth at risk in financial markets and converting it into tangible assets that have utility.

For some people it may mean living a simpler financial life with less risk and fewer day-to-day decisions (peace of mind). This is probably a demographic trend we’ll see anyway. As the baby boomers approach retirement age, I expect those that are able to will begin liquidating their retirement portfolios and living off their accumulated savings.

Dan Denning
Editor, Australian Wealth Gameplan

From the Archives…

No Mr. President, Entrepreneurs Did Build That…
20-07-2012 – Kris Sayce

How an Interest Rate Rise Could Trigger a ‘Punch Bowl’ Rally
19-07-2012 – Kris Sayce

When the Going Gets Tough, Entrepreneurs Innovate
18-07-2012 – Kris Sayce

Is This Man the Ultimate Contrarian Indicator for Mining Shares?
17-07-2012 – Dr. Alex Cowie

How Gold Stocks Could Become Your Gilded Lifeboat
16-07-2012 – Dr. Alex Cowie


The End of Growth Through Currency Wars

The Real Villain Behind the Curtain in the LIBOR Scandal

By MoneyMorning.com.au

There’s nothing like pulling back the curtain on the fraud that’s centre stage in the LIBOR manipulation scandal and finding the levers are really being pulled by central banks.

It’s not about the banks doing what they did. The revelation is this: Central banks are the biggest impediment to free markets and the reason capital markets have become casinos.

And until the tyranny of their grip is broken, the majority of public investors are going to rightfully sit on the sidelines and long-term economic growth will be impossible.

The LIBOR scandal is just a sideshow. There’s nothing new there.

Banks manipulated LIBOR (the London Interbank Offered Rate), the benchmark for over 800 trillion dollars in interest rate-sensitive loans and financial instruments, to jack up profits on trading positions they held.

Bankers scheming, lying and cheating for bigger bonuses at the expense of anyone in their way…that’s news?

No, but here’s the real inside scoop…

They were told to do it – both implicitly and explicitly – by the central banks that are supposed to regulate them (as is the case with the U.S. Federal Reserve Bank) and provide a safety net that facilitates capital formation and commerce on a global scale.

The Birth of the Housing Bubble

Let’s not get overly technical here.

Suffice it to say that global credit expansion due to artificially low interest rates caused the build-up of leverage in a yield-starved investment environment and led to the housing bubbles that burst from sea to shining sea.

Who orchestrated the low interest rate environment? That would be the Federal Reserve Bank and central banks across the globe.

If there was no manipulation by central banks, the free market for credit would have walled off a lot of speculators from access to credit they didn’t deserve.

Central banks, especially the Federal Reserve Bank as a regulator, knew the health of the banks, knew they were leveraging themselves, knew they were piling up under-collateralized, securitized “assets” in off-balance sheet special-purpose vehicles.

They also knew they were forcing banks to lend at low rates. They themselves manipulated the rates to be that low and wanted the banks to extend their articulated policy throughout the economy, like a pox on the population.

And when we ended up in a financial crisis and found out the banks were all insolvent, what did the central banks do?

They winked and nodded to the banks to manipulate LIBOR to prove to the world that there was no crisis and the system was still functioning as reflected in the low cost of interbank lending.

In fact, central banks were lying to the public and more than tacitly acknowledging that bank CEOs were also lying to the public’s face, saying they were in good shape when in fact they were borrowing hundreds of billions (trillions globally) from central banks.

Because the truth is if LIBOR wasn’t manipulated it would have gone through the roof and the whole world would have come to a standstill, which it did anyway.

And now to fix the mess they created by manipulating banks to keep interest rates low, central banks are adding “stimulus” (which is nothing more than giving banks more money) to keep interest rates low.

It never ends.

Breaking the Grip of Central Banks

The tyranny of central bank manipulation and the suffocation of free markets has to stop.

There’s only one way to do it. Dismantle all the big banks and limit the size of banking institutions so that any one or two or five or six that fail won’t implode the global financial system. Let them fail and resolve ring-fenced fiascos under existing bankruptcy laws.

If we get banks down to a sensible size, we won’t need central banks. Sure, we can still have them, but they should be run by academics (not bankers) with a singular mandate, price stability, that’s articulated in advance and achieved with total transparency.

The truth is that central banks are shills for the banking behemoths.

They manipulate politicians, overrun fiscal discipline at times (not that there’s much of that anywhere in the world these days) and use their limitless powers to feed profitability pools at banks.

The LIBOR scandal is a window into the workings of central banks and how they’ve aided and abetted the casino capital markets that serve the banks at the expense of long-term capital investment and sustainable economic growth.

It has to stop.

Shah Gilani
Contributing Editor, Money Morning

Publisher’s Note: This article first appeared in Money Morning (USA)

From the Archives…

No Mr. President, Entrepreneurs Did Build That…
20-07-2012 – Kris Sayce

How an Interest Rate Rise Could Trigger a ‘Punch Bowl’ Rally
19-07-2012 – Kris Sayce

When the Going Gets Tough, Entrepreneurs Innovate
18-07-2012 – Kris Sayce

Is This Man the Ultimate Contrarian Indicator for Mining Shares?
17-07-2012 – Dr. Alex Cowie

How Gold Stocks Could Become Your Gilded Lifeboat
16-07-2012 – Dr. Alex Cowie


The Real Villain Behind the Curtain in the LIBOR Scandal

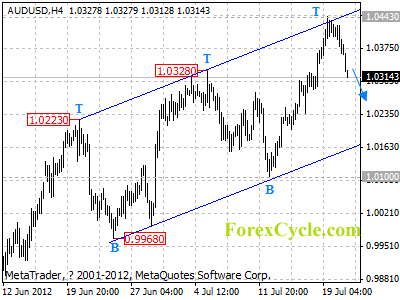
AUDUSD pulled back from 1.0443

After touching the upper border of the price channel on 4-hour chart, AUDUSD pulled back from 1.0443, suggesting that a cycle top had been formed. Further decline would likely be seen over the next several days, and the target would be at the lower line of the channel. However, the fall from 1.0443 would possibly be consolidation of the uptrend from 9581 (Jun 1 low), as long as the channel support holds, the uptrend could be expected to resume, and another rise towards 1.0700 is still possible after consolidation.

audusd

Forex Signals

Put Your Seatbelts On, It’s About To Get Bumpy!

By Chris Vermeulen, GoldAndOilGuy.com

It was just about a year ago today when the S&P was sitting at fresh highs and everyone was enjoying a rather upbeat summer.  It was a nice summer, the markets were calm, and there was a surreal sense of optimism.  Then, in the matter of a few days, things got real ugly, real quickly.

Well, it doesn’t seem like too much has changed since then.  We’ve had mixed earnings reports, ever-evolving worries in Europe, and the always looming fiscal mess in the U.S.  Once again, are we in the calm before the storm?

It looks like things in Europe may start to heat up again.  Riots turned violent again in Spain as protestors took to the street over austerity measures.  With seemingly no resolution, a sinking tourism industry in the PIGS, and a typically hot summer August on its way, all signs point to further turmoil.

Technically, we’re currently seeing a number of bearish indicators setting up in the S&P and other markets.  First, on the weekly chart of the SP500 Futures we can see what appears to be a bear flag formation developing.  Note the recent rise in price since the beginning of June on decreasing volume.

Weekly SP500 Futures Chart Patterns

Chart Pattern Trading

Chart Pattern Trading


Daily Chart Elliott Wave Count For SP500

A second look at the S&P daily illustrates a down trend and 5 wave count bounce in the market, both are currently pointing to lower prices.

  • Completion of two intermediate cycles within longer term 5 wave pattern
  • Downwards wave one from April until beginning of June followed by wave 2 correction from June until present.

The wave two correction typically proceeds the longest wave, wave three, which is pointing towards a large move down (Note that in the first shorter term cycle the downwards wave three was the longest by far.  We expect the same to be repeated in the longer term cycle.)

Elliott Wave Theory Chart Pattern Trading

Elliott Wave Theory Chart Pattern Trading


SP500 BIG PICTURE Wave Count

A look at the longer term view once again using the weekly chart, again supports our argument for a major correction.  We have just completed a 5 wave pattern since the 2009 lows, and it is looking more like a big pull back is due. Remember most major trends end after the fifth wave.

Stock Market Elliott Wave Count Chart Pattern Trading

Stock Market Elliott Wave Count Chart Pattern Trading


Copper Weekly Chart Patterns

If we take a look at the copper ETF, “JJC”, we are provided with further justification.  Copper is often referred to as “Dr.Copper” due to its industrial application and is known to be a leading indicator for equity markets.  Copper has significantly underperformed equity markets and is likely leading the next move down.  A look at the weekly chart which points to a rather dismal outlook.  There is a major head and shoulder patterns developing.

Copper Chart Pattern Trading

Copper Chart Pattern Trading


Major Market Pattern Analysis Conclusion:

Last summer turn into a bloodbath with nothing but red candlesticks taking stocks and commodities sharply lower. If you haven’t already, it’s time to lock in some profits.  Short, intermediate, and long term cycles are pointing down, and the increasingly bearish technical developments cannot be ignored.  We’ll be looking at entering multiple shorts potentially in the very near future once/if setups present themselves.  Buckle up and stay tune for more…

Stay in the loop by joining my free weekly newsletter
& videos to stay ahead of the crowd: GoldAndOilGuy.com

Chris Vermeulen


Corruption and Mismanagement See Much of the US without Power

By OilPrice.com

Amidst record-high temperatures and a very anti-climactic 4th of July, power outages have left millions without air-conditioning and even water in rural areas where households rely on electric pumps.  At least 52 people have died from heat and three million people are still without power.

No it’s not Yemen, where power outages in the capital Sana’a have sparked a new round of protests. It’s the United States of America, where corruption converges with a moribund electricity distribution system to produce increasingly frequent blackouts across the Midwest and East Coast.

A thunderstorm that struck the East Coast early last week left millions without electricity and power companies took days to restore power to about half of their customers. Four days after the storm, power was restored to 67% in the Northern Virginia suburbs and 61% in Baltimore, but Montgomery County, Maryland and parts of Washington, D.C. only managed to restore 43%, leaving over a million without electricity as temperatures soared above 100 degrees.

In the Midwest, there was less chance of blaming storms. In Michigan, for instance, an increasingly woebegone state, power outages are frequent. In counties near the capital, Lansing, hundreds of homes were without power for the 4th of July. Power was restored that evening, but lost again the following day. And this has been going on for some time.

Everyone would like to know why. The answer is simple, and three-fold: An outdated electricity distribution system, corruption and mismanagement.

Americans are now being told that keeping utility bills down means keeping maintenance of the country’s dismal electricity distribution system to a bare minimum. According to the American Society of Civil Engineers, the entire system could collapse by 2020 without an immediate investment of $673 billion. Furthermore, experts say that brownouts and blackouts will end up costing more in the end than re-hauling the entire system.

The system cannot handle increasing demand, especially when the entire country is turning on the AC. Last week’s brownouts and blackouts will become status quo.

In fact, as NPR quipped, “the basic principles of power delivery haven’t changed much since Thomas Edison flipped on the first commercial power grid in lower Manhattan on Sept. 4, 1882.”

According to the ASCE’s engineers, more than 60% of the country’s electricity transmission lines and power transformers are at least 25 years old, while 60% of the circuit breakers are more than three decades old.

This is to prepare Americans for higher utility bills in the future. But it also ignores the corruption and mismanagement that has allowed privately owned power companies to profit from bare-minimum maintenance and deregulation. There is no investment in infrastructure, no guarantees of service, and continually worsening standards of safety and maintenance.

It is an outmoded system of distribution compared to Europe’s for instance, where power lines are buried underground. While this makes them more difficult to reach and harder to fix, they are also much less at the mercy of Mother Nature.

With that in mind, all eyes are on the Potomac Electric Power Company (Pepco), the utility company that provides power to Montgomery County, Maryland and parts of Washington, D.C.  and which was rated last year by Business Insider as “the most hated company in America”.  Certainly, these past days and weeks have done nothing to help that rating.

According to OurDC, from 2008 to 2010, Pepco’s profit earnings were $882 million, yet they paid no federal or state income taxes and instead received $817 million in tax refunds. At the same time, local authorities allowed Pepco to cut back on maintenance to save money.

There was an attempt last year to take Pepco to task, but the result was a very public slap on the wrist. An investigating commission found that Pepco was not conducting inspections of its sub-transmission and distribution lines even after storms. It also found that the company was about four years behind on the tree-trimming necessary to ensure that the local greenery is not interfering with power lines. Pepco was made to promise a 3% increase in reliability year-on-year (beginning only next year), and it was fined a one-time fee of $1 million for failing to fix problems that led to frequent outages.

Of course, no major changes were enforced and Pepco paid lip service to the situation by submitting a five-year plan for improvements that would cost around $300 million and be passed directly on to the consumer.

Burying power lines would cost between $5 and $15 million per mile. Pepco likes to point out that this would mean an increase in consumer power bills by about $107 per month. The consumer would no doubt like to point out that the power companies’ greed and mismanagement, for which the consumer has long been footing the bill, should be rolled in to cover a large chunk of this cost.

As always, disunited, the consumer doesn’t have a chance. The consumer will pay for power company greed and neglect unless there is some form Arab-Spring (American Summer) manifestation.

Source: http://oilprice.com/Energy/Energy-General/From-Arab-Spring-to-American-Summer-The-Politics-of-Power-Outages.html

By. Jen Alic of Oilprice.com


Australian Dollar: “Still Surging” — Why, Again?

This is a story we’ve seen repeated in the forex markets again and again.

By Elliott Wave International

Picture this. It’s late May. You’re in Australia. You have an interest in the currency markets: Maybe you speculate in forex; maybe your business depends on the exchange rates.

Every morning, you scan the headlines. This is what you see regarding the Australian dollar during the last week of May:

  • “Aussie dollar sinks to eight-month low”
  • “Little long-term support for Australian dollar”
  • “Poor data slams Aussie dollar”
  • “Aussie dollar drops as investors seek safe-havens”
  • “Australian Dollar Down After Retail Sales Slip”
  • “Weak China PMI Sinks Euro, Australian Dollar”

Even after a strong rebound the AUD saw on May 28 and 29, you read that “analysts don’t see [the] improvement lasting too long unless the global economic backdrop improves.” You sit down to make some decisions in preparation for an even weaker Aussie, and…

…and now, six weeks later, the AUD is orbiting the moon. Yes, between June 1 and today, against the U.S. dollar the Aussie dollar shot up from near $0.96 to over $1.04, despite all the “bad fundamentals” from late May.

This is a story we’ve seen repeated in the forex markets again and again: Right when everyone accepts the trend (bullish or bearish) as “the new normal,” the trend reverses.

We are proud to say that we don’t follow the herd off the cliff each time they head that way — because we have the right forecasting tools. On June 1, our Senior Currency Strategist Jim Martens published this bullish AUD/USD forecast (excerpt; some Elliott wave labels have been erased for this article):

Excerpt from the June 1 forecast: “…AUD/USD is forming a corrective setback, either a flat or a triangle…to be followed by another push above [price target]”

This bullish forecast was based strictly on the Elliott wave picture in AUD/USD charts. Jim simply saw that the pair had reached the bottom trendline of the likely “triangle” Elliott wave pattern, so a strong rebound was due in the next wave of the pattern.

Today, after 6 weeks of rally, the AUD is “still surging,” as it has become “an attractive investment.” But you already know how rapidly this tune will change once the trend reverses.

Jim Martens has the near- and long-term AUD/USD price targets inside his Currency Specialty Service for you right now.

ALSO, don’t miss our ongoing July 18-26 “Free FX Trading Event.” Details below.


FREE FX Trading Event NOW ON!
How to Trade the Top 5 Forex Opportunities… Right Now

Now through July 26, EWI Senior Currency Strategist Jim Martens walks you through some of his best opportunities in key forex markets and shows you how to act on them using the Elliott Wave Principle.

Join in now and instantly watch online Martens’ special 1-hour kick-off webinar (recorded live July 18). You’ll learn:

  • How the Wave Principle can help improve your forex success
  • Jim’s favorite trade setups and strategies, including entries, exits and stop levels
  • Jim’s outlook for the U.S. dollar and other major currencies

PLUS, get 5 follow-up videos from Jim Martens featuring in-depth analysis of his top forex opportunities.

This is your chance to learn from one of the world’s most sought-after FX strategists. Follow the link below to join now, free.

Join EWI’s FX trading event now — 100% FREE >>


This article was syndicated by Elliott Wave International and was originally published under the headline Australian Dollar: “Still Surging” — Why, Again?. EWI is the world’s largest market forecasting firm. Its staff of full-time analysts led by Chartered Market Technician Robert Prechter provides 24-hour-a-day market analysis to institutional and private investors around the world.


Is Warren Buffett’s Bet on Housing Finally Paying Off?

Article by Investment U

Warren Buffett stated last Friday on Bloomberg Television’s In the Loop With Betty Liu that Wells Fargo & Co.’s (NYSE: WFC) dominance of the domestic mortgage market will reap huge rewards as the housing market rebounds.

Now he and his company have definitely put their money where their mouth is. Look at what he’s done over the last year and a half:

  • Back in January 2011, Buffett made additions to Berkshire’s “brick-and-mortar” portfolio by buying Jenkins Brick to combine with its existing brick maker Acme Brick.
  • Last month, Berkshire attempted to expand its real-estate brokerage by making a $3.85-billion bid for a mortgage business and loan portfolio from bankrupt Residential Capital, LLC.
  • Berkshire has gambled on commercial property through an entity owned jointly with Leucadia National Corp. (NYSE: LUK).
  • Berkshire Hathaway Inc. (NYSE: BRK-A) owns more than 7% of Wells Fargo common stock. On top of that, recent regulatory filings tell us that they are buying more shares – increasing their stake in Wells Fargo even further.

The world is pretty much enamored with the Oracle of Omaha and his track record speaks for itself. But a year ago he stated the housing market had already hit bottom. Following investment legends is a strategy some might use, but what do the numbers say?

Data Hinting Toward a Bottom?

  • Low Mortgage Rates – Federal Reserve Bank of Dallas President Richard Fisher stated to Bloomberg, “I do think the housing market has bottomed out… the improvement has been “assisted by these low mortgage rates that we’ve had.”

    Freddie Mac reported the average for a 30-year fixed-rate mortgage fell to 3.56% in the week ended July 12. That’s down from 3.62% just the prior week and 4.08% since the end of the first quarter. It’s the lowest in the company’s records dating back more than four decades.

  • Home Prices Are Rising – According to the Case-Shiller 20-City Index for April 2012, the price to purchase a home rose 1.3% for the period between March and April 2012. Before this report was released, Case-Shiller showed seven straight months of month-over-month price losses. If you take into account the prior year before the report, home prices went down a negative 1.9%.
  • Pending Home Sales – According to the National Association of Realtors, pending home sales rebounded in May. This matched the highest level for a period spanning the last two years – and the numbers are well above last year’s levels. The Pending Home Sales Index, a forward-looking indicator based on contract signings, went up nearly 6% to 101.1 in May. That’s an increase from the 95.5 in April and is 13.3% above May 2011 when it was 89.2.
  • New Residential Sales – Sales of new single-family houses in May 2012 were at a seasonally adjusted annual rate of 369,000, according to estimates reported last month by the U.S. Census Bureau and the Department of Housing and Urban Development. This is 7.6% above the revised April rate of 343,000. It’s 19.8% above the May 2011 estimate of 308,000.
  • Cheaper to Buy Than Rent – Trulia, the online residential real estate site for home buyers, sellers, renters and real estate professionals, found that in an environment of skyrocketing rents and record low housing prices, homeownership is now more affordable than renting in 98 out of 100 major metropolitan markets – even expensive real estate markets such as New York, Los Angeles and Boston.

Everything Isn’t Rosy Just Yet, Though…

Even though a good number of analysts from Wall Street see the current landscape as the bottom and a sign of a housing recovery to come, some believe that this environment is an entirely new animal. It’s different than the housing market we knew even just a decade ago. We now have to deal with:

  • Recent graduates dealing with overwhelming levels of student loan debt.
  • Stagnate incomes since 1996 when Bill Clinton was President.
  • Almost 50% of current homeowners are “stuck” in their houses.

These issues will weigh on the market for the foreseeable future.

But Beata Caranci, Deputy Chief Economist at TD Bank Group in Toronto, stated in a recent housing market report, “I don’t think it’s a head-fake, because when you look across all your price measures and construction measures on the starts side, you’re seeing broad-based indication of improvement… We have to be a little bit cautious… It’s the beginning of a recovery.”

A long those lines, a Reuter’s poll published on Friday showed most economists think the U.S. housing market has now bottomed and prices should rise nearly 2% in 2013 after a flat 2012.

Pro-Recovery Investing

If you believe in Warren Buffet and some of the other pro-recovery analysts out there, don’t expect a boom. This recovery will be slow and over the long haul. If you go in, this investment will be for the long term.

If you want to follow the Oracle, look at Wells Fargo. The bank created about one-third of U.S. mortgages in the first quarter of this year with aspirations to increase its market share to about 40%. The company said last Friday that the number of applications set a new quarterly high.

They accomplish these numbers as others in the industry have attempted to scale back mortgage operations.

You also may want to consider the SPDR S&P Homebuilders (NYSE: XHB). This ETF has broad exposure to housing related stocks. The index is up over 20% since opening the year at $17.44.

Good Investing,

Jason

Article by Investment U