Three Ways to Avoid the Next Facebook IPO Fiasco

By MoneyMorning.com.au

On the heels of the Facebook IPO fiasco, many investors are wondering how they can find the next best thing and avoid getting “facebooked” in the process.

Tall order? Not really.

First, look for companies with ideas that can be applied across a wide variety of industries.

If I had said this five years ago, you’d be looking for Internet- related start-ups or companies that can do “it” better, faster or cheaper.

Going forward however, I think the true innovation will be exponential progress that’s made linking living systems with their digital counterparts. Everything from synthetic biology to computational bioinformatics will grow a lot more rapidly than the broader markets.

So will key markets related to healing human illness, solving hunger and figuring out how to deliver potable water to broad swathes of the planet.

No doubt there will be tremendous ethical challenges along the way, but I believe we will see the line blur between what’s needed to live and how we actually live our lives.

Though it’s hard to imagine given the state of the world at the moment, I believe a fair number of the best up- and- coming investments will be outside the traditional first- tier markets of the United States, Europe and Japan.

In fact, I’d bet on it.

Second, don’t confuse the ability to organize or share information with the ability to generate revenue. One might lead to the other but they are not the same thing.

The way I see it, Facebook is a classic example of everything you don’t want in a business. It is 900 million users who spend an average of $1.32 a year. Compare that to Amazon.com, which clocks in at a much more valuable and consistent $36.52 per person.

Call me crazy, but I don’t think Facebook stock will see the bottom for a while. As I wrote, at best Facebook is worth $7.50 a share.

Revenue is slowing. Facebook doesn’t dominate the mobile markets that are becoming the preferred consumer channel for tens of millions of people. And, in what is perhaps the death knell, startups are already cannibalizing Facebook’s user base.

The ability to “like” somebody is really no different than signing their yearbook in high school — only you’re using a computer and the Internet to do it.

Third, hunt for fringe thinkers working in their garages.

It’s not enough to think differently. The next big things will come from those thinkers operating on the fringes of what the rest of us consider normal.

For example, there’s a self-taught school dropout mechanic in Wichita, KS, named Johnathan Goodwin who turned the automobile industry on its ear by figuring out how to convert gas- guzzling hummers into biodiesel trucks and 100 mpg hybrids.

Detroit said it couldn’t be done yet his company, H-Line Conversions, proved them wrong. Don’t forget that Bill Hewlett and Dave Packard started H-P in their Palo Alto garage. Incidentally, their first product was not a computer but an audio oscillator Walt Disney purchased to make the film Fantasia.

Then there’s eBay (Nasdaq: EBAY).

Now an institution, eBay has created several millionaires like Jordan Insley and Sarah Davis. Insley has sold more than $8 million worth of electronics via eBay, while Davis has moved more than $4 million worth of designer handbags online. Many eBayers operate from their garages quite literally.

Steve Jobs and Steve Wozniak also built the first Apple computers in Jobs’s parents’ garage. And the rest, as they say, is history.

Keith Fitz-Gerald
Contributing Editor, Money Morning

Publisher’s Note: This is an edited version of an article that originally appeared in Money Morning (USA)

From the Archives…

Free of the Dragon: Why the Energy Market Doesn’t Need China
2012-05-25 – Kris Sayce

China Stirs Up Troubled Waters in the South China Sea
2012-05-24 – Dan Denning

How Chinese Stocks Are Fading Fast
2012-05-23 – Lars Henriksson

LNG: Why Australia Will Be a New Global Gas Leader
2012-05-22 – Dr. Kent Moors

A Shocking Week for China’s Economy
2012-04-21 – Dr. Alex Cowie


Three Ways to Avoid the Next Facebook IPO Fiasco

This Top Trader Predicted the Month of Stock Market Carnage

By MoneyMorning.com.au

‘Sell in May and go away.’

It’s an old stock market saying. However, it’s mostly an American concept. The weather is warming up as summer approaches, and many traders in the Northern Hemisphere are winding up their portfolios so they can have a less stressful break.

However, this May was carnage…


Look at what happened in the global markets. The ASX 200 is down 8.5% in May, and the Dow Jones Industrial Average lost 6.3%. Not to be forgotten was the Aussie dollar, losing almost 6% and is now at 96.99 US cents. The economic indicator, copper, dropped 12% in the same time. And oil? Well, Brent Crude is down 15% since 1st May.

But there was one trader who prepared for it. Murray Dawes, editor of Slipstream Trader didn’t expect a small drop. He planned and positioned his subscribers for a drastic fall in the stock market…

On the 17th April he told his readers to get ready:

‘The market is now sitting just above some very important technical levels. From here I can see a chain reaction taking the market hundreds of points lower in a short amount of time.’

That was the first time Murray tried to short the stock market. Only to be ‘stopped out’ the next day when the market rallied!

Yet, Dawesy was still sure the stock market was ready to fall. He was sure his strategy was right. Instead of sitting out, he took a small loss, and then got ready for his next attack on the market. Selecting his short sells carefully, he was ready for the next fall.

He wasn’t afraid to get back in. In fact he took another shot at it on the 30th April…

Even after the market rallied when the Reserve Bank of Australia announced a 50 basis point cut, Slipstream Trader subscribers still held onto their short positions. And a good thing too. Since then, the ASX200 has fallen, and then fallen some more.

ASX200 – Down 379 Points Since 2 May 2012

ASX200 - Down 379 Points Since 2 May 2012

Source: CMC Markets

The ASX200 is now at the same level as December last year. Five months of gains gone in 31 days. The index fell 8.5% in May.

But the thing is, investors should be more accustomed to these wild swings than ever before.

Check out the chart below.

13 times in the past five years, the Aussie index has lost more than 300 points in less than a month.

ASX200 – 13 x 300 point dives in five years

ASX200 - 13 x 300 point dives in five years
Click here to enlarge

Source: Google Finance

And how many times did the same thing happen from 2000-2007? Once. September 11, 2001, the stock market was down 300 points in a day.

What does that tell you? Preparing for a severe downturn in the stock market is a necessity today. Sure, this makes investing difficult, but understanding that events like this happen regularly will help you position your portfolio.

Where do you start? Kris Sayce, editor of Australian Small-Cap Investigator has one strategy that he’s been suggesting to readers since last year.

Setting Up a Portfolio

Setting up a portfolio

Source: Australian Small-Cap Investigator

The idea is simple. Allocate most of your portfolio to less risky investments. And keep a little ‘punting money’ aside. Using only a small amount of cash for speculative investments means you’re less likely to hit the panic button and sell exactly at the wrong time.

But sometimes, no matter what, investors panic. So even when you’ve set up a very selective portfolio, it’s hard not to chase the stock market down.

Kris recommends using small-caps for punting money. But if you can devote the time to it, you could allocate some of your punting money to trading…

Murray warned readers of Slipstream Trader not react to the market and dump stocks just because they were taking a beating.

Last week he wrote: ‘…the great bulk of traders are watching the stock market like a hawk now and feeling on edge. That situation usually leads to larger volatility and ultimately trading mistakes if you aren’t careful.’

Long and Wrong

Selling just because a market is falling will lead to bad investment decisions.

As Murray said of investors who sell in the chaos, ‘Plenty of traders will be long, wrong and sweating on every downtick that the market makes, hoping against hope that it turns back up soon and makes them whole.’

On the last day of April, just before the stock market took a turn for the worse, Murray saw the May market carnage coming:

‘We have a couple of short positions ready to take advantage of [the ASX200] falling back below 4300. Of course, once we fall below that, more selling will come out of the woodwork. But 4200 is the real line in the sand. Anything under there is where the market will get belted. I really do like the set up.’

And as of last night, all Murray’s short trades were ‘in the money’. That’s trader speak for profitable.

Does that mean the stock market looks cheap and you should snap up a few bargains? Not at all. Without any government or central bank interference the chance of a rally to push the index above 4500 is, Murray says, ‘remote’.

If anything, right now it’s better to sit out market and wait for the next opportunity.

Murray’s convinced the Aussie index is moving into a long term downtrend. Meaning he expects the index to move downwards more often than up.

Murray’s been in this game for twenty years. He doesn’t let the markets rattle him. Where other people see a downturn, Murray sees an opportunity.

If you’d like to know where Murray sees the stock market heading click here to learn more.

Shae Smith
Editor, Money Weekend

The Most Important Story This Week…

Money Morning resource expert Dr. Alex Cowie said a while ago that he thought the best opportunities for investors were no longer in the big commodity markets, such as copper and coal. He said the opportunity would be in more “strategic” metals and minerals. These small and largely unknown stories can deliver big gains to investors who get in early before they become widely known. These aren’t something you hear about a lot in the mainstream – until after they deliver percentage returns in the hundreds.

Rare earths are an example from a few years ago. Mineral sands were another one. The good doctor might have just nailed the next one. In his latest issue he recommended a small explorer to take advantage of what might be the big investment story of 2012 – all in a time when the broader market is falling. See what he says himself in The Market Has Crashed, But This Graphite Stock Has More Than Doubled.

Other Recent Highlights…

Keith Fitz-Gerald on What Facebook Stock is Worth (At Best): “The company is only worth about $7.50 a share. And, no. That’s not a typo. There is no missing zero or a placeholder. That’s reality. What is ludicrous is that Morgan Stanley and Facebook executives thought the company merited a $104 billion valuation at 100 times earnings… So what should the numbers be?”

Dr. Alex Cowie on Why the Saudi’s Are Making Me Eat My Words About the Oil Price: “Expensive oil has a habit of causing recessions – so cheaper oil takes the pressure off slightly. But it’s bad news for investors in oil companies, because in the last few months stock prices have come off the boil. So what’s behind the sharp pullback in the oil price? And is the price set to fall further? Read on…”

Kris Sayce on Europe’s Energy Resource Puzzle: “The big theme in the April issue of Australian Small-Cap Investigator was Europe. To be precise, that if Europe is ever to recover economically, it must develop its own energy resources… Europe’s energy position is dire. And as the EU points out, it’s getting worse.”

Dr. Kent Moors on The Global “Texas Standoff” Over Iran Oil: “I keep going back to this issue, but it’s for one very simple reason. The rising tension between Tehran, on the one hand, and Washington and Brussels, on the other, is still the single most serious geopolitical element impacting the global oil market today. And now the matter is finally reaching a head.”

Kris Sayce on The US Dollar – The “Strongest of the Weak”: “The idea of risk is a very personal thing. What we see as risky, you may not. And what you see as risky, we may see as completely safe. One trick to successful investing isn’t to just figure out what you see as risky, but to also figure out whether other investors see it as risky too. If you can pull off that trick it can help you stay one step ahead of the crowd. More below…”


This Top Trader Predicted the Month of Stock Market Carnage

Monetary Policy Week in Review – 2 June 2012

By Central Bank News
The past week in monetary policy saw interest rate decisions announced by 8 central banks around the world.  Those that altered interest rates were: Brazil, cutting 50 basis points to a low of 8.50%; Denmark, trimming a further -15bps to 0.45%; and Uganda dropping -100bps to 20.00%.  Meanwhile the central banks that held interest rates unchanged were: Hungary 7.00%, Turkey 5.75%, Zambia 9.00%, Colombia 5.25%, and Israel 2.50%.  Elsewhere in monetary policy, the Central Bank of Egypt cut its RRR -200bps to 10 percent.


Looking at the central bank calendar, the week ahead is set to be a big one in terms of monetary policy meetings.  However the RBA is expected to hold fire at 3.75% this time, likewise the BOC is expected to hold at 1.00%, and the ECB and BoE are expected to hold at 1.00% and 0.50% respectively; and keep their asset purchase programs unchanged.  Of course this does not preclude them from taking action, as the economic and geopolitical backdrop arguably warrants action. Outside of the main central banks, the National Bank of Poland, Central Reserve Bank of Peru, and Banco de Mexico also meet to review monetary policy settings.

Jun-05
AUD
Australia
Reserve Bank of Australia
Jun-05
CAD
Canada
Bank of Canada
Jun-06
PLN
Poland
National Bank of Poland
Jun-06
EUR
Eurozone
European Central Bank
Jun-07
GBP
United Kingdom
Bank of England
Jun-07
PEN
Peru
Central Reserve Bank of Peru
Jun-08
MXN
Mexico
Banco de Mexico

Source: www.CentralBankNews.info

Article source: http://www.centralbanknews.info/2012/06/monetary-policy-week-in-review-2-june.html

Summer Trading: Utilities

By The Sizemore Letter

Utilities are the proverbial red-headed stepchild of stock market sectors. During bull markets (so the thinking goes), utilities tend to underperform more aggressive sectors like technology or industrials. But during a good market rout, utilities take a beating along with the rest.

How unloved are utilities?

As I wrote in a recent article, they were by far the most shunned sector by the large money managers interviewed by Barron’s (see chart). Fully 30% of the “big money” managers picked utilities as the worst performer of 2012, and barely 3% thought it would be the best. (On the flip side, more than 30% of the managers chose financials and technology to be the best-performing sectors, and technology had not a single manager who voted it worst).

As a contrarian trade alone, utilities would be interesting. After all, the sector has been known to take investors by surprise; during the 2003-07 bull market, utilities were one of top-performing sectors on a price basis, and this did not include the high and rising dividends enjoyed by investors during the period.

And this brings me to my primary rationale for liking the sector: In a world where 2% is a “good” yield on a 10-year bond, the 3.9% paid by the Select Sector Utilities SPDR (NYSE:$XLU) is attractive. It’s roughly double the dividend yield paid by the S&P 500. And unlike the interest paid by a bond, the dividends of XLU constituent companies have a history of rising over time (more on that in a moment).

While portfolio growth is essential to meeting your retirement needs, growth ultimately doesn’t pay the bills; but income does. Yes, you can sell off appreciated shares to meet current expenses, but that doesn’t work particularly well when the market is trading flat or down. Just ask investors who needed to sell their shares during the pits of the 2007-09 bear market and panic.

The problem for most investors is that their traditional sources of stable income — bonds and CDs — simply do not pay enough in this interest rate environment. This means finding a respectable current income often means accepting stock market risk.

Frankly, I’m OK with that. An investor who is comfortable holding a 30-year bond to maturity should be equally comfortable holding a solid dividend-paying stock. If income is your objective, the bends and twists of the stock market can be safely ignored — so long as you are reasonably sure that the dividend is safe.

Let’s take a look at some of XLU’s largest holdings, starting with Southern Company (NYSE:$SO). Southern, as its name might imply, serves electricity to much of the Old South. It is a diversified power company that generates electricity through coal, nuclear, oil and gas, and hydroelectric assets.

Southern also is a prolific dividend raiser. The company recently raised its quarterly dividend to 49 cents per share, up from 40.3 cents at the onset of the crisis in 2008 — an increase of more than 21%. That’s not bad, given that many companies were forced to slash their dividends in those volatile years. Southern currently yields 4.3%, which is substantially higher than what you will find in the bond market outside of junk. And whether or not we have a eurozone meltdown, that dividend is unlikely to be affected.

Another of XLU’s holdings worth noting is Duke Energy (NYSE:$DUK). Like Southern, Duke is based in the American South. And also like Southern, Duke was able to continue growing its dividend throughout the crisis years of 2008 and 2009 and beyond. Duke currently yields 4.6%.

If we managed to get a breakthrough in the ongoing European debt crisis, I would expect more speculative sectors to outperform. It will be “risk-on” season again, and defensive sectors like utilities will lag behind. But if the European crisis continues to drag on, you can bet investors will flock to conservative income-producing sectors, and utilities could easily be the best-performing sector for the next quarter and beyond.

This article was originally published on InvestorPlace as part of the “My Favorite Sector for the Summer” series.   Charles Lewis Sizemore, CFA, is the editor of the Sizemore Investment Letter, and the chief investment officer of investments firm Sizemore Capital Management. As of this writing, he did not hold a position in any of the aforementioned securities. Sign up for a FREE copy of his new special report: “Top 3 ETFs for Dividend-Hungry Investors.”

Stupid Crisis Acronyms

By The Sizemore Letter

The financial press is not particularly good at forecasting market moves or giving reliable investment advice.  In fact, it’s generally awful at both.  (It’s a structural flaw; markets are forward looking, anticipating what will happen, while journalism is backward looking, explaining after the fact what already has happend).

But if the financial press is truly good at anything, it would be coming up with pithy (yet meaningless) acronyms and abbreviations.

First, we had the “BRIC,” which was shorthand for Brazil, Russia, India and China. These were supposed to be the four emerging market growth dynamos that would power the world economy for the next decade and beyond.

Why not include, say, Mexico, Indonesia or Turkey? Mostly because the “BRICMIT” doesn’t sound as cool in marketing literature.

Lest you think I’m joking, I am completely serious. The only thing these four countries had in common when the term “BRIC” was coined was that their abbreviations made a word with a nice ring to it. (Of course, today they have disappointing rates of growth in common, but that is a topic best saved for another day.

Next, we had the “PIIGS,” consisting of Portugal, Ireland, Italy, Greece and Spain. These were the European countries hardest hit by the 2008 meltdown and subsequent sovereign debt crisis.

Unlike the BRICs, the PIIGS actually had quite a bit in common. They were all viewed as being sovereign risks due to high deficits, high debts, an insolvent banking sector, or some combination of the three.  Still, we are left to wonder whether the investor preoccupation with Eurozone contagion was exacerbated by handiness of the “PIIGS” acronym.  (Then again, Malta is quietly blowing up as well, dispite not having an “M” in “PIIGS.”)

And now we have the “Grexit,” or Greek exit from the Eurozone. It’s difficult to handicap the odds on whether or when Greece might be kicked out of the Eurozone, but I would not at all be surprised to pick up a copy of tomorrow’s Wall Street Journal and find out that it happened overnight.

Following on the heels of the Grexit is the “Squit,” courtesy of the Financial Times’ James Mackintosh.  Squit, naturally, is short for “Spain quitting the euro.”  Mr. Mackintosh might have been stretching a little on this one. 

“Spanic” is another lovely recent addition, short for “Spain panic.”

If you are still reading this, shame on you.  You really ought to make better use of your time. 

The best advice I can give you is to ignore stupid, trendy acronyms, or perhaps to use them as a contrarian indicator.  Focus on the opportunities (or risks) that are not covered in a cheesy catchphrase.  While Wall Street was busily rolling out BRIC ETFs and mutual funds for the investing masses, more nimble investors had already found more promising opportunities in the likes of Peru, Colombia, and Indonesia. 

The BRICs, thankfully, appear to be dead as an investment theme, and I suspect that by mid-summer most of the “PIIGS” hysteria will have passed as well.  We may or may not have a “Grexit,” and I really couldn’t care less either way. None of really matters. A year from now, there will be some new trendy acronym that no one has thought of yet.

Whatever it turns out to be, ignore it.  Your time is better spent rolling up your sleeves and researching promising companies. 


Inventory Turnover: The Metric That Predicted Qualcomm’s Earnings Warning

Article by Investment U

Someone in my office recently called me a finance geek. I was actually a little bit insulted. But then, as I started to write this column, I realized she spoke the truth.

You see, I enjoy looking over financial statements and seeing how the numbers interact with each other. I like to look for clues about what the future might hold.

And if there’s a surprise in earnings, I go back to previous quarters to figure out if I could have detected it earlier. It’s kind of like a big puzzle with lots of interconnecting parts that, once you understand them, give you a clear picture of the company and its prospects.

Today, I’m going to use one of the metrics we’ve discussed before to see if we could have predicted an earnings warning by Qualcomm (Nasdaq: QCOM).

That metric is inventory turnover – an often-overlooked measure that can tell you a lot about a company’s operations.

Inventory turnover is essentially how many times a company turns over its inventory in a quarter or a year, or how many times it sells through the products on it shelves.

I decided to look at Qualcomm’s inventory turnover because, although the company reported stellar quarterly results a number of weeks ago, it issued an earnings warning because it couldn’t keep up with demand due to a shortage from one of its vendors. Therefore, I assumed inventory turnover should have spiked.

Let’s see if it did…

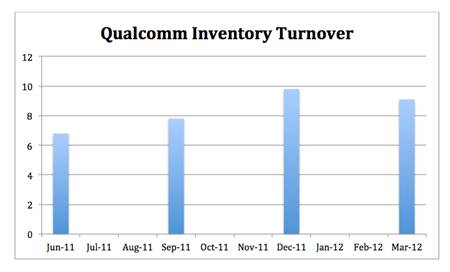
Over the last four quarters, Qualcomm’s inventory turnover climbed from 6.8 to 9.7. In other words, a year ago it was selling through its inventory 6.8 times per year. In December, it spiked to over nine, and in the most recent quarter the company was turning over its inventory 9.7 times per year.

Inventory Turnover: The Metric That Predicted Qualcomm's Earnings Warning

In fact, the inventory turnover is higher than it’s been since 2006.

Now, an earnings warning isn’t a positive, but not being able to keep up with demand is a good problem to have. I expect that Qualcomm’s earnings will be excellent once it gets its distribution issues straightened out.

Earnings per share popped in December and March, as well. Qualcomm earned $0.83 per share in December versus $0.61 in the previous quarter. More importantly, the higher inventory turnover may signify what’s going to happen in the next quarter.

In the September quarter, inventory turnover began to rise and we saw a pop in earnings in December. December’s inventory turnover rose sharply, and earnings in March were also strong.

With another quarter of high inventory turnover in March, I would expect a stronger June quarter in terms of earnings than Qualcomm is letting on.

Keep in mind – most companies give very conservative guidance. But even if June isn’t especially strong, I’d expect earnings to pick back up in the September quarter, as it’s clear that Qualcomm is moving product off its shelves at a rapid pace.

Like I always say, earnings can be and are manipulated to tell the story that management wants to tell.

Looking at inventory turnover can give you a strong idea as to how well a company is operating and what the future may be bring.

Good Investing,

Marc Lichtenfeld

Article by Investment U

Gold Jumps, Wipes Out Week’s Loss After Disappointing Nonfarms Report, But “Strong Dollar a Problem” as Trend “Remains Bearish”

London Gold Market Report
from Ben Traynor
BullionVault
Friday 1 June 2012, 09:00 EDT

U.S. DOLLAR prices to buy gold climbed back above $1600 an ounce on Friday, after disappointing US jobs data was then followed by news of a slowdown in American manufacturing activity.

The ISM Manufacturing Index fell to 53.5 in May, down from 54.8 a month earlier (a figure above 50 indicates an expansion in manufacturing activity).

The ISM release followed several examples of disappointing manufacturing data from around the world, with signs of slowdown in China and ongoing contraction in the UK and the Eurozone.

Friday afternoon’s London gold Fix was $1606 per ounce, the first Fix above $1600 since May 8.

Earlier in the day, gold spiked immediately after the release of worse-than-expected US nonfarm jobs data.

The US economy added 69,000 nonagricultural private sector jobs in May, according to official data published Friday, compared with analysts’ forecasts for 150,000.

The US unemployment rate meantime ticked higher to 8.2% – up from 8.1% in April.

Gold’s jump wiped out its losses for the week. By Friday afternoon in London, prices to buy gold looked set for a 0.6% gain on where they started the week.

Silver also spiked higher following the US jobs news, climbing to $28.63 per ounce, and headed for a slight gain on the week by Friday afternoon in London.

“The larger trend [however] remains bearish,” says technical analyst Russell Browne at bullion bank Scotia Mocatta.

A day earlier, gold’s final London Fix of May 2012 was down 5.6% on April’s last Fix – the third monthly fall in a row by gold Fix prices. Spot gold meantime – which back on February 29 fell by $100 an ounce after the PM Fix – ended May by making fourth straight monthly loss in Dollar terms.

By London Fix prices, gold has not fallen four months in a row since summer 1999.

In contrast with gold, European stock markets fell following the nonfarms release, extending their losses from Friday morning’s trading.

Earlier in the day, German 10-year Bund yields fell to a fresh all-time low below 1.15%, while on the currency markets the Euro sank to its lowest level against the Dollar since June 2010.

Spain’s banking system meantime saw €97 billion of capital leave the country in the first three months of 2012, according to figures published Thursday evening by the Spanish central bank. The Spanish government, which this week saw its implied 10-Year borrowing costs breach 6.7% for the first time since November, is trying to raise €19 billion to rescue nationalized lender Bankia.

The International Monetary Fund yesterday denied rumors that Spain’s government has approached it for a bailout.

Over in Ireland, votes were being counted Friday following yesterday’s referendum on whether or not to ratify the European Union’s new fiscal treaty, which would impose limits of government borrowing.

“We are very, very confident [of a ‘Yes’ vote],” said Lucinda Creighton, Ireland’s European affairs minister.

Press reports suggest around half of those eligible to vote in the referendum actually did so.

In Greece meantime, the biggest pro-bailout party New Democracy leads second place Syriza in the opinion polls, with just over a fortnight to go until the June 17 elections, news agency Bloomberg reports.

Syriza’s leader Alexis Tsipras said Friday that the bailout agreement is a failure, reiterating that Syriza would reverse some of the Greek government reforms if elected, including privatizations and cuts to public sector wages.

“The [bailout] memorandum equals a return to the Drachma,” Tsipras added.

The Eurozone’s purchasing manager’s index for manufacturing, a survey indicator of whether the sector is expanding or contracting, fell from 45.9 in April to 45.1 last month, figures published Friday show. A PMI above 50 indicates sector expansion.

Germany’s PMI meantime fell to 45.2 in May – down from 46.2 a month earlier.

The Eurozone’s unemployment rate meantime remained at 11.0%.

On the currency markets, the Euro fell to a two-year low against the Dollar Friday morning, remaining below $1.24.

European Central Bank president Mario Draghi warned Thursday that the current Eurozone structure is “unsustainable”.

“At the moment, Europe and downside risks to the Euro are the problem for gold,” says Michael Lewis, head of commodities research at Deutsche Bank.

“Dollar strength is going to be the big problem over the next few weeks.”

The US Dollar Index, which measures the currency’s strength against a basket of other currencies, hit its highest level since August 2010 this morning.

Here in the UK, manufacturing activity fell into contraction last month. May’s manufacturing PMI was 45.9, compared to 50.2 in April. The consensus forecast among analysts ahead of Friday’s PMI publication was for a figure just below 50.

The disappointing UK PMI figure “has increased dramatically the likelihood of the [Bank of England] announcing more quantitative easing next Thursday,” reckons Deutsche Bank’s chief UK economist George Buckley.

Manufacturing activity also slowed in China, the world’s largest source of demand to buy gold in the first three months of 2012.

May’s official PMI figure was 50.4, down from 53.3 in April. HSBC’s PMI meantime, which looks at smaller Chinese firms, showed ongoing manufacturing contraction, falling to 48.4 from 48.7.

In India meantime, traditionally the world’s biggest gold buying nation, gold demand for 2012 will fall by 4% by volume compared to last year – but will be 4% up in value terms – according to a report published by researchers at Morgan Stanley.

Ben Traynor
BullionVault

Gold value calculator   |   Buy gold online at live prices

Editor of Gold News, the analysis and investment research site from world-leading gold ownership service BullionVault, Ben Traynor was formerly editor of the Fleet Street Letter, the UK’s longest-running investment letter. A Cambridge economics graduate, he is a professional writer and editor with a specialist interest in monetary economics.

(c) BullionVault 2011

Please Note: This article is to inform your thinking, not lead it. Only you can decide the best place for your money, and any decision you make will put your money at risk. Information or data included here may have already been overtaken by events – and must be verified elsewhere – should you choose to act on it.


Markets Eagerly Awaiting US Non-Farm Payrolls

Source: ForexYard

The euro saw a mild upward correction during mid-day trading yesterday amid hopes that Ireland would ratify a euro-zone fiscal pact. That being said, the rally was short-lived and the EUR/USD was once again trading below 1.2400 by the afternoon session. Today, the US Non-Farm Payrolls figure is likely to be the highlight of the trading day. The all-important employment statistic has come in below expectations two-months in a row. Should today’s news again disappoint, the USD could extend its recent bearish trend against the safe-haven Japanese yen to close out the week.

Economic News

USD – Disappointing US News Turns USD/JPY Bearish

While the US dollar was able to maintain its recent gains against riskier currencies like the EUR and AUD during European trading yesterday, it was not as fortunate vs. the Japanese yen. A disappointing ADP Non-Farm Employment Change figure caused the USD/JPY to drop as low as 78.54 during the afternoon session. Overall, the pair fell more than 35 pips for the day. Against the AUD, the dollar fell some 70 pips during morning trading. That being said, the AUD/USD reversed its upward trend later in the day, and was once again trading around the 0.9740 level by the afternoon session.

Today, traders will want to pay close attention to the US Non-Farm Payrolls figure, set to be released at 12:30 GMT. While analysts are predicting that the figure increased over last month’s result, traders should be warned that the employment statistic is notoriously difficult to predict. The dollar could see additional losses against the JPY to close out the week if the Non-Farm figure comes in below the forecasted 151K. At the same time, should today’s news come in higher than predicted, the dollar could see substantial gains throughout the rest of the day.

EUR – Positive Euro-Zone News Gives EUR Temporary Boost

The euro saw temporary gains during the first half of yesterday’s trading session following the release of Greek polls that indicated gains for pro-austerity political parties ahead of elections later this month. That being said, concerns regarding the Spanish banking sector caused the common-currency to reverse its upward trend later in the day. Against the JPY, the euro advanced over 60 pips, reaching as high as 98.00, before turning downward and dropping to 97.15 by the afternoon session. Against the USD, the euro was up close to 70 pips before dropping within reach of a recent two-year low.

Today, any new announcements regarding the economic turmoil in Spain are likely to generate market volatility for euro pairs. Analysts are warning that the markets are still overwhelmingly bearish toward the euro, meaning that the currency is unlikely to see meaningful gains in the near future. Additionally, traders will also want to pay attention to the US Non-Farm Payrolls figure. Should the figure come in below expectations, investors may choose to place their funds with safe-haven assets which could lead to additional losses for the euro before markets close for the week.

AUD – Aussie Resumes Bearish Trend

The aussie was unable to sustain early morning gains against the US dollar and Japanese yen yesterday, and was once again moving downward by the afternoon session. The AUD/USD was up close to 70 pips during the first part of the day, reaching as high as 0.9759 before staging a bearish correction which brought it down to 0.9700. The AUD/JPY staged a downward correction after peaking at 76.95 and eventually fell as low as 76.10.

Today, any negative news out of the euro-zone is likely to weigh down on the AUD before markets close for the week. Furthermore, the US Non-Farm Payrolls figure has the potential to create additional risk aversion in the market place if it comes in below the expected 151K. Should the US news disappoint, the aussie could fall further against its safe-haven rivals.

Crude Oil – Risk Aversion Sends Crude Oil Tumbling

The price of crude oil fell during afternoon trading yesterday, as euro-zone worries combined with disappointing US indicators caused investors to shift their funds to safe-haven assets. In addition, decreased demand for oil was highlighted by US stockpiles, which are currently near a 22-year high. The price of crude fell as low as $86.50 a barrel, down almost $1.70 for the day.

Turning to today, the price of oil could see additional losses if the US Non-Farm Payrolls figure comes in below expectations and investors continue to shift their funds to safe-haven assets. Traders will want to pay attention to the EUR/USD. Should the pair continue its bearish trend, it may be a sign that the price of oil will go down as well.

Technical News

EUR/USD

A bullish cross on the daily chart’s Slow Stochastic indicates that this pair could see an upward correction in the near future. This theory is supported by the weekly chart’s Williams Percent Range, which has dropped into oversold territory. Opening long positions may be the wise choice for this pair.

GBP/USD

Long-term technical indicators are providing mixed signals for this pair. On the one hand, the weekly chart’s MACD/OsMA has formed a bearish cross, meaning downward movement could occur in the coming days. That being said, the same chart’s Williams Percent Range has dropped into oversold territory. Taking a wait-and-see approach may be the wise choice for this pair.

USD/JPY

While the Williams Percent Range on the weekly chart has dropped into oversold territory, most other technical indicators show this pair trading in neutral territory. Traders may want to take a wait-and-see approach, as a clearer picture is likely to present itself in the coming days.

USD/CHF

The Relative Strength Index on the daily chart has crossed over into the overbought zone, indicating that this pair could see downward movement in the near future. Furthermore, the weekly chart’s MACD/OsMA has formed a bearish cross. Opening short positions may be the right move for this pair.

The Wild Card

NZD/CHF

A bearish cross on the daily chart’s Slow Stochastic indicates that a downward correction could occur in the near future. This theory is supported by Williams Percent Range on the same chart, which has crossed into overbought territory. Forex traders may want to go short in their positions ahead of a possible bearish reversal.

Forex Market Analysis provided by ForexYard.

© 2006 by FxYard Ltd

Disclaimer: Trading Foreign Exchange carries a high level of risk and may not be suitable for all investors. There is a possibility that you could sustain a loss of all of your investment and therefore you should not invest money that you cannot afford to lose. You should be aware of all the risks associated with Foreign Exchange trading.


Market Review 1.6.12

Source: ForexYard

printprofile

The EUR/USD dropped to its lowest level since July of 2010 at 1.2323 in overnight trading. Investor concerns that the Bank of Japan will intervene in the markets to weaken the yen caused the USD/JPY to come off a recent 3 ½ month low. The pair is currently trading at 78.42.

Main News for Today

UK Manufacturing PMI- 08:30 GMT
• The pound has taken heavy losses against the dollar, yen and euro lately
• Analysts are predicting today’s news to come in at 49.7, which would mean that the British manufacturing industry contracted last month
• If the news comes in as expected, the pound could see additional losses to close out the week

US Non-Farm Employment Change- 12:30 GMT
• Considered the most important economic indicator on the forex calendar
• The last two months have both come in below expectations and have led to dollar losses
• Should today’s news again disappoint, the dollar could drop against the yen

Forex Market Analysis provided by ForexYard.

© 2006 by FxYard Ltd

Disclaimer: Trading Foreign Exchange carries a high level of risk and may not be suitable for all investors. There is a possibility that you could sustain a loss of all of your investment and therefore you should not invest money that you cannot afford to lose. You should be aware of all the risks associated with Foreign Exchange trading.