Optimism over global recovery evaporates, emerging economies bright spot – BIS

By Central Bank News
A brief spurt of optimism over the global economic recovery has now evaporated and volatility has returned to financial markets as investors question the prospects for economic growth, the Bank for International Settlements said.

    “Investors are having doubts about everything: About growth, about the financial health of sovereigns and about political stability,” said Stephen Cecchetti, economic adviser to the Swiss-based BIS, known as the central bankers’ bank.

    “News on economic growth has been disappointing not only in the euro area, but also in the United States and in emerging market economies,” he told reporters in a telephone briefing as the BIS released its latest quarterly review.

    Stock markets tumbled on Friday as data showed that the pace of U.S. employment growth weakened, output from China’s factories slowed and Europe’s manufacturing sector continued to contract.

    But emerging economies, the engines of global growth in recent years, could provide a beacon of hope for some of Europe’s beleaguered countries, such as Greece and Spain.

    “There is good news here, emerging market economies used to have problems similar to those of the euro area periphery today; that is they had a lack of credibility that often forced them to tighten policies during downswings, thus putting further pressure on output, Cecchetti said.

    Over the last decade many emerging economies have been able to carry out more mature fiscal and monetary policies that helped cushion downturns, similar to the more advanced economies, helping stabilize the global economy, the BIS said.

    In it’s review — which shows that cross-border lending fell in the final 2011 quarter as euro area banks continued to retrench — BIS also looked at the countercyclical policies of emerging markets, the changing role of the offshore Chinese renminbi market and the threats from the growth of central bank balance sheets in emerging Asian economies.

    Cross-border lending by major international banks recorded its largest decline in the fourth quarter of 2011 since the final quarter of 2008, following the collapse of Lehman Brothers, BIS said.

    The decrease of $799 billion, or 2.5 percent, was driven mainly by a $637 billion fall in interbank lending as international banks cut back in their lending to euro area banks.

    But even though market conditions remain difficult for a number of banks from Southern Europe, it is a far cry from 2008 when major banking relationships collapsed and central banks scrambled to prevent markets from freezing up.

    Following the European Central Bank’s long-term financing operations in December, which restored confidence and helped avert a bank funding crises, Europe’s banks returned to the markets.

    In the first quarter of 2012, global gross issuance of international debt securities rose 40 percent to $2.5 trillion, the strongest since the second quarter of 2008, with European borrowers the most active.

     The BIS review covers the three months from March through May, a period that started out on an optimistic note following the ECB’s move and positive U.S. economic news.

    But optimism in financial markets began to evaporate in the second half of March as it became clear that monetary policy alone would not solve the euro area’s debt problems. The first signs of weaker economic data from the US and China also cast doubts over the strength of the global economic recovery, prompting investors to reconsider the strength of growth in emerging markets.

    With government debt continuing to expand in most advanced economies, BIS’ Cecchetti called on politicians to get to the root of the problems and tackle such thorny issues as unfunded social insurance schemes and healthcare.

    “The challenges that we are facing are structural and require structural solutions. Short-term fixes will not work unless authorities address the underlying problems and the various problems are intertwined. For example, the solvency of banks and sovereigns are closely linked, so they need to be addressed simultaneously,” he said.

Europe Reaching the Boiling Point: How to Invest

By The Sizemore Letter

“Sell in May, go away” would have been good advice in 2012, although “Sell in March” would have been better. For a year that started with one of the best first quarters in history, the second quarter has proven to be something of a disappointment.

On the first trading day of June, the U.S. averages had their worst performance of 2012, pushing the Dow Industrials into negative territory for the year. The S&P 500 is still positive for the year…albeit barely.

Interestingly, Spanish stocks—which have been at the center of the European financial crisis that has been roiling the markets—finished the day roughly flat. Sizemore Capital continues to allocate funds to select Spanish stocks, and the relative calm in the Spanish market gives us hope that much of the selling there has already been done. Spain is home to some of the world’s finest multi-national companies, and the state of crisis has created absolute steals that we may not see again in our lifetimes.

The Sizemore Investment Letter Portfolio holds positions in Telefonica (NYSE:$TEF) and Banco Santander (NYSE:$STD) and has additionally sold out-of-the-money puts on both. (See “How to Keep Your Cool While Investing in Europe” for more details on our put strategy.) Additionally, the Tactical ETF Portfolio holds a position in the iShares MSCI Spain Index ETF (NYSE:$EWP).

More than even bad news, markets hate uncertainty. And the uncertainly about the Eurozone’s future has wreaked absolute havoc on Spanish and European shares.

Spain’s effective nationalization of the ailing Bankia—the country’s third largest bank by deposits—had precisely the opposite effect of what you might have expected. Rather than cheer the fact that the Spanish government is taking the crisis seriously, it simply raised new questions about the Spanish state’s ability to afford the bailout of its banking sector.

The way forward is becoming increasingly obvious. As The Economist wrote this week, “Spain’s problem is one of misdiagnosis.”

The focus of the Spanish government and of the broader European Union (and particularly Germany) has been austerity. The thinking is that budget deficits must be slashed in order to restore investor confidence. The case of the United States—where both debts and deficits are higher than in many of the EU’s problem states—proves that this is not entirely true. After all, the yield on the 10-year Treasury note recently hit levels not seen since World War II.

As The Economist continues,

“This fiscal focus gets things exactly backwards. Spain’s poor public finances, unlike those of Greece, are a symptom rather than the cause of the country’s economic woes. Before the crisis Spain was well within the euro zone’s fiscal rules. Even now its government debt, at around 70% of GDP, is lower than Germany’s.”

In Spain, it is all about the banks. Outside of Santandar and Banco Bilbao Vizcaya Argentaria (NYSE:$BBVA), Spain’s banks are by and large insolvent and in need of recapitalization.

Again, using The Economist’s figures, a recapitalization of €100 billion would be roughly 10% of Spain’s GDP. Borrowing this amount would still leave Spain safely below the debt-to-GDP levels of the United States, but the country would have to pay punishingly high rates of interest given current market conditions.

On a side note, the Financial Times estimates the cost of a banking bailout to be much smaller. The FT points out that roughly 11% of Spanish bank loans are non-performing, which is less than half the level of Ireland, the country whose predicament most closely matches that of Spain. At 350% of GDP, Spain’s banking assets are large by world standards, but again, less than half the levels of Ireland.

What is the most likely solution? The budding consensus would seem to be using EU rescue funds to inject capital into the banks directly, which Spain is now advocating.

Currently, this is not legal under EU rules. But as the last year and half of on-again / off-again crisis has proven, EU rules are a bit of a work in process.

In any event, the next week promises to be anything if not interesting. Mariano Rajoy, Spain’s prime minister, publicly announced support for EU oversight of national budgets, apparently in an attempt to sweet talk German chancellor Angela Merkel. Separately, the European Central Bank indicated over the weekend that it was “prepared” to intervene with bond purchases or additional bank assistance if needed. And encouragingly, late last week, the EU announced that it would be lenient in allowing Spain another year to get its budget deficits under control.

What does all of this mean to us as investors? In investing, as in many of life’s endeavors, it is always darkest just before the light. And it would appear that we’re starting to see a sunrise in Europe. Sizemore Capital will look for opportunities in the weeks ahead to profit from the resolution of Europe’s crisis.

 This article was originally published as Sizemore Capital’s monthly market commentary for Covestor.

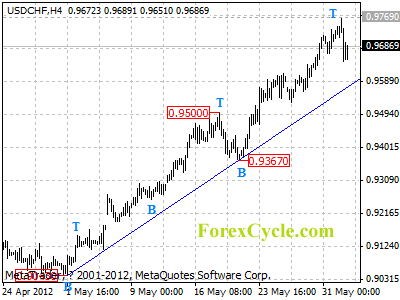
USDCHF has formed a cycle top at 0.9769

USDCHF has formed a cycle top at 0.9769 on 4-hour chart. Key support is a the upward trend line from 0.9043 to 0.9367, as long as the trend line support holds, the fall from 0.9769 is treated as consolidation of the uptrend, and one more rise towards 1.0000 is still possible. On the downside, a clear break below the trend line could indicate that the uptrend has completed at 0.9769 already, then the following downward movement could bring price back to 0.9200 zone.

usdchf

Forex Technical Analysis

BIS WARNS OF RISKS FROM ASIA’S LARGE FOREIGN RESERVES

By Central Bank News
The rapid expansion of foreign reserves, mainly U.S. dollars, by central banks in emerging Asian economies raises the risk of inflation, financial instability and market distortions, a study by the BIS said.

    Following the financial crises in the late 1990s, many Asian central banks bolstered their foreign exchange reserves to ward off future runs on their currencies. The combined balance sheets of nine Asian central banks, including China, ballooned to $6.4 trillion in 2011 from $1.1 trillion in 2001.

     So far, the rapid rise in foreign reserves has not triggered any instability, but the Bank for International Settlements warned that the risk to financial stability must not be underestimated.

    “The rapid expansion of central bank balance sheets arising from many years of foreign exchange reserve accumulation in emerging Asia is raising concerns about inflation, financial instability and financial market distortions,” the BIS said, calling on governments and central banks to consider altering their policies.

     “The approach to exchange rate management by countries in emerging Asia is a critical factor, and various reform efforts are currently being considered. Although such efforts are largely driven by the implications of exchange rate management for global imbalances and growth, the risks associated with the size and structure of central bank balance sheets should not be overlooked,” BIS said.

OFFSHORE RENMINBI LIKELY TO FOLLOW IN EURODOLLAR FOOTSTEPS-BIS

By Central Bank News
The offshore market for China’s renminbi currency is likely to develop into a fully-fledged intermediary between non-Chinese borrowers and lenders, much like the eurodollar market, the Bank for International Settlements said.

    “The current role of the offshore renminbi market as a conduit of funds from the rest of the world to the mainland may not be its last role. Over time, the renminbi offshore market is likely to play above all the role of intermediary between non-mainland borrowers and lenders,” the BIS said in a special feature in its June quarterly review.

     BIS examined the 38-year history of the eurodollar market for clues to the future of the offshore renminbi market, with the study raising doubts over claims that international use of the renminbi requires China to run a current account deficit. It also suggests that one-way speculative positioning, taken by some critics as the main impetus for international use of the renminbi, will prove to be temporary.

    China is taking steps to internationalise the role of the renminbi, with London and Singapore attempting to compete with Hong Kong as the main offshore center for renminbi trading.

Telefonica: Latin American Growth, Crisis Prices

By The Sizemore Letter

“Buy low and sell high” is the standard advice of any value investor. It can also be remarkably hard to put into practice.

You see, we humans are herd animals, and we tend to think and act as groups, particularly during times of stress. Call it the primal human instinct to seek strength in numbers.

Unfortunately, while this instinct may ensure our survival during times of war or natural disaster, it handicaps us as investors. When we see others panicking we too sell in fear or stand paralyzed in indecision at exactly the time we should be buying with both fists.

All of this is a lengthy introduction to the subject of this article, Spanish telecom giant Telefonica (NYSE:TEF).

Telefonica has had a rough year. The price of its U.S.-listed ADR are down nearly 70% from their pre-2008 highs. The domestically-traded shares have fared slightly better do to the lack of currency movements, but results have been dismal nonetheless.

Spain’s crisis has become Telefonica’s crisis. As the most liquid stock in the Spanish stock market, Telefonica has become a proverbial punching bag and an outlet for traders wanting to short the embattled Eurozone country.

This article was published on GuruFocus.  To read the full article, please see The Case for Telefonica.

EMERGING MARKETS NOW ABLE TO COUNTER DOWNTURNS – BIS

By Central Bank News
Most emerging market economies have successfully carried out countercyclical policies in the last decade, similar to advanced economies, contributing to the stability of the global economy, a study by the BIS said.

    In the past, monetary policy in many emerging economies was handcuffed by expansionary fiscal policy in economic upswings – known as fiscal dominance — leaving little scope for policy easing during downturns.

    “However, the era of fiscal dominance appears to have ended in most EMEs,” said the Bank for International Settlements in its June quarterly review, adding that emerging economies relied on both fiscal and monetary policy to lean more heavily against the business cycle.

    But the BIS also cautioned that the example of crises-hit euro area countries, which pursued countercyclical policies in the past decade, shows that authorities can never become complacent and policies must be monitored continuously.

    “Countercyclicality is a necessary but not a sufficient condition for sound macroeconomic policy,” the BIS said.

Read more at the BIS: www.bis.org/publ/qtrpdf/r_qt1206.htm

www.CentralBankNews.info

Investing in Rare Earth Metals

Article by Investment U

Investing in Rare Earth Metals: The Time is Now

Play the upcoming rise in rare earth metals with rare earth stocks and ETFs. And don't forget your trailing stops.

I just published a 50-page special report on China aimed at institutional investors. An Inconvenient Truth About China: Severn Troubling Trends describes how its semi-market state capitalism model is in need of significant reform.

But no matter what happens with China’s economy, one truth will remain. The country has a lot of leverage over rare earth production and prices. It produces 90% and controls 95% of the export market for the 17 metals considered “rare earths.”

This is a big deal because many emerging industries rely on these rare earth metals and elements. A Toyota Prius contains about 10 pounds of lanthanum. Smartphones, tablets, night vision goggles, jet engines, giant wind turbines, GPS, fiber optics and missiles are just a few other examples.

China made headlines in late 2010 when it suspended exports to Japan as negotiating leverage during a territorial dispute with Japan. The tactics led to alarm and a surge in rare earth metals and stocks through the summer of 2011.

Since then, you may have noticed that rare earths have largely disappeared from headlines and stock prices have come back to earth. Meanwhile, the industrial uses of these elements has increased, while there are also indications that the high prices during 2011 led to a ramp-up of mining activity.

Take Advantage of the Pullback

Weighing all this, I believe it’s time to take advantage of this sharp pullback and make a value-driven move on rare earth stocks. My top pick is Denver-based Molycorp (NYSE: MCP), whose stock is down 66% in the last year.

Molycorp, founded in 1946, mines rare earth minerals and elements at its fully integrated mine in California and runs processing facilities in Arizona and Estonia. In addition to producing rare earth oxides at its rare earth mine and processing facility at Mountain Pass, California, the company produces rare earth metals, rare earth alloys (such as neodymium iron boron and samarium cobalt alloys) and rare metals such as niobium and tantalum.

In 2011, the company announced a partnership to produce high tech magnets in Japan. A bigger deal was the acquisition of rare earth producer Neo Material Technologies for $1.3 billion announced in March of 2012. This deal is significant because the 2011 results of the combined companies on a pro forma basis show a tripling of revenue and gross profits, while the holding of Molycorp shareholders will be diluted by only about 15%.

Looking forward, the combined Molycorp and Neo Materials is forecast to produce $1 billion of revenue and $3.80 per share of net income in 2013 when the merger is fully completed. If the combined enterprise gets into the ballpark of these projections, the impact on its share price should be sizable.

It was during 2011 that Molycorp’s rare earth business exploded with revenue, going from $35 million in 2010 to $362 million leading to an EPS of $1.27. The company also posted a solid first quarter in 2012, marginally beating consensus earnings per share estimates with quarterly revenue up 222.5% year over year.

The combination of the sharp pullback in share price, the acquisition of Neo Material Technologies and the recent reassuring earnings report are all catalysts pointing to a sharp rebound for Molycorp. I have also noticed an uptrend for the stock since the earnings were released.

If you prefer a broader shotgun approach, take a look at the Market Vectors Rare Earth/Strategic Metals (NYSE: REMX). It’s a basket of 30 companies from around the world that are engaged in mining, refining and manufacturing of rare earth strategic metals.

This ETF offers a 5.4% dividend yield, and roughly 60% of its holdings are small and mid-cap stocks from all over the world – but mainly concentrated in the United States and Australia. Surprisingly, only 10% are based in China. Launched in late October 2010, it caught some of the rare metal surge through the summer of 2011, but ended up down 39% for the year.

Though you should expect some volatility, I recommend pairing a small stake in MCP and REMX to take advantage of their out of favor status while you have the chance.

Good Investing,

Carl Delfeld

P.S. In today’s Investment U Plus edition, I tell readers about a company that is using rare earths to bring about huge productivity increases in Chinese factories. It’s a solid long-term investment, but not something I’d recommend to traders or short-term investors.

For more information on accessing today’s stock recommendation, click here.

Article by Investment U

Investing in the Rise of Natural Gas Vehicles (GM, F, HTZ)

Article by Investment U

Investing in the Rise of Natural Gas Vehicles (GM, F, HTZ)

GM, Ford (F), and Hertz (HTZ) are betting big on natural gas vehicles. Are CLNE and WPRT the best way to play natural gas in 2012?

Living in South Florida has its perks.

And my absolute favorite is that I’m just an hour away from basking in the Florida Keys.

In fact, just a couple of weeks ago, my wife and I drove down and spent the weekend at Bahia Honda State Park (approximately 35 miles north of Key West).

The weather, the water, the camping, almost everything about it was perfect.

But, even in paradise, there was one thing I had trouble getting over. Gas prices down there are truly outrageous.

We paid $4.25 per gallon to fill up our car in Marathon Key. I even overheard boaters complain how they paid over $5 per gallon at some of the local marinas.

I think it’s safe to say most Americans sense these prices are heading inland no matter how much we don’t want them to. History shows they’ve risen steadily since the mid-1970s.

Wouldn’t it be incredible, though, if there was a way to pay closer to $1 for a gallon of gas instead of the high prices we do today?

Of course it would. And we can. But we must get serious about taking advantage of alternative fuel sources like natural gas.

The Case for More Natural Gas Vehicles

According to Popular Mechanics, “Nationwide, natural gas ranges from 79 cents to $1.50 for a gasoline gallon equivalent (GGE) of fuel.”

Let’s say your car has a 15-gallon fuel tank. If you were to fill it up once a week at $1 per gallon with compressed natural gas (CNG), you would save over $2,000 per year with gas prices averaging $3.75 per gallon around the country.

Savings like these are getting impossible to ignore. And car companies are increasingly taking action.

GM (NYSE: GM) announced the 2013 GMC Sierra and Chevy Silverado will have a bi-fuel option that can switch between running on compressed natural gas (CNG) and gasoline.

Ford (NYSE: F) and Chrysler also said they’ll be ramping up production on their bi-fuel trucks over the coming years.

Even car rental company Hertz (NYSE: HTZ) just stated it will begin renting CNG Honda Civics and CNG GMC Yukons at its Will Rogers World Airport location in Oklahoma City early next month.

In Europe, with gas prices close to $10 per gallon, the trend is catching on even faster.

Just a few days ago, Fiat (Milan: F.MI), Italy’s largest auto manufacturer, emphasized it’s bypassing electric cars and will focus on CNG as its “go-to” alternative fuel for at least the rest of this decade.

A little over a week ago, Volvo Trucks unveiled plans to launch a 13-liter natural gas engine schedule to hit the North American market in 2014.

Of course, the biggest problem around the world for natural gas-powered vehicles is the lack of infrastructure.

Playing the Trend

In the United States, there are only 1,000 CNG refueling stations. And most of them aren’t even available to the public. In Europe, that number is closer to the 2,000 mark.

This is obviously where we’ll need to see the most growth in order to make natural gas-powered vehicles a viable alternative to cars that strictly run on gasoline.

That’s why, for investors, the best place to cash in on the natural gas vehicle market today isn’t in the car companies themselves. It’s in firms that are building refueling stations like Clean Energy Fuels Corp. (Nasdaq: CLNE) and cheaply converting gasoline engines to run on natural gas like Westport Innovations (Nasdaq: WPRT).

Earlier this year, Dave Fessler gave his Peak Energy Strategist subscribers the chance for a 77% gain on Westport. Since hitting its peak in April, the stock has been battered down heavily with the majority of natural gas stocks… (Thank goodness for trailing stops.)

Meanwhile, Clean Energy Fuels Corp. has been up as much as 174% in the past year.

This is proof that even though the natural gas market is currently hitting the skids, there are still ways to cash in on the low prices and poor sentiment. Just ask Alexander Green…

Good Investing,

Mike Kapsch

P.S. I mentioned the importance of trailing stops, and I strongly believe that it should be a crucial part of your investment strategy. Cutting your losses and letting your winners ride is of the utmost importance.

But it’s not enough. To build wealth consistently, you need the right asset allocation, position-sizing, and smart tax management.

To learn more about the fundamental principles of wealth building, I invite you to read our free white paper report, How to Build Wealth.

Article by Investment U

A Bit More on Expectations in Trading

By Taro Hideyoshi

The expectations is one of the aspects traders should take into their consideration when trading. I have mentioned to expectations many in many of my articles. In this article, we will dig a bit deeper in order to paint clearer picture in this topic.

The question “How much do you expect to earn on each trade on average over the long run from your trading system or method?” is a good one to describe what the expectation is in trading.

Of course, no one expects to lose. Therefore, the first thing you have to make sure is the system you are using must have a positive expectation. If your system has the positive expectation, it will ultimately generate you profits if you keep trading by it over enough time.

The following equation is a mathematical equation for positive expectation. The higher result, the more positive expectation you have.

E = (1 + (W / L)) x P – 1

Where:
E = Expectation
W = How much you gain when you win
L = How much you loss when you lose
P = Probability of winning

According to the equation, you will see that it does not only depend on percentage of winning trades but also the amount you gain from winning trades.

For example, assume a trading system has 50% wining trades. Now, assume the average winning trade is $500 and the average losing trade is $350.

E = (1 + (500/350)) x 0.5 – 1 = 0.214

For comparison, let considers another trading system that has only 40% winning trades with an average winner of $1,000 and average loser of $350.

E = (1 + (1,000/350)) x 0.4 – 1 = 0.543

The second trading system’s positive expectation is 2.5 times that of the first although it has much lower percentage of winning trades.

Let’s take a look in another aspect. The following equation is a mathematics equation mentioned in the book “The Complete Turtle Trader” by “Michael W. Covel”.
The equation calculates the expected value from trades.

E = (PW x AW) – (PL x AL)

Where:
E = Expected value
PW = Winning percent
AW = Average winner
PL = Losing percent
AL = Average loser

From the above example, the expected value from the first trading system will be as follow.

E = (0.5 x 500) – (0.5 x 350) = $75 on average per gain per trade

Also for the comparison, the expected value from the second trading system will be as follow.

E = (0.4 x 1,000) – (0.6 x 350) = $190 on average per gain per trade

Do you get a clearer picture of the expectations in trading now? Hopefully, you do.

About the Author

Taro is an experience trader who trades in stocks, futures, forex. He strongly focuses on technical analysis, trading systems and money management.

If you would like to find more articles on MetaStock Tutorials, MetaStock Formulas, Trading Systems and Money Management. Please go to MetaStock Trading System.

You would also find the list of recommended books for trading & investing at The Investing Books.