Investing in Israel’s Epic Oil and Gas Boom

Article by Investment U

When I think of Middle Eastern nations with massive oil and gas reserves, Israel isn’t a country that comes to mind… ever, really.

After all, Israel still imports 99% of its oil and 70% of its natural gas.

In fact, for the last 60 years, energy companies there have basically drilled one dry hole after the next.

But that’s all getting ready to change in the coming years thanks to new drilling capabilities.

And Israel is set to shake up the energy landscape in the Middle East like no one has ever seen before.

Israel: An Energy Giant in the Making?

Last week, Israel Opportunity Energy Resources LP discovered an offshore oil and gas field with an estimated 1.4 billion barrels of oil and 6.7 trillion cubic feet of natural gas.

According to the company’s Chairman, Ronny Halman, “The quantity of gas discovered… makes it the third-largest offshore discovery to date.”

It follows last June’s announcement of uncovering 16 trillion cubic feet of natural gas and 800 million barrels of oil in Israel’s Tamar and Leviathan offshore fields.

Yet, for Israel, these discoveries are only the beginning. And investors should pay close attention.

That’s because Israel’s largest oil and gas opportunities aren’t offshore. They’re on land in the nation’s shale deposits.

As The Wall Street Journal reports, “The World Energy Council estimates Israel’s shale deposits, located some 30 miles southwest of Jerusalem, could ultimately yield as many as 250 billion barrels of oil.”

To put this into perspective, Israel could soon be the world’s third-largest nation in terms of proven oil reserves… behind Venezuela – which took the top spot last year – and Saudi Arabia.

To get an idea of the scope of these massive reserves, it would potentially be enough to cover the United States’ entire oil needs for the next 35 years.

Of course, not everything is hunky-dory. The biggest problem Israel faces right now is that the country isn’t prepared to handle such a dramatic increase in oil and gas production.

Translation: This is no short-term play.

But there are a number of ways to potentially cash in as Israel works to become one of the world’s leading energy providers… that is, if you can stand to wait.

Stocks and ETFs

The safe way to play Israel’s oil and gas boom is the iShares MSCI Israel Capped Investable Market Index Fund (NYSE: EIS).

That’s because, with such massive discoveries there, Israel’s entire economy is set to prosper for several years as it ramps up its oil and gas exports and slashes its imports.

EIS is designed to capture this overall growth by mimicking Israel’s broad-based equity market performance.

And, the best part, this ETF is likely trading at a hefty discount.

You see, one thing to watch for in ETFs is the fund’s net asset value, or NAV.

Typically, when a fund’s share price is trading for more than the NAV, it’s trading at a premium. When the price is less than the NAV, it’s trading at a discount.

In my experience, the best time to buy an ETF is when the share price trades at a discount of 20% or more to the NAV.

As I write, EIS is trading at $36.39 and its NAV is at 55.98. By this measure, that means EIS is currently trading at a 34% discount.

But there’s another play to keep on your watch list, as well

The company is called Genie Energy Ltd. (NYSE: GNE), a spin-off of IDT Corporation (NYSE: IDT).

Not many investors know this, but when it comes to Israel, Genie has an 89% interest in a private oil and gas drilling company out of Jerusalem called Israel Energy Initiatives (IEI).

IEI already holds the rights to a shale deposit in Israel that could contain as much as 40 billion barrels of oil.

This puts Genie in a perfect position to ride Israel’s oil and gas boom all the way to the bank. And for a company with a market cap of just $180 million, the sky really is the limit.

In terms of energy, over the next 10 years we’re going to see changes take place in the Middle East like we’ve never experienced before.

Just by preparing today for these changes, you could find yourself sitting on a windfall of gains in the not-too-distant future.

Good Investing,

Mike Kapsch

Article by Investment U
The Safest Way to Invest in Commodities

Article by Investment U

I’ll never forget my first visit as a teenager to the commodity trading pit of Chicago’s Mercantile Exchange (CME). The swirling bright-colored jackets, the shouting and rapid hand signals (looked like arm wrestling to me) was captivating and reminded me of past family gatherings.

It was also the polar opposite of my later visit to the currency trading floor of JP Morgan at 1 Wall Street – row after row of white shirts hunched over computer screens and dry IMF statistics.

Commodities sure looked like more fun to me.

My image of commodity markets hasn’t changed all that much since. It’s a volatile and wild ride where even a tiny bit of new information affecting supply or demand can send prices spinning. Weather, transportation costs, economic forecasts, currency movements and many other factors go into how prices change minute to minute.

I approach commodities trading cautiously since expert traders focused all day on one commodity, such as wheat, get it wrong as often as they get it right.

Still, I have to admit, the idea of making or losing a pile of money in a very short time gets my blood pumping.

So how should you approach commodities and what should you do right now?

The Game Has Changed

Even a decade ago, most individual investors didn’t think of investing in commodities except through companies like Alcoa (NYSE: AA) for aluminum, Freeport-McMoRan (NYSE: FCX) for copper and Comstock Resources (NYSE: CRK) for natural gas.

But the game has changed.

Online brokerage accounts and the arrival of exchange-traded funds (ETFs) and notes (ETNs) give individual investors the chance to get into the game with just the click of a mouse.

The choices are staggering:

  • Coffee – iPath Coffee (NYSE: JO)
  • Sugar – iPath Sugar ETN (NYSE: SGG)
  • Lead – iPath Lead ETN (NYSE: LD)
  • Nickel – iPath Nickel ETN (NYSE: JJN)
  • Corn – Teucrium Corn Fund (NYSE: CORN)
  • Grains – iPath Grains ETN (NYSE: JJG)
  • Cotton – iPath Cotton ETN (NYSE: BAL)
  • Tin – iPath Tin ETN (NYSE: JJT)
  • Aluminum – iPath Aluminum ETN (NYSE: JJU)
  • Silver – iShares Silver Trust (NYSE: SLV)
  • Oil – iPath S&P GSCI Crude Oil Total Return (NYSE: OIL)
  • Palladium – ETFS Physical Palladium Shares (NYSE: PALL)
  • Natural gas – iPath Natural Gas ETN (NYSE: GAZ)
  • Timber – Claymore Beacon Global Timber Index (NYSE: CUT)
  •  Livestock – iPath Livestock ETN (NYSE: COW)

The “Core-Explore” Commodity Strategy

Given the complexity and volatility involved in commodities investing, you must have an established strategy if you plan on having any success. So here’s an easy one:

Rule No. 1: Having a small allocation in a broad basket of commodities in your core portfolio makes a lot of sense.

This should make your overall portfolio less volatile and help preserve capital since commodities don’t usually move lockstep with stocks. In addition, raw materials provide you with a natural inflation hedge.

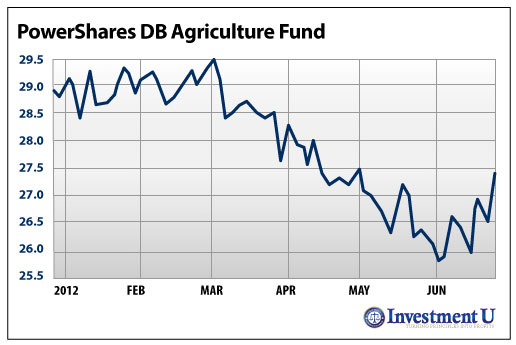
A great conservative play right now would be the PowerShares DB Agricultural ETF (NYSE: DBA). These agricultural commodities are down this year and tend to be less volatile than precious or industrial metals. In addition, the long-term bull story of a world population growing at a rate of 200,000 a day plus rising incomes driving higher food prices is very convincing.

The Safest Way to Invest in Commodities

To meet this growing demand, the World Bank estimates that farms worldwide will have to produce more food in the next 50 years than it did in the previous 10,000 years.

Here are the commodity weightings in this basket as of June 26:

  1. Soybean: 16.11%
  2. Corn: 14.17%
  3. Live Cattle: 12.39%
  4. Sugar: 10.97%
  5. Cocoa: 9.75%
  6. Coffee: 8.48%
  7. Lean Hogs: 8.25%
  8. Wheat: 6.71%
  9. Wheat (Kansas Wheat): 6.53%
  10. Cattle (Feeder Cattle): 4.45%
  11. Cotton: 2.19%

Rule No. 2: For your trading portfolio, explore for commodities that have pulled back sharply.

So far in 2012, the perception of a weakening world economy has driven many commodities lower. Industrial metals do well when the world economy is thriving. The concern that the world economy is slowing has hit them pretty hard in recent months.

This is exactly why you should be getting interested in these industrial metals. You want to get in when markets have pulled back and, even better, when they’re beginning to trend up. Keep an eye on the iPath Industrial Metals ETF (NYSE: JJM). The lower entry price gives you some downside protection, but remember to always have a sell stop in place in case markets move against you.

Now get out there and add some commodities to your global portfolio today.

Good Investing,

Carl Delfeld

Article by Investment U

Market Review 29.6.12

Source: ForexYard

printprofile

The euro shot up close to 180 pips against the USD in overnight trading after euro-zone leaders announced that they would take emergency steps to bring down borrowing costs in Spain and Italy. The EUR/USD is currently trading at 1.2590. Other riskier currencies benefited from the news as well. Both the AUD/USD and GBP/USD have gone up more than 150 pips since last night and are respectively trading at 1.0177 and 1.5661.

Main News for Today

EU Summit-All day

• Following last night’s announcement that EU leaders would work to bring down borrowing costs in Spain and Italy, investors will be closely watching for any additional developments out of the summit
• Any additional news on ways to combat the euro-zone debt crisis could lead to additional gains for the EUR

UK BOE Gov King Speaks-09:30 GMT

• The Bank of England Governor is expected to give a speech regarding further monetary easing steps to boost the British economic recovery
• If additional monetary easing is announced, the pound could extend last night’s gains against the USD

Read more forex news on our forex blog

Forex Market Analysis provided by ForexYard.

© 2006 by FxYard Ltd

Disclaimer: Trading Foreign Exchange carries a high level of risk and may not be suitable for all investors. There is a possibility that you could sustain a loss of all of your investment and therefore you should not invest money that you cannot afford to lose. You should be aware of all the risks associated with Foreign Exchange trading.

Why the Google Nexus 7 Tablet is a Poorly Aimed Shot at Rivals

By MoneyMorning.com.au

While impressive in many ways, the Google Inc. Nexus 7 tablet unveiled will struggle in a market already teeming with offerings from other tech titans.

Key competitors include tablet market leader Apple Inc. (Nasdaq: AAPL), Samsung Electronics Co. (PINK: SSNLF), Amazon.com (Nasdaq: AMZN) and as of last week, Microsoft Corp. (Nasdaq: MSFT).

The 7-inch Nexus 7 certainly has a lot going for it, primarily its 1,280 x 800 pixel high-definition screen, a powerful quad-core NVIDIA Corp. (Nasdaq: NVDA) Tegra 3 processor and a reasonable price tag. It will run a new upgrade to Android called Jelly Bean.

Apparently the Google tablet, actually built by Asustek Computer (PINK: AKCPF) and co-branded with Google, is intended to re-energize a moribund Android tablet market that has failed to dent the dominance of the iPad.

“The tablet market is a major challenge for Google at this point,” Clayton Moran, an analyst at Benchmark Co. told Bloomberg News. “They need to have a competitive product with the iPad.”

Another goal for the Nexus 7 is to show other Android tablet makers how Google thinks it should be done. Analysts suspected similar reasoning behind the Microsoft Surface tablet unveiled last week.

Finally, Google said it wanted to use the tablet to push users toward its services like YouTube and promote sales of its apps through its Google Play store. With the Nexus 7 priced so low, Google will need to sell such extras to make any money.

It’s ambitious, but a flop could end up doing more harm than good to the Android platform.

The central problem for the Nexus 7 is not that it’s a poor product, but that it doesn’t have an obvious niche in today’s crowded tablet market. The Google tablet faces established competition from top to bottom – and especially at the bottom.

The Tablet Breakdown

The Apple iPad: According to research firm IDC, Apple’s tablet controlled 70% of the worldwide market in the first quarter of 2012. The tight integration of the hardware and software – both made by Apple – and vast app ecosystem has made the iPad the king of the tablets. Its starting price is well above the Nexus 7, but then the iPad screen is significantly larger at 9.7 inches. As usual, Apple owns the top end of the market. Given the Nexus 7′s smaller size and the iPad’s advantages, it’s unlikely Google ever intended its tablet as an iPad killer.

The Microsoft Surface: Although the Windows 8-powered Surface faces its own uphill battle against the iPad, it does present another high-end choice to tablet shoppers. Like the iPad, the larger form-factor and (expected) higher price of the Surface make it an unlikely direct competitor to the Nexus 7.

Other Android Tablets: With its impressive specs, Google’s Nexus 7 beats pretty much every other 7-inch Android tablet out there. If those devices were all Google had to worry about, it might have a success on its hands. But one 7-inch Android tablet in particular stands in the way…

That tablet would be The Amazon Kindle Fire. Looking at the Kindle Fire, it’s clear that this is really the product Google had in its crosshairs. Like the Nexus 7, the Fire is a color, 7-inch tablet. It runs an Amazon-modified version of Android.

And like the Nexus 7, the Fire is priced too low for Amazon to make much (if any) profit on the hardware. But the Kindle Fire is a loss leader intended to spur sales of Amazon goods, especially digital content like music, books and movies.

When the Fire sold like hotcakes during the 2011 holiday season, Google surely noticed.

“Google has to be more than a little frustrated that the first mainstream hit Android tablet is the Kindle Fire,” Tom Mainelli, an analyst at IDC, told Computerworld.

Google now appears to be trying to mimic Amazon’s model with the Nexus 7, but it faces several obstacles.

Nexus Versus Kindle

For one thing, Amazon is expected to release a Kindle Fire 2 at the end of July. The word from DigiTimes, a Taiwan newspaper that covers the electronics industry, is that the Kindle Fire 2 will have a 1,280 by 800 pixel high-definition screen and a front-facing camera, putting it on par with at least some of the Nexus 7 features.

But the Kindle Fire 2 may pack a weapon potentially more lethal to Google’s tablet – a much lower price.

The new Fire will look mighty appealing to price-conscious shoppers at the lower end of the tablet market. That could mean a lot of Nexus 7 models collecting dust on store shelves this holiday season.

Finally, as a loss leader the Nexus 7 is unlikely to make anywhere near what the Kindle Fire does. Amazon has a major edge when it comes to digital content.

“If Google is looking to take a bite out of Amazon’s share, it will find that it’s competing against a much more well-developed entertainment orientated platform with huge, well-organized catalogues of books and media content,” Salman Chaudhry, an analyst at research company Context, told The Guardian.

David Zeiler
Associate Editor, Money Morning

Publisher’s Note: This article originally appeared in Money Morning (USA)

From the Archives…

Fortescue’s Fight Against the State
2012-06-22 – Kris Sayce

Don’t Let the Fed Fool You, This Isn’t the Time to Abandon the Market
2012-06-21 – Kris Sayce

An Addicted Stock Market About to Suffer Withdrawals
2012-06-20 – Murray Dawes

Why Liquefied Natural Gas Makes Australia The Next Energy Hotbed
2012-06-19 – Don Miller

Why Greece is Just a Side-Show to the Economies of Spain and Italy
2012-06-18 – Dr. Alex Cowie


Why the Google Nexus 7 Tablet is a Poorly Aimed Shot at Rivals

The ATR (Average True Range) Indicator

By MoneyMorning.com.au

When it comes to technical analysis, many people don’t know where to start.

That’s why last weekend we introduced you to one of the more basic tools, moving averages.

However, that’s just the beginning. There are many types of technical analysis indicators. Today we’ll show you another.

While we said that moving averages play a big part in Slipstream Trader, Murray Dawes’ analysis, there’s another indicator that plays an even bigger role. It’s the average true range indicator. It’s more commonly known as the ATR indicator.

Now unlike moving averages, which help you determine the market direction, the ATR indicator gauges market volatility.

Initially created for the volatile commodities markets, traders now use the ATR indicator for other markets too. Like Forex and major global indices.

How Does an ATR Indicator Work?

Basically, it calculates the total price range including gaps for a trading day. The smaller the price difference, the smaller the number. The higher the total trading range, the higher the ATR number.

Then, an ‘average true range’ is calculated over a given period. Generally, the time frame used is somewhere between 5 and 14 days. However, most traders tend to use a ten day time frame.

Each trader can then modify this to suit themselves. Murray adds his own twist. He takes the ATR number and divides it by the price, so he ends up with an average true range over ten days as a percentage of the price.

He then lays the indicator over the top of the market being analysed and inverts the scale for the ATR indicator. This means that as the ATR indicator rises on the chart, volatility falls and vice versa.

Let’s look at an example…

In a rising market, the ATR percentage will be quite low. Look at the chart below. On the left hand side of the chart, the numbers are percentages. So 1.0 is actually 1% and so on.

S&P 500 chart using a 10-Day ATR Percentage Indicator

S&P 500 chart using a 10-Day ATR Percentage Indicator
Click here to enlarge

Source: Slipstream Trader


Around December 2010 (on the left of the chart), you can see the ATR percentage indicator rising. The ATR indicator is well below 1.0 (remember the scale is inverted so a rising line means falling volatility). In fact, the price range for each trading day during this period is roughly around 0.7%. This suggests that the market wasn’t particularly volatile at this point.

But look how much things changed a few months later in late July and early August 2011 (in the middle of the chart). It moves from 1.5% to as high 3.3%. It’s this ‘drop’ on the chart that tells a trader that volatility is increasing.

There’s a simple way to remember how it works. When the market rises, the ATR percentage indicator range falls. That is, it shows a low number. When the market’s falling, the ATR range will increase. And you’ll see a much higher percentage number.

So how does this tell you what’s happening in the market now?

If you look at the far right of the chart, you can see that over the last few weeks, the S&P500 has tried to rally.

Yet, as Murray told his Slipstream subscribers earlier this week, it’s because of this chart he’s still ‘bearish’ on the market overall.

‘Sure the S&P 500 has attempted to rally. But at the same time, the volatility is increasing. Look, the ATR percentage indicator is hovering around 1.5%. It’s because of this rising volatility that I can remain bearish on the market.’

Simply put, he uses the indicator to either confirm or to question the current market movements. He looks at the relationship between the indicator and the market being studied. So when a divergence opens up between the two (when the indicator and market ‘separate’) it can be a great warning sign that a reversal may be imminent.

It’s important to remember when using indicators, that they are just that. An indication of what might happen. Murray finds the ATR percentage indicator useful to his technical analysis, but it’s not his only way of ‘reading’ the market. In fact, he has his own propriety technique. But he uses other technical tools, like the ATR indicator, to confirm a trade.

If you’d like to see how Murray is using this analysis to predict the next big market move, click here to learn more.

Shae Smith
Editor, Money Weekend

The Most Important Story This Week…

Since it hit a high of $49 an ounce in April last year, the price of silver has gone down almost 50%. It is currently trading around $26. That’s a big fall. But as commodities guru Jim Rogers often points out, big corrections in a long-term bull market aren’t unusual. It’s important not to get panicked into selling if you own silver already.

If you don’t own any silver, a big move down can be a great place to buy in. You will never be able to pick the bottom exactly. But if you agree that silver is in a bull market, then a 50% fall means you are much closer to the bottom. The key is to make sure the trends that have driven silver up 500% over the last ten years are still there. Money Morning editor Dr. Alex Cowie says they are and silver is getting ready for its next leg up. Learn more in Three Reasons Why Silver Could Take Off in 2012

Other Recent Highlights…

Kris Sayce on The Hard Lesson of a Stock Trader: No Pain, No Gain: “But that’s part of the risk when you invest. It’s about balancing probabilities and managing your risk. The alternative is to do nothing, which in itself is an investment strategy…just not a very good one. With interest rates plunging to multi-decade lows, investors have no choice but to take risks. The only question is what risks should you take?”

Ben Gersten on How Underwater Mining Could Lead The Next Gold Rush: “The next real gold rush won’t be on a far flung asteroid. It will be under the sea. In fact, The Wall Street Journal said earlier this month that underwater mining could be a $500 trillion business someday. That means underwater mining stocks, which are cheap now, could be headed for monster gains.”

Dr. Alex Cowie on the ‘Big Wednesday’ For the Aussie Dollar: “Australia has the 16th largest economy in the world. Yet the Australian dollar is the 5th most traded currency globally. A big reason why it punches above its weight on the foreign exchange markets is that traders use it as a proxy for China exposure. But now that China’s economy is decelerating fast, why hasn’t the Aussie dollar fallen further?”

John Stepek on Why the German Economy Can’t Be Europe’s Sugar Daddy: “And this doesn’t take into account German banks’ exposure to the rest of Europe. The German banking system is at least as broke as all the rest, so if the government has to stand behind it, that’ll make Germany’s fiscal picture look even worse. In a way, Germany just needs to choose how it’s going to lose the money.”


The ATR (Average True Range) Indicator

How to Build Wealth with Dividend-Paying Stocks

Article by Investment U

I recently received an email from a reader in his 50s who plans to retire in four years. He told me he’s just getting started in investing and wanted some ideas for “rapid growth.”

Yikes!

Hopefully, he’s got a large 401(k), a pension, or an inheritance. Four years isn’t enough time to get your finances ready for retirement if you’re starting from scratch.

While I like a good speculation as much as anyone, the reader’s approach flies in the face of how to actually make serious money in the markets…

The Dividends Statistics Speak for Themselves

If you’re investing in stocks for the long term, the best thing you can do is buy stable companies with a track record of increasing their dividends and then reinvest those dividends.

Sure, they may only be 3% or 4% dividends, but you’ll be shocked at the way they can create significant wealth. I’ll show you exactly what I mean in just a moment, but first, check out these eye-popping statistics on reinvested dividends:

  • From 2000 to 2010, reinvested dividends were responsible for 87% of the S&P 500′s total return.
  • From 1990 to 2010, reinvested dividends were responsible for 43% of the S&P 500′s total return.
  • From 1871 to 2003, reinvested dividends were responsible for 97% of the stock market’s total return.

Let’s dig deeper…

What Dividend-Paying Companies Are Telling You

The first question to ask yourself when investing in dividends is whether you want stocks that are Dividend Aristocrats or Dividend Achievers.

  • A Dividend Aristocrat is an S&P 500 company that has raised its dividend every year for the past 25 years.
  • A Dividend Achiever has raised its dividend for the past 10 years.

By raising the dividend, company executives are telling you two things…

  • They’re Committed to Shareholders: By returning capital to shareholders, companies are rewarding your faith in their business. Look at it this way: If you invested in your brother-in-law’s restaurant and the business was doing well, at some point, you’d expect him to start writing you checks. The same thing should hold true for the stocks you invest in.
  • They’re Confident: Raising the dividend payment shows investors that the company’s management is confident in their business now and in the future. It also shows that they take their dividend policy seriously. Executives are keenly aware that Wall Street doesn’t like dividend cuts – and investors tend to punish dividend-choppers accordingly.

And of course, if you receive more dividends every year, your yield on cost (i.e. the yield on the price you originally paid) rises. For example, if you buy a $50 stock with a $2 annual dividend, your yield is 4%. But five years later, if the dividend has risen to $3, your yield on cost is 6%, even if the share price has doubled to $100.

So what’s the best way to go about investing in dividend-paying stocks?

Are You Looking At These Two Crucial Numbers? You Should Be…

After you’ve identified a Dividend Aristocrat or Achiever, you want to be sure the company can continue to pay its dividend.

You can do that by examining its payout ratio – the percentage of net income that’s paid out in dividends. (And when it comes to determining income, I prefer to use levered free cash flow, as it’s much harder for a company to manipulate the numbers.) Generally speaking, you want the payout ratio to be 75% or less. That gives the company plenty of room to still pay the dividend if net income or cash flow decrease in any given year.

So once you’re pocketing healthy dividends, why should you then reinvest them?

Simple…

A 12.4% Return While Underperforming the S&P 500

Here’s a great example of the power of compounding reinvested dividends. It comes from one of my favorite stocks – Genuine Parts Co. (NYSE: GPC).

Genuine Parts has increased its dividend every year for the past 56 years! That’s an extraordinary record. To put that in perspective, the last time it didn’t raise its dividend, President Eisenhower was in office, Elvis made his television debut on the Louisiana Hayride and The Lawrence Welk Show premiered.

Needless to say, Genuine Parts is a strong performer. Over the past 10 years alone, its share price has doubled. And I expect it to keep rising, as earnings are projected to grow by more than 12% per year for the next five years.

But for the sake of our example, let’s assume a 9% annual increase in share price – less than the 9.6% average return of the S&P 500 over the past 50 years.

Let’s say you bought 200 shares today (with GPC’s current share price around $57, that would cost you around $11,400), reinvested the dividend and the dividend increased by 6.8% per year (the average of the past 27 years)… what would happen? After 10 years, your original $11,400 investment would be worth $36,659.98, growing by an average of 12.4% per year – even while the stock underperformed the S&P 500 by over half a percentage point.

I used the underperformance figure simply to illustrate a point. I actually expect Genuine Parts to outperform the S&P 500 over the next decade.

Now imagine if you have a portfolio of dividend-paying Aristocrat stocks doing the same thing. If you had a portfolio worth $100,000 and it had the same parameters of the Genuine Parts example above, but your portfolio simply matched the performance of the S&P, your $100,000 would nearly triple in 10 years.

And the power of compounding really gets going in the following decade, as your investment would soar to $891,000. That compares with $208,000 after 10 years and $520,000 after 20 years if you didn’t reinvest the dividend.

Unfortunately, for the reader I mentioned at the top, this is a long-term strategy and wouldn’t get him to his goals in four years. But if you have a longer timeframe, reinvesting in quality dividend-paying stocks is an excellent strategy for creating and preserving wealth.

Good Investing,

Marc Lichtenfeld

Article by Investment U

Jim Cramer says, “Contrarian Investing? Forget About It”

Article by Investment U

Jim Cramer says, “Contrarian Investing? Forget About It”

Contrary to Cramer's belief, contrarian investing works. Just ask the likes of Warren Buffet, George Soros, John Templeton, David Dreman, and Jim Rogers.

A couple of weeks ago Mad Money host Jim Cramer made the above declaration regarding contrarian investing. He went on to say, “I think it’s wrong. I think it doesn’t matter… I think it’s really a treacherous way to invest.”

I was a little baffled when I saw excerpt. Then I saw the editorial written by Producer Drew Sandholm where he gave the following definition of a “contrarian investor:”

“In the investment world, a contrarian is someone who takes a position that differs from the majority. If a particular sector is ‘hated’ by most investors, a contrarian might want to buy in. After all, if few investors like the sector, a contrarian thinks there are few people left to sell, making it immune to big declines.”

Sandholm went on to write that Cramer feels the strategy to be “too hazardous” to recommend. It infers that contrarian investing is based purely on sentiment and that investors should be using fundamentals and research to decide which companies to invest in.

However, here at Investment U, we don’t feel these two things are mutually exclusive. You can still look for solid fundamentals in regions and sectors that were abandoned by “the herd.”

For instance, Alexander Green recently wrote about finding fundamentally sound companies in the beaten-down natural gas sector.

Contrarian Investing is Based on Fundamentals

Contrarians aren’t rebellious teens, rejecting their parents’ way of investing. What the piece misses is that contrarian investing is based on fundamentals. Many times popular investment sentiment is not. Do we need to remind you of the dot com and housing bubbles?

Investment U defines a contrarian investor as someone who believes in independent wealth building and profits rather than the actions of the herd. The key isn’t to go against the grain for the sake of being different, but to find opportunities based on solid fundamentals that are ignored or shunned by everyone else. And if this is done successfully, then you get in on the ground floor and watch profits rise as the rest of the investment world gets a clue.

In Cramer’s defense, I believe he’s specifically speaking about those investors who are looking at whether a sector is under or overweighted compared to the S&P 500 in an attempt to time the market. But that definition doesn’t cover the whole contrarian movement.

The Vast Spectrum of Contrarian Investing

I don’t think anyone out there would call Jim Rogers, George Soros, or Warren Buffett contrarian day traders. However, the contrarian part of that statement is true.

  • Jim Rogers loves buying undervalued assets. What he saw in gold and silver over a decade ago, he currently sees in the agricultural sector. Agriculture prices are – on a historical basis – extremely depressed and this is where he sees his next opportunity.
  • On September 16, 1992, Black Wednesday, Soros’ fund sold short more than $10 billion in pounds, profiting from the U.K. government’s reluctance to either raise its interest rates to levels comparable to those of other European Exchange Rate Mechanism countries or to float its currency.
  • Warren Buffett is famously “greedy when others are fearful and fearful when others are greedy.” He focuses on the quality of the business rather than the short-term or near-future share price or market moves. He takes a long-term, large scale, business value-based investment approach that concentrates on good fundamentals and intrinsic business value, rather than the share price. His recent bets on housing are a good example of his contrarian prowess.

So, I do agree with Cramer that investors should avoid investing simply on sentiment. But that’s not our brand of contrarian investing anyways. We look for fundamentally strong businesses in areas where many investors essentially threw the baby out with the bathwater.

Good Investing,

Jason Jenkins

Article by Investment U

Turkcell: If I could be a Turkish general for a day…

By The Sizemore Letter

Not to play on stereotypes, but if Turkcell ($TKC) were a government and not a private company, a cabal of stone-faced Turkish generals would have surrounded its headquarters with tanks months ago and forcibly taken over its board of directors.

And if they had, you could bet that the share price would have enjoyed a nice rally. The battle for control of Turkcell’s board—which has prevented the company from paying a dividend in over two years—has exhausted investor patience to the point that a coup d’état (or perhaps a coup de compagnie?) would seem appealing.

Investors may get their way, though alas, there will be no tanks. After a special shareholder meeting scheduled for June 29 failed to materialize, Turkish Transport Minister Binali Yildirim told Reuters that the government may soon intervene in the public interest.

The Turkish state certainly has the grounds to intervene. The Capital Markets Board, the Turkish markets regulator, warned Turkcell earlier in June that it had failed to comply with new rules requiring at least three independent board members. And why is Turkcell out of compliance? Because the two major shareholder factions can’t agree on who qualifies as an “independent” board member, and no one wants to give a vote to the “other guys.” Sigh….

For those new to this little bit of boardroom drama, two major shareholder groups are vying for control of the company, but neither currently has enough votes on the board of directors to prevail. The court cases that have ensued have spanned the globe, even ending up in locales as remote as the British Virgin Islands and Britain’s Privy Council.

The board drama has been a major distraction for the company and has impaired its long-term strategic planning, but it hasn’t slowed down the company’s operating results, which continue to be strong. Turkcell is widely praised for its Western-educated executive team and consistently ranks high among European peers for customer service quality. (Yes, you read that right. I said “European” and not “emerging market.” Turkcell punches above its weight.)

The proof is in the pudding. In the first quarter of 2012, Turkcell enjoyed year-over-year revenue growth of 12.3% and profit growth of 56.0% (see investor presentation).

Even better, the sales mix is shifting in Turkcell’s favor. The company enjoyed 35% year-over-year growth in smartphone sales, with the lucrative data plans that this implies, and the subscriber mix (which, like many emerging market providers, is weighted heavily towards pre-paid customers) continues its shift to post-paid contract customers.

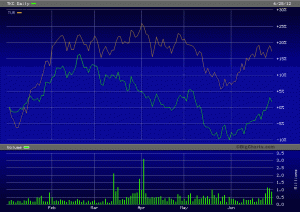
Though the boardroom fiasco is no doubt keeping a lid on Turkcell’s share price, its moves have not been out of line with the broader Turkish market (see chart). Turkcell and the iShares MSCI Turkey ETF ($TUR) have moved in virtual lockstep since hitting a bottom in early June.

Turkcell remains one of my favorite plays on the rise of the emerging market consumer, and I consider the stock to be very attractively priced. Shares trade for just 10 times forward earnings, and the company has very little debt.

The board impasse will be broken—eventually. And when it is, investors can expect a modest dividend windfall.

Until then, they will have to be content with owning an emerging-market gem with great growth prospects trading at a modest earnings multiple. Come to think of it, that doesn’t sound so bad.

Disclosures: TKC is held in Sizemore Capital accounts.

If you liked this article, consider getting Sizemore Insights via E-mail

Related posts:

G8 Summit Begins Today!

Source: ForexYard

printprofile

The focus is on the G-8 meeting today. Leaders from the Western economic powers and Russia meet in Italy on Wednesday and are joined the day after by leaders from China, India, Brazil and others to discuss global challenges. World leaders are also bound to express the hope that the worst of the global economic crisis is passing. Apart from the comments about global economic outlook, world leaders are expected to discuss potential ‘exit strategies’ of the aggressive stimulus plans.

Moreover, the market will be eager to see if there’s a discussion about a new reserve currency. World leaders, especially from emerging markets who have held enormous amounts of USD-denominated debts, have long been requesting for another dominant currency to replace the U.S. Dollar. The most delicate issue leaders will face in economic terms is probably China’s push for consideration of alternatives to the USD as the world’s reserve currency.

The Dollar already lost a cent versus the EUR at one stage last week when after it was reported that Beijing wanted the matter debated. Still, economists have said that the greenback is still the most important reserve currency of the day, and they believe that this situation will continue for many years to come. As for the outcome of the Italy summit, FX market players are wondering whether the BRICs, or China alone, will mount a serious challenge to the Dollar. But the fact remains that with a significant global recession, it’s important to aim for stability, and stability has been based on the U.S. Dollar as the global reserve currency.

Forex Market Analysis provided by ForexYard.

© 2006 by FxYard Ltd

Disclaimer: Trading Foreign Exchange carries a high level of risk and may not be suitable for all investors. There is a possibility that you could sustain a loss of all of your investment and therefore you should not invest money that you cannot afford to lose. You should be aware of all the risks associated with Foreign Exchange trading.

EUR Falls Broadly on Russian Downgrade

Source: ForexYard

printprofile

The EUR is trading near a two-month low against the Dollar on speculation the economic slump in Eastern Europe will cause the Euro-Zone’s recession to deepen, and markets are worried that Eastern Europe’s situation will get worse before it gets better.

The EUR was traded at 1.2852, up from 1.2849 late yesterday. It reached 1.2706 on February 2, the lowest level since December 5. The EUR also tumbled against the Dollar and the Yen after Fitch downgraded Russia’s long-term foreign and local currency ratings, sparking fears of a steep downturn in Eastern Europe. The European currency continues to have massive problems given the region’s association with Eastern European emerging markets as there are big Italian and German banks with large exposure there. Investors expect the currency to remain vulnerable for some time due to credit woes in Russia and Eastern Europe.

The EUR also weakened yesterday as the European Union’s (EU) statistics office in Luxembourg said retail sales fell 1.6% in December from a year earlier. Analysts say that in the Euro-Zone there is still a drip-feed of bad economic news, which is weighing on the EUR and keeping risk sentiment on the back burner. Data released earlier showed deterioration in Europe’s dominant services sector, and separate numbers showed Euro-Zone retail sales falling more than expected year-on-year in December. The EUR has also declined 1.6% to 88.76 against the British Pound after a report showed the U.K. services industry contracted less than forecast in January, and U.S. companies cut fewer jobs than previously expected.

Many economists expect, looking at the state of the Euro-Zone economy, another Interest Rate cut by the ECB this week. But even with low inflation expectations, Governing Council members have indicated that the ECB would not follow the U.S. Federal Reserve and the Bank of Japan (BoJ) in cutting rates to zero. With little room to cut Interest Rates, analysts are starting to look what else central banks have in store, especially whether the ECB would start to directly buy corporate debt.

Forex Market Analysis provided by ForexYard.

© 2006 by FxYard Ltd

Disclaimer: Trading Foreign Exchange carries a high level of risk and may not be suitable for all investors. There is a possibility that you could sustain a loss of all of your investment and therefore you should not invest money that you cannot afford to lose. You should be aware of all the risks associated with Foreign Exchange trading.