The Basics of Oil Investing: The WTI-Brent Spread

Article by Investment U
The Basics of Oil Investing: The WTI-Brent Spread

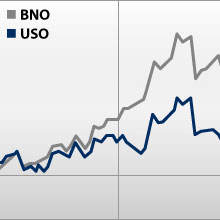
USO, which tracks WTI futures, and BNO, which offers exposure to Brent crude, show the WTI-Brent spread (or WTI vs. Brent) over the past few years.

I think it’s safe to say crude oil may be the most essential commodity around the globe.

It’s a new world out there. The United States is just one of the super economies around and many of the others are new to the game and are growing at a rate much larger than ours.

We use crude oil for everything from running our cars to making plastic. The need for oil causes conflicts and gives power to those countries that have an abundance of it. Taking all this into account, not too many of us actually know how it’s priced. A lot of us hear how much it costs per barrel or get mad when prices go up at the pump. But what’s the method behind the madness?

Hopefully, I can shed a little light on the process…

All Oil is Not Equal

If you drill for oil in different parts of the world, you may get oil, but it might not be all the same oil. Excuse me for getting all scientific, but there are varying degrees of oil based on a number of metrics such as the oil’s American Petroleum Institute (API) gravity. This API gravity is used to compare a petroleum liquid’s density to water. The scale ranges from 10 to 70. “Light” crude oil usually has an API on the higher side of the scale, while heavy oil falls on the lower end of the range.

After you find the API gravity, investors will then look at how sweet or sour petroleum is. This “flavor” depends on the oil’s sulfur content – 0.5% is a key benchmark. When oil has a total sulfur level greater than half a percent, then it’s considered sour. Content less than 0.5% indicates that oil is sweet.

You can find sour oil in a lot more places around the world – like Canada, the Gulf of Mexico, some South American nations, as well as most of the Middle East – than its sweet counterpart. Sweet crude comes from the good old USA, the North Sea region of Europe, and parts of Africa and Asia.

The industry uses both types, but the sweet crude is the prize pony because it requires less processing in order to get out all of the bad stuff. What to take away? Light and sweet forms of crude oil are strongly desired. The heavier form usually trade at a discount in comparison.

WTI vs. Brent

Now we have a foundation so we can begin to price these different types of oil on the world market. Right now, there are two major benchmarks for world oil prices, West Texas Intermediate (WTI for short) crude oil and Brent crude oil. Both are light sweet crude oils, but WTI is generally sweeter and lighter.

Benchmarks are needed so traders can determine transactional settlement prices. Crude oil can be found all over the world, so the types vary. With so many different variances, benchmarks are used to give a reference point that can be globally quoted and traded. There are actually over 160 different types of crude produced in the world. And as we just discussed, each type of crude is priced differently based on its quality.

Understanding the WTI-Brent Spread

WTI is a regional benchmark reflective of supply/demand issues in the American Midwest, while Brent is a European benchmark reflective of specific European issues (with slightly higher exposure to regions such as Africa and the Mideast).

WTI is a crude oil specific to the Midwest region of the United States. Where you find it that explains its large discount to Brent. There is a glut in the amount of crude oil going to refineries in the Midwest due to an increased supply from Canada and North Dakota’s Bakken Shale. The excess supply pushes prices of WTI at the refineries in Cushing, Oklahoma.

Brent reflects the supply/demand balance in Europe. Because of this, many industry analysts believe that Brent is a more global benchmark and reacts more to global events. Think of how the issues in Libya last year and now Syria and Iran pushed Brent prices higher.

Two ETFs, the United States Oil Fund (NYSE: USO), which tracks WTI futures, and the United States Brent Oil Fund (NYSE: BNO), which offers exposure to Brent crude, show the performance difference of the major benchmarks over the last few years. Since its inception in mid 2010, BNO and Brent oil alike have put a beating on WTI with a return around 75% for the fund. In comparison, USO has gained 25% – which isn’t bad.

The graph below gives us a visual of the difference:
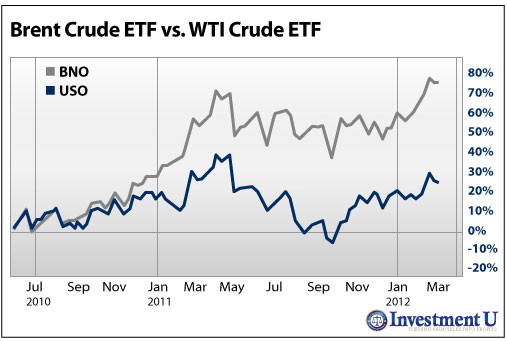
Brent Crude ETF (BNO) vs. WTI Crude ETF (USO)

It’s my belief that volatility in Middle East can account for the difference we’ve seen lately.

Take the following into consideration going forward…

  1. How long can this vast gap in returns last? If the issues in the Middle East stabilize, we might see the premiums come back together. I’m referring to stability as no immediate signs of war or revolution. You could possibly get trapped into buying a commodity that is set to fall based on overarching macroeconomic factors.
  2. On the flip side, the region has a history of instability so it might be a while before we see the region calm down and Brent fall. If you play the chaos card, take Brent as the best crude option.
  3. WTI and Brent are still the two prominent benchmarks used to set global oil prices, but this could change in the next few years. Major producers are shifting allegiance or going in a different direction all together. Brazil’s Petrobras (NYSE: PBR) – which Investment U has written about on several occasions recently switched its benchmark pricing from WTI to Brent. Saudi Arabia, Iraq and Kuwait all shifted their benchmark pricing for U.S. exports from WTI to the Argus Sour Crude Index.
  4. These two benchmarks will become less important as markets will probably seek one global benchmark. The widening WTI-Brent spread is accelerating this trend. However, that’s probably years away from becoming a reality.

Hope this helps.

Good Investing,

Jason Jenkins

Article by Investment U

How to Be Rich: 6 Investing Lessons From J. Paul Getty

Article by Investment U

How to Be Rich: 6 Investing Lessons From J. Paul Getty

J. Paul Getty’s book, How to Be Rich, was recommended by Mark Ford in a recent column. In fact, he advised that even if you've already read it, read it again.

Upon seeing the first chapter entitled How I Made My First Billion, I knew I had a winning book in my hands…

J. Paul Getty’s book, How to Be Rich, was recommended by Mark Ford in a recent column. In fact, he advised that even if you’ve already read it, read it again.

So I promptly ordered it and read it twice in one week.

What a fantastic book. Getty’s life story alone is inspiring, but what makes it special is his blunt and personal advice.

Getty was fortunate to have oil and common sense in his blood in equal proportions.

His father was a successful businessman who moved west to become a wildcatter in the rough and tumble Oklahoma oil boom. J. Paul grew up around the business doing the tough and gritty work at the wellhead before striking out on his own.

With no capital at all, the first deal for this independent wildcatter gave him a 15% share of the profits. Then his father grubstaked him, taking 70% of the profits while the Oxford-educated son worked right next to the roustabouts with his battered car serving as his office.

By the age 24, he became a millionaire. His next move was to explore for oil in California where his success expanded into property and stocks.

What makes this book different is that it isn’t just about how to get rich, but how to live a full and rich life. In Getty’s view, the key is to be a non-conformist, to be independent and willing to challenge conventional wisdom.

After reading the first chapter, I had a tremendous urge to jump out of my chair and dig for oil in my backyard. (I settled on just planting a tree.)

Taking on Getty’s Life Lessons

The Getty story pulsates with activity, nerve and initiative. Here’s my take on Getty’s life lessons and how they can be applied to become a more successful investor and businessperson.

Be stealthyGetty won his first oil property in a competitive bid for only $500 by using a bank as his proxy, thereby scaring away independent competitors.

Separate fact from opinionGetty always tried to dig deep for facts and challenge “expert” opinions. He was one of the few wildcatters who studied and used geological data to help him make decisions.

Be independentGetty loved being an independent wildcatter outwitting the big boys. It’s hard to imagine him sitting in a cubicle, or any office, for that matter.

Look ahead and learn from mistakesGetty was way ahead of his time in seeing great growth opportunities in international markets. Half a dozen times in his book, he literally kicks the reader to look beyond America’s borders. And Getty doesn’t pass the buck, but admits his blunders. One beauty was to pass on a bargain-basement opportunity to gain a foothold in the oil-rich Middle East in the 1930s only to pay $12 million for a Saudi concession in 1946. (Still a great move.)

Be patient, but take risks in down markets by finding quality valuesGetty was a master in taking advantage of great stock values in depressed and crisis markets. Much of his great fortune can be traced back to the 1930s when he scooped up resource stocks and properties at bargain prices.

Finally, Getty chose his targets carefully and had the courage of conviction to jump in when others were scared to death. He put it this way:

 ”The big profits go to the intelligent, careful and patient investor, not to the restless and overeager speculator… The seasoned investor buys stocks when they are low, holds them for the long-pull rise and takes in between dips and slumps in his stride.”

All great lessons and reminders to investors and businessmen of any skill level…

Good Investing,

Carl Delfeld

Article by Investment U

MLPs: Better Than Dividend Stocks for Income Investors?

Article by Investment U

MLPs: Better Than Dividend Stocks for Income Investors?

As income investors scour the market for higher yields, a number of them are (in fact) shifting their attention from dividend stocks to MLPs like EPD and ETP.

Last December, Investment U Senior Analyst Marc Lichtenfeld made some bold predictions for income investors in 2012.

Perhaps his biggest was that Apple (Nasdaq: AAPL) would declare a dividend. Of course, in March, Apple did just that.

Another prediction was that master limited partnerships (MLPs) would be one the hottest investments this year.

Marc pointed out, as dividend stocks become more popular, their overall yields will go down. As a direct result, investors will widen their search for income and end up in MLPs.

MartketWatch reported just a few days ago, “In 2012, S&P 500 companies are on pace to pay out a record amount in dividends — $277 million or about $29.02 per index share.”

What does this tell us?

It’s that dividend paying stocks are more popular than they’ve been in a very long time, if ever.

And as investors scour the market for higher yields, a number of them are (in fact) shifting their attention to MLPs.

The Good… the Bad… and the Easy Way

It’s doesn’t take much to see why MLPs are gaining in popularity today…

  • The average dividend from the S&P 500 yields just about 2%.
  • 10-year Treasuries pay less than 2%.
  • And money market accounts return next to nothing.

Meanwhile, MLPs like Enterprise Product Partners (NYSE: EPD), Energy Transfer Partners (NYSE: ETP), and Regency Energy Partners (NYSE: RGP) yield 5%, 7%, and 9% respectively. Returns from other MLPs can be even higher.

Because MLPs redistribute at least 90% of their income back to investors (known as unit holders), they typically have higher yields than regular dividend paying stocks.

But there’s a second reason more investors are looking into them as well… taxes.

You see, distributions from MLPs offer a unique tax advantage because a portion of their payouts is considered a “return of capital,” not a dividend.

Therefore, unit holders are not taxed on their return of capital until they go to sell their holdings.

Now if this sounds enticing and complicated all at the same time, you’re absolutely right.

And this is exactly what makes MLPs good for some and bad for others. I’d say, unless you know what you’re doing, you should consult a tax advisor before investing a dime in any MLP.

But is there any way to enjoy higher yields from MLPs without the tax headaches?

Yes. And the answer for you may be in ETFs.

MLP ETFs

Something you’ll quickly notice about MLPs is that nearly all of them are companies involved with the storage and transportation of commodities such as oil or natural gas.

Not surprisingly, MLP ETFs are also comprised the same way.

For instance, Alerian MLP Infrastructure Index ETF (NYSE: AMLP) contains 50 prominent energy-related MLPs in its fund.

Typical of individual MLPs, Alerian also has a juicy yield of 6%. But unlike regular MLPs, it’s structured like a C-corp and is required to pay state and federal income taxes.

In other words, while you’ll have higher income and less headache to deal with at tax time by investing in an MLP ETF, you will also pay taxes and fees on the fund just like you would investing in any other dividend generating ETF.

Alerian has an expense ratio of 0.85%. Among MLP ETFs, the average expense ratio is 0.88%. But this number was just slashed by a new ETF, Global X MLP ETF (NYSE: MLPA), which just launched a little over a month ago. Its expense ratio is just 0.45%.

Looking Forward

No matter how you look at it, MLPs are increasingly becoming a popular way to invest among savvy investors. But if you’re not one for getting involved in their complicated tax structures, you may want to consider an MLP ETF as an alternative. With interest rates to remain low at least until 2014, you’re going to be hard pressed to find a more solid yield for your investments.

Good Investing,

Mike Kapsch

Article by Investment U

Monetary Policy Week in Review – 26 May 2012

By Central Bank News
The past week in monetary policy saw 9 central banks reviewing interest rate settings.  Three central banks reduced their monetary policy interest rates: Vietnam cut another -100 basis points to 12.00%, Denmark trimmed -10 basis points to 0.60%, and Georgia cut -25bps to 6.00%.  Meanwhile those that held interest rates unchanged were: Nigeria 12.00%, the Czech Republic 0.75%, South Africa 5.50%, Angola 10.25%, Latvia 3.50%, and Japan at 0.10%; the Bank of Japan also made no changes to its quantitative easing program (also sometimes referred to as an LSAP i.e. Large Scale Asset Purchase).


Looking at the central bank calendar, the week ahead sees the far east of Europe reviewing interest rates, with Israel up first, then Hungary and Turkey.  But most eyes will be on Brazil’s central bank, where the BRIC economy is expected to cut the Selic rate by 50 basis points to a low of 8.50%.  Elsewhere the Bank of Japan will release monetary policy meeting minutes.  On the economic front, the week ahead sees the release of some key monthly indicators like US nonfarm payrolls and the much watched purchasing managers index (PMI) readings.

May-28
ILS
Israel
Bank of Israel
May-29
HUF
Hungary
The Magyar Nemzeti Bank
May-29
TRY
Turkey
Central Bank of Turkey
May-30
BRL
Brazil
Banco Central do Brasil

Source: www.CentralBankNews.info

Article source: http://www.centralbanknews.info/2012/05/monetary-policy-week-in-review-26-may.html

Central Bank News Link List – 25 May 2012

By Central Bank News
Here's today's Central Bank News link list, click through if you missed the previous central bank news link list.  Remember, if you want to submit links for inclusion in the daily link list, just email them through to us or post them in the comments section below.

Pound Drops as GDP Data Raises QE Bets

By TraderVox.com

Tradervox (Dublin) – The Office of National Statistics reported last week that the Gross domestic product for UK had fallen 0.3 percent dropping more than the market estimate of 0.2 percent drop. This led the pound to fall for the fourth week in a row against the dollar as investors choose the greenback over the pound as the best safe haven option. Safe haven demand has increased in the market due to the continued crisis in euro zone. The nation’s ten-year gilts also dropped two basis points after the report was released last week.

The GDP report from the Office of National Statistics have also increased speculations that the Bank of England will embark on its quantitative easing program to take the economy back on the recovery path. The BOE is also facing investigations into its recovery strategies as lawmakers are not convinced that the bank’s president took the right action. Some analysts have taken the first quarter GDP results as an indication of weakness in the UK economy hence pushing many investors into choosing the yen and the US dollar as the best safe haven currencies in the market at the moment. Further weaknesses in the UK economy were also evident from the construction output report, which showed that the construction in the country fell by 4.8 percent, the most in 3 years. The market was expecting a drop of 3 percent.

The Europe’s debt crisis has been established as the biggest threat to the UK’s financial stability. Leaders in UK have urged the euro zone leaders to come up with appropriate measures to curb the current crisis as it is hurting the UK exports –forty percent of the UK’s exports go to the euro zone countries hence any problem in the region is set to disrupt recovery measures in the country. There are fears that the current advance of the pound against the euro will hurt exports. However, the lower-than expected GDP results led the pound to drop to $1.5639 which is the lowest since March.

Disclaimer
Tradervox.com is not giving advice nor is qualified or licensed to provide financial advice. You must seek guidance from your personal advisors before acting on this information. While we try to ensure that all of the information provided on this website is kept up-to-date and accurate we accept no responsibility for any use made of the information provided. Opinions expressed at Tradervox.com are those of the individual authors and do not necessarily represent the opinion of Tradervox.com or its management. 

Article provided by TraderVox.com
Tradervox.com is a Forex News Portal that provides real-time news and analysis relating to the Currency Markets.
News and analysis are produced throughout the day by our in-house staff.
Follow us on twitter: www.twitter.com/tradervox

ECB on the Spot to Help in Spain Debt Crisis

By TraderVox.com

Tradervox (Dublin) – The EU Summit meeting held last week raised more questions than answers as leaders from the region crashed on issues pertaining to the solution of the region’s debt crisis. Angela Merkel, the German Chancellor and the new French President Francoise Hollande raised their different proposition of how the debt crisis should be dealt with. They crashed on whether the region should introduce a new euro bond to help safe guard the region from spiraling into a recession.  Further, the Spanish Prime Minister urged the ECB to act in order to bring down the country’s rising borrowing cost.

Mariano Rajoy, the Spanish Prime Minister, said in a speech after the EU summit on May 24 that the unsustainable public debt is the problem and urged the European Central Bank to take a decision that it had taken before. He was referring to the ECB’s decision to buy Spanish bonds in August which helped to reverse the surge of the country’s bonds. Further, the bank channeled $1.3 trillion of three year loans to the region’s financial institution in December and February. The Spanish Prime Minister also indicated that the measures he was proposing could be taken in 24 hours by the ECB, where he suggested that guaranteeing the sustainability of the public debt was the most important.

Spain has seen 16 of its financial institutions being degraded by moody’s which has increased fears of the region’s economy. Further, the surge of the 10-year bond yield has also raised concerns that the country may require international bailout just like Portugal, Ireland and Greece. The country’s ten-year bonds has risen 150 basis points from March second when the country missed the deficit target. Despite Rajoy’s argument to get ECB involved, the ECB President Mario Draghi indicated that the Rajoy was not calling on ECB to give the country funds to reduce its debt and suggested that liquidity could be provided through other means.

Disclaimer
Tradervox.com is not giving advice nor is qualified or licensed to provide financial advice. You must seek guidance from your personal advisors before acting on this information. While we try to ensure that all of the information provided on this website is kept up-to-date and accurate we accept no responsibility for any use made of the information provided. Opinions expressed at Tradervox.com are those of the individual authors and do not necessarily represent the opinion of Tradervox.com or its management. 

Article provided by TraderVox.com
Tradervox.com is a Forex News Portal that provides real-time news and analysis relating to the Currency Markets.
News and analysis are produced throughout the day by our in-house staff.
Follow us on twitter: www.twitter.com/tradervox

Market Review 28.5.12

Source: ForexYard

printprofile

The euro was able to stage a recovery against several of its main currency rivals during overnight trading due to Greek polls that showed pro-austerity political parties making gains ahead of elections next month.

This week, traders will want to monitor a batch of news out of the US, including the all-important Non-Farm Payrolls figure on Friday. Any better than expected data could help the USD against the euro and Japanese yen.

Main News for the Week

Monday
• Bank holidays in US, France, Germany and Switzerland
Tuesday
• US CB Consumer Confidence-14:00 GMT
Wednesday
• Italian 10-y Bond Auction
• US Pending Home Sales-14:00 GMT
Thursday
• US ADP Non-Farm Employment Change-12:15 GMT
• US Prelim GDP-12:30 GMT
• US Unemployment Claims-12:30 GMT
• EU Irish Stability Treaty Vote
Friday
• UK Manufacturing PMI-08:30 GMT
• US Non-Farm Employment Change-12:30 GMT
• US Unemployment Rate-12:30 GMT
• US ISM Manufacturing PMI-14:00 GMT

Read more forex news on our forex blog

Forex Market Analysis provided by ForexYard.

© 2006 by FxYard Ltd

Disclaimer: Trading Foreign Exchange carries a high level of risk and may not be suitable for all investors. There is a possibility that you could sustain a loss of all of your investment and therefore you should not invest money that you cannot afford to lose. You should be aware of all the risks associated with Foreign Exchange trading.

The Market Has Crashed, But This Graphite Stock Has More Than Doubled

By MoneyMorning.com.au

There’s always an opportunity to make money in the markets.

You just have to do the hard yards to find it.

Even in the current near 10% collapse in the stock market, some savvy investors have just doubled their money.


This didn’t involve short selling, or using any of the sophisticated trading you’d expect from a hedge fund. All they needed to know was which part of the market was about to take off…and buy the right stocks.

Even facing a slowdown in the US, the disintegration of Europe, and the very real prospect of China hitting the skids, there are still some parts of the market soaring.

So, what is this hot sector? And is there still time to get on board? Read on for more…

I’m talking about graphite.

You might have heard me discuss graphite before, as I’ve been following this story for a while now.

In last month’s Diggers and Drillers newsletter, I looked at Aussie graphite stocks and tipped one in particular. Readers that followed the tip are now sitting on gains of 105%, in the same time the market has fallen 7.4%.

This is exactly what I look for: investing opportunities the market has missed. In this case, the mainstream didn’t know anything about graphite. Some of them still don’t. Just this morning I read this drivel in The Age:

‘Consider also that Graphite’s price has quadrupled in the past four years and in your humble columnist’s opinion there is evidence of a bubble. Graphite’s worth as a commodity is not disputed. But from a supply perspective it is not hard to see tonnes of it coming on stream. Graphite is very easy to process, because it is simply pure carbon. You just crush carbon and then purify it using gravity.’

The most important point missed here is that there are different types of graphite.

The Right Type of Graphite to Invest In

The investing opportunity lies in FLAKE graphite. Its counterpart, amorphous graphite, is indeed a dime a dozen. But flake graphite is only found in a few places in the world.

It is rare.

What is even rarer is flake graphite that can be processed easily.

Put simply, graphite is found as a component of other rocks; typically it makes up 1%-20% of the volume. Extracting it can be complex, and in some rock types, it can be too expensive to be viable. So you can forget the fuzzy notion that ‘graphite is very easy to process, because it is simply pure carbon. You just crush carbon and then purify it using gravity.’

As for ‘tonnes of it coming on stream’…well…that’s generally the idea in mining.

However there are no significant new projects that will be ready to meet the rapidly growing demand. Smart operators saw this opportunity, so are out there looking for the stuff now. The number is growing because there is money to be made.

But the fact is the success rate for small-cap miners is around 5%. Most players will fall by the wayside. So an oversupply of flake graphite is very unlikely indeed.

The low success rate is the reason it’s so important to do a great deal of research. You need to filter out the duds at the start to give your investment the best chance of making gains.

The good news is the Aussie market has a few serious contenders. And while some are weighing in with uninformed and sensationalist talk of a bubble, the fact is that smart investors are still buying. It’s not just punters having a crack. Some of the largest resource funds from Australia, and also Canada, are lining up…

Graphite – The ‘Next’ Mineral Sands All Over Again?

The Canadian market has decades more experience with graphite than the Australian market. Its investors have a good appreciation of what to look for, and know the kind of money that could be made so it’s a big vote of confidence to see them weighing in already.

The graphite tip I suggested to readers has already more than doubled in a month. If they felt like it they could have the pleasure of selling a few shares to big name fund managers for a 100% mark-up. However this could mean missing out on much bigger gains. This show has just begun.

In fact, this stock reminds me of Iluka (ASX:ILU).

A few years back no one knew anything about its proposed commodity either – mineral sands. But the company found and developed the world’s dominant supply of the stuff, and grew from a minnow to a $5 BILLION company in the process.

Graphite Sector to Produce the Next Iluka?

Graphite Sector to Produce the Next Iluka?
Click here to enlarge

Source: Slipstream Trader


But as I mentioned, getting from explorer to producer is a difficult process.

Having the right ingredients greatly improves your chances. Having a large, high-grade resource, in a good jurisdiction, and sufficient infrastructure provides a very strong foundation.

And luckily for Aussie investors, one of the graphite stocks right here on our market has exactly that.

Dr. Alex Cowie
Editor, Diggers & Drillers

Related Articles

The Conference of the Year “After America” DVD

The Commodity to Prepare Your Portfolio for in a Post-China World

The Divergence of Oil and Natural Gas


The Market Has Crashed, But This Graphite Stock Has More Than Doubled

Use This Investment Strategy to Avoid ‘Panic Selling’ Your Stocks

By MoneyMorning.com.au

At the start of May, the market reached its highest level since November 2009. It could have been an excuse for stocks to go even higher, but that didn’t happen.

When shares go up, typically small-cap stocks lead the market higher. When shares go down, typically small-cap stocks lead the market lower.

You can see that reflected in the chart below.

ASX200

Source: CMC Markets

Now, we won’t focus on the causes of the falling market. You can put it down to a number of things: US unemployment and employment numbers; European national debt problems; European bank problems; commodities prices; and the Australian federal budget.

Instead, we’ll focus on what you should do when the market falls like this. Should you sell your stocks? Should you leave everything alone? Or should you buy more?

Well, we know it’s a trite saying, but the time to decide what to do when the market crashes is before the market crashes.

Making a decision to sell, hold or buy during a crash likely means you’ll get it wrong.

For instance, in our personal retirement portfolio we haven’t sold a single stock.

Why? Because we’re comfortable with how and where we’ve invested our money.

We have a bunch of cash earning interest (probably less interest thanks to the Reserve Bank of Australia’s interest rate manipulation), we have a few dividend paying stocks that are still paying a dividend, and we own a handful of micro-cap stocks that we know could either halve in value or double overnight.

Oh, and there are the gold and silver investments too.

In short, whatever the market conditions, we’re always looking to be a buyer rather than a seller.

If you find yourself selling a stock you own in this market, it most likely means you were over-invested in it. And it’s never a good idea to be in that position. All we can do is suggest you follow our advice and split your savings into ‘safe money’ and ‘punting money’.

We’ve outlined this idea here in Money Morning several times since the middle of last year. The breakdown looks like this:

Remember, this is just a suggestion. As an example, here’s how we’ve allocated our retirement savings: 35% cash and term deposits, 40% gold and silver, 15% dividend stocks, and 10% punting stocks.

But just because that suits us, doesn’t mean it will suit you. You may prefer to allocate more or less in each of these investments. It comes down to what you’re comfortable with.

The bottom line is to make sure that if you do want to sell a stock it’s always on your terms rather than when the market scares you into selling.

Kris Sayce

Editor, Australian Small-Cap Investigator

From the Archives…

Free of the Dragon: Why the Energy Market Doesn’t Need China
2012-05-25 – Kris Sayce

China Stirs Up Troubled Waters in the South China Sea
2012-05-24 – Dan Denning

How Chinese Stocks Are Fading Fast
2012-05-23 – Lars Henriksson

LNG: Why Australia Will Be a New Global Gas Leader
2012-05-22 – Dr. Kent Moors

A Shocking Week for China’s Economy
2012-04-21 – Dr. Alex Cowie


Use This Investment Strategy to Avoid ‘Panic Selling’ Your Stocks