The Income Investment I’d Recommend to Anyone With $1 Million (Or Much Less)

By Amy Calistri, GlobalDividends.com

Most of the people reading today’s issue don’t have a million dollars to invest.

It doesn’t matter. What I’m going to show you applies no matter how much money you have to invest — whether it’s $100 or $100 million.

I’ve simply used $1 million as an example because it’s a nice round number… and one that people often associate with wealth.

But there is a sad truth about a million dollars. Even that heady amount wouldn’t earn you much in regular income — if you put it to work in the “traditional” ways…

$900. That’s the most you will get each month if you put that $1 million into a 1-year CD, which, according to BankRate.com, is yielding just a shade above 1.0%. For comparison, the average Social Security check is $1,230 per month. In other words, you’d earn more from Social Security than you would from $1 million.

It’s a similar story with a number of other investments…

10-year Treasury Note — Sitting near historically low levels, if you loaned the federal government $1 million, with annual yields below 2.0%, you’d only earn $18,400 a year… or $1,840 a year on $100,000.

Savings Accounts — With a maximum yield of 1.0%, the absolute best you’ll get from a savings account right now is $10,000. And that is if you deposit your $1 million in the highest-yielding account currently listed on BankRate.com.

Corporate Bonds — If you invest in the right investment-grade corporate bonds, you could net a little more than 3.0% a year on $1 million — generating $32,710 a year in income. Not a bad amount of money to bring in each year, if it didn’t require a million-dollar investment. A portfolio of $100,000 would earn just $3,271 per year.

S&P 500 — You could also simply buy an index fund with your million dollars. With an average dividend yield of about 2.0%, you’d earn about $20,000 a year if you invested alongside the S&P 500.

The sad truth is that even with an enormous amount of money, your options for income in “traditional” investments don’t offer much to get excited about. But there is some good news you’ll also want to know…

Specifically, as I’ve told you the past few weeks, right now I’m earning more than $16,000 a year (or more than $1,300 a month)… and I’m doing it with a portfolio currently worth $250,000. If my portfolio were worth $1 million — four times as much — I’d be earning $72,000 per year. That’s considerably more than you can earn from Treasuries or CDs or the broader market. Take a look…

I’m not showing you this to brag about what I’m doing. Instead, I’m convinced that with returns from traditional income investments paying so little… a recent recession hurting investment accounts… and a Social Security system that simply doesn’t cover most people’s living expenses… it’s more important than ever to know about this way of investing — which I call my “Daily Paycheck” strategy.

The goal of my “Daily Paycheck” strategy is to collect a dividend payment for everyday of the year. The beauty is that it requires little fuss.

My portfolio includes master limited partnerships (MLPs), closed-end funds, blue-chips, exchange-traded bonds, and a number of other asset classes; all of which pay dividends, some even monthly rather than quarterly. In total, I’m earning an average yield of 7.2% on my portfolio.

How Much Can You Earn Each Year?
Simply Look For Your Portfolio Size

Portfolio Size:

$10,000$720
$25,000$1,800
$50,000$3,600
$100,000$7,200
$200,000$14,400
$500,000$36,000
$1,000,000$72,000

*Numbers based on 7.2% average yield (the current average yield of my portfolio). All investing carries risk and no results are guaranteed. The figures above will also be subject to taxes and commissions

You can see how much income that would mean for your portfolio by simply finding your portfolio size in the table to the right

Of course, there’s a big difference between holding a portfolio of dividend payers versus putting your money in a CD, Treasury, or even a broad index fund that tracks the S&P. I’ll be the first to tell you that there’s no safer investment than a Treasury bond. But you might be surprised how stable a “Daily Paycheck” portfolio can be.

Let me give you one example…

You likely remember the market sell-off that occurred back in August 2011. All the headlines were dour… investors all around the world were anxious about a potential default by Greece… high oil prices… budget problems in the United States and elsewhere… and soaring unemployment.

In the month of August alone, the S&P 500 lost 5.7%… a major move for one of the world’s most recognized indices.

My portfolio? Despite all the turmoil, I saw my account fall just 1.0% during the month. That’s just one-sixth the amount the broader market fell.

That’s not to say that my portfolio will always hold up as well, but I do like my odds. After all, the last time I checked, the S&P wasn’t throwing off thousands of dollars in income each month, helping to smooth out your returns no matter which way the market moves.

And there’s one more thing you can do if you’re still worried about risk that will still beat the income you earn from Treasuries or CDs.

I’ll continue with my example of $1 million (but remember, all these results are fully scalable depending on your portfolio size)…

Say you put half your investment — $500,000 — in a 5-year CD because you were worried about safety. From that money, you’d earn $8,750 a year. Then you can take the remainder and follow the “Daily Paycheck” strategy, which would generate an additional $36,000, based on current yields. Together, you’d generate nearly $45,000 per year — 155% more than you can get by investing all $1 million in a 5-year CD.

Now, there’s plenty more to share about my “Daily Paycheck” strategy… and I don’t have the space to include it all here. Instead, I’ve put together a special presentation that outlines how I’m earning this $1,357 per month income stream (and the brokerage statement to prove it). To view this free presentation — including a few high-yield picks to start your own “Daily Paycheck” portfolio — you can visit this link.

Always searching for your next paycheck,

Amy Calistri
Chief Investment Strategist — The Daily Paycheck

P.S. — Don’t miss a single issue! Add our address, [email protected], to your Address Book or Safe List. For instructions, go here.

Greek Political Impasse Leads to Euro Losses

Source: ForexYard

The euro started off yesterday’s trading session on a positive note following a better than expected German Prelim GDP figure which caused the EUR/USD to advance to 1.2868. That being said, the common currency came under pressure later in the day following another failed attempt by Greek politicians to form a new government, virtually guaranteeing new elections will take place next month. As a result, the euro fell as low as $1.2769 during the afternoon sessoin. Turning to today, traders will want to pay attention to the US FOMC Meeting Minutes, set to be released at 18:00 GMT. Any signs that the Federal Reserve is preparing for another round of quantitative easing could result in the greenback turning bearish.

Economic News

USD – US Manufacturing Data Sends USD/JPY Over 80.00

The combination of a better than expected US Empire State Manufacturing Index and additional Greek political worries gave the US dollar a boost against its main currency rivals during yesterday’s trading session. The EUR/USD fell close to 100 pips over the course of the European session, reaching as low as 1.2769 before staging a slight upward correction. Against the Japanese yen, the dollar was able to advance over 80.00 following the better than expected manufacturing report. Overall the USD/JPY was up over 20 pips during European trading.

Turning to today, dollar traders will want to several pieces of US news, including the Building Permits figure and FOMC Meeting Minutes. Should the building permits data come in above the forecasted 0.73M, the greenback may be able to advance further against the JPY. That being said, any gains the dollar makes could be short lived depending on if the FOMC hints at any future plans to initiate a new round of monetary easing to help boost the US economy.

EUR – Euro Extends Bearish Trend amid Additional Greek Problems

The inability of Greek politicians to form a new government resulted in calls for a new election, which increased investor fears that Greece could default on its debt and have to exit the euro-zone. In addition to losses taken against the US dollar, the common currency also fell against the safe-haven Japanese yen and British pound. The EUR/JPY dropped over 70 pips during the European session, reaching as low as 102.15. The EUR/GBP was down over 40 pips, reaching 0.7969 before staging a slight reversal late in the day.

Today, euro traders will want to pay attention to a speech from European Central Bank President Draghi, scheduled for 14:00 GMT. Given the recent political turmoil in Greece, investors will be carefully watching to see if the ECB President will say anything about the country’s chances of remaining in the euro-zone. Additionally, traders will also want to pay attention to the US FOMC Meeting Minutes. Any indication that the Fed is taking additional steps to boost the US economic recovery could help the euro recoup some of its recent losses against the greenback.

AUD – Risk Aversion Leads to Significant Aussie Losses

After seeing mild gains during early morning trading, the Australian dollar turned bearish against both the US dollar and Japanese yen amid risk aversion in the marketplace caused by Greek political worries. The AUD/USD dropped from a high of 1.0014 to 0.9952 over the course of the day. Against the JPY, the aussie fell over 50 pips, reaching as low as 79.59 before staging an upward correction. The AUD/JPY eventually settled around 79.95 during the afternoon session.

Today, traders will want to monitor any developments in the euro-zone, particularly with regards to the current crisis in Greece. Fears that the country will default on its debt and have to exit the euro-zone could lead to additional risk aversion in the marketplace, in which case the AUD could see further losses during the second half of the week.

Crude Oil – US Inventories Set to Impact Price of Crude Oil

After moving up as high as $95.44 a barrel, the price of crude oil turned bearish after investors began abandoning riskier assets amid Greek political concerns. The commodity fell as low as $94.30 before staging a slight upward correction and stabilizing around the $94.80 level.

Today may lead to additional volatility for crude oil, as investors continue to digest euro-zone news and its potential impact on the marketplace. In addition, the US Crude Oil Inventories figure could lead to additional losses if it comes in above expectations. US crude stockpiles are already near record highs, which analysts have interpreted as a sign of weaker demand in the world’s largest oil consuming country. Should today’s news come in above the forecasted 1.5M, oil may move downward.

Technical News

EUR/USD

The weekly chart’s Williams Percent Range has dropped into oversold territory, indicating that this pair could see upward movement in the coming days. This theory is supported by a bullish cross on the daily chart’s Slow Stochastic. Opening long positions may be a wise choice for this pair.

GBP/USD

The Bollinger Bands on the daily chart are narrowing, indicating that this pair could see a major shift in price in the near future. That being said, most other long term technical indicators are not providing clear signs as to what direction the shift will be. Taking a wait and see approach may be the best choice for this pair.

USD/JPY

A bullish cross on the weekly chart’s Slow Stochastic points to a possible upward correction in the coming days. This theory is supported by a bullish cross on the daily chart’s MACD/OsMA. This may be a good time for traders to open long positions.

USD/CHF

The Relative Strength Index on the daily chart is approaching the overbought zone, indicating that this pair could see downward movement in the near future. Additionally, the Williams Percent Range on the weekly chart has crossed above the -20 line. Traders may want to go short in their positions ahead of a possible bearish correction.

The Wild Card

Crude Oil

After steadily dropping over the last several weeks, technical indicators are now showing that crude oil is in oversold territory and could see an upward correction. A bullish cross has formed on the daily chart’s Slow Stochastic, while the Relative Strength Index has dropped below 30. Forex traders may want to go long in their positions ahead of a possible upward breach.

Forex Market Analysis provided by ForexYard.

© 2006 by FxYard Ltd

Disclaimer: Trading Foreign Exchange carries a high level of risk and may not be suitable for all investors. There is a possibility that you could sustain a loss of all of your investment and therefore you should not invest money that you cannot afford to lose. You should be aware of all the risks associated with Foreign Exchange trading.


FSA Glossary

Source: ForexYard

printprofile

System – Generic System Name – This is the default system name of the selected trading system that you added to your portfolio.

*Pips – Net pips accumulated by the system during the selected time frame.

*Pips/Trades – Equivalent to the average pips per trade. It indicates the average profit target on a system

MP – Max Positions – Is the number of positions that a system can hold in that system pair simultaneously. E.g. a system with 6 max positions can open 6 positions at the same time, therefore if a client trades this system at 0.1 lot, there is the potential that they could have 6 positions open at 0.1 lot (60k).

Pair – This is the currency pair that is being traded in the selected system.

# Trades – The total number of trades placed during the selected time frame.

*APT ($) – Average Profit Trade – Is a calculation of the gross profit divided by the number of profitable trades in USD terms.

ATT – Average Trade Time – Is the average holding period in hours of each trade.

Start Date – The day the system was added to the platform.

*Profit Factor – Shows how many times the gross profit exceeds the gross loss. The larger is this value, the better.

*ALT ($) – Average Losing Trade – Is a calculation of the gross loss divided by the number of losing trades in USD terms.

*LLT ($) – Largest Losing Trade – Is the trade that resulted in the largest loss in USD terms.

*Profit ($) – Profit or loss generated by a system using 100K trade sizes including carry costs.

*Max DD – Maximum Draw Down – The largest drop from net balance peak to net balance valley.

*LWT ($) – Largest Winning Trade – Is the trade that resulted in the largest profit in USD terms.

DIS – Days in System – The number of days since the system generated its first trading signal.

*PO – Pay Off – The expected Pay Off (the average profit per trade) is calculated by profit divided by the total number of trades.

*RAR – Risk Adjustment Rate – Is a direct measure of the return in pips divided by the maximum drawdown. For example, a RAR of 4 means that the system’s returns are 4 times greater than its maximum drawdown.

*Win % – The number of winning trades divided by the number of losing trades during the selected time frame.

Terms with an ( * ) beside them represent a field in which an average is made inside the FSA system. This average is not a gaurantee of profits/losses.

Risk Disclosure: The Forex Strategy Automator (FSA) does not gaurantee the profits shown in the averages calculated by its systems, and ForexYard does not take responsibility for any such losses. These averages represent a HYPOTHETICAL calculation, not an exact figure. Oftentimes, the actual results can be drastically different from these hypothetical calculations.

Trading foreign exchange on margin carries a high level of risk, and may not be suitable for all investors. Before deciding to trade foreign exchange you should carefully consider your investment objectives, level of experience, and risk appetite. The possibility exists that you could sustain a loss of some or all of your initial investment and therefore you should not invest money that you cannot afford to lose. You should be aware of all the risks associated with foreign exchange trading, and seek advice from an independent financial advisor if you have any doubts.

Forex Market Analysis provided by ForexYard.

© 2006 by FxYard Ltd

Disclaimer: Trading Foreign Exchange carries a high level of risk and may not be suitable for all investors. There is a possibility that you could sustain a loss of all of your investment and therefore you should not invest money that you cannot afford to lose. You should be aware of all the risks associated with Foreign Exchange trading.

Forex Glossary

Source: ForexYard

printprofile

Ask Price — sometimes called the Offer Price, this is the market price for traders to BUY currencies. Ask Prices are shown on the right side of a quote — e.g. EUR/USD 1.1965-68, means that one euro can be bought for 1.1968 US dollars.

Bar Chart — a type of chart used in Technical Analysis. Each time increment on the chart is displayed as a vertical bar which shows the following information: the top of the bar is the high price, the bottom of the bar is the low price, the horizontal line on the left of the bar shows the opening price and the horizontal line on the right of bar shows the closing price.

Base Currency — is the first currency in a currency pair. A quote shows how much the base currency is worth in the quote (second) currency. For example, in the quote — USD/JPY 112.13 — US dollars are the base currency, with 1 US dollar being worth 112.13 Japanese yen.

Bid Price — is the price a trader can SELL currencies. The Bid Price is shown on the left side of a quote — e.g. EUR/USD 1.1965-68 — means that one euro can be sold for 1.1965 UD dollars.

Bid/Ask Spread — is the difference between the bid price and the ask price in any currency quotation. The spread represents the broker’s fee, and varies from broker to broker.

Broker — an individual or firm that acts as an intermediary, putting together buyers and sellers for a fee or commission. In contrast, a ‘dealer’ commits capital and takes one side of a position, hoping to earn a spread (profit) by closing out the position in a subsequent trade with another party.

Cable – Trader jargon referring to the Sterling/US Dollar exchange rate. So called because the rate was originally transmitted via a trans-Atlantic cable beginning in the mid-1800’s.

Candlestick Chart — A type of chart used in Technical Analysis. Each time increment on the chart is displayed as a candlestick — a red or green vertical bar with extensions above and below the candlestick body. The top of the extension shows the highest price for the chart division and the bottom of the extension shows the lowest price. Red candlesticks indicate a lower closing price than opening price, and green candlesticks indicate the opposite.

Cross Currency — A currency pair that does not include US dollars — e.g. EUR/GBP.

Currency Pair — Two currencies involved in a FOREX transaction — e.g. EUR/USD.

Economic Indicator — A statistical report issued by governments or academic institutions indicating economic conditions within a country.

Foreign Exchange (FOREX, FX) — Simultaneously buying one currency and selling another.

Fundamental Analysis — Analysis of political and economic conditions that can affect currency prices.

Leverage — the ratio in which a trader can borrow funds to increase the movement of his profits/losses. A common leverage amount for FOREX trading is 1:100 — you can trade currency worth 100 times the amount of your deposit.

Limit Order — An order to buy/sell when the price reaches a specified level.

Lot — The size of a FOREX transaction. Standard lots are worth about 100,000 US dollars.

Major Currency — The US Dollar (USD), Euro (EUR), Swiss Franc (CHF), British Pound (GBP), and the Japanese Yen (JPY) are considered to be the Major Currencies.

Order Cancels Order (OCO) — Two orders placed simultaneously with instructions to cancel the second order on execution of the first.

Open Position — an active trade that has not been closed.

Pips — the smallest unit a currency can be traded in.

Quote Currency — the second currency in a currency pair. In the currency pair EUR/USD the dollar is the quote currency.

Rollover — Extending the settlement time of spot deals to the current delivery date. The cost of rollover is calculated using swap points based on interest rate differentials.

Technical Analysis — Analysis of historical market data to predict future movements in the market.
Tick — The minimum change in price.

Transaction Cost — The cost of a FOREX transaction — typically the spread between the bid and ask prices.

Volatility — A statistical measure indicating the tendency of sharp price movements within a period of time.

For information regarding ForexYard, click here.

Forex Market Analysis provided by ForexYard.

© 2006 by FxYard Ltd

Disclaimer: Trading Foreign Exchange carries a high level of risk and may not be suitable for all investors. There is a possibility that you could sustain a loss of all of your investment and therefore you should not invest money that you cannot afford to lose. You should be aware of all the risks associated with Foreign Exchange trading.

Central Bank News Link List – 16 May 2012

By Central Bank News
Here's today's Central Bank News link list, click through if you missed the previous central bank news link list.  Remember, if you want to submit links for inclusion in the daily link list, just email them through to us or post them in the comments section below.

Get in Early to Shale Gas

By MoneyMorning.com.au

One of the buzzwords at this week’s Australian Petroleum Producer and Explorer Association (APPEA) conference is ‘Shale’.

And specifically, shale gas.

If you’re not familiar with it, shale gas is gas that’s trapped within deep shale rock formations. Until recently, it was almost impossible to recover this gas.

But technological advances mean natural gas companies can now access this gas. To the extent that it’s now revolutionizing the energy world right before your eyes.

The US Shale Gas Story

Nowhere has it had a bigger impact than in the United States. Less than 10 years ago, the US faced an energy crisis. Today they have more natural gas than they know what to do with.

Based on what I’ve heard this week at the ‘oil and gas show’, Australia has a chance to follow the same path. And that could be great news for you, if you get in early…

Shale gas already makes up 30% of the US gas supply. By the end of the decade, it could reach 50%.

The rapid success of shale gas exploration and production means cheap natural gas for the US. Really cheap!

Just four years ago, gas was USD$14 per million British thermal units (mmBtu). Last month, it fell below USD$2 mmBtu. This cheap energy can make life tough for the producers, but is a gift for the US economy.

The benefits go beyond affordable heating, transport, and more competitive manufacturing. It also creates jobs.

According to J. Michael Jaeger, the CEO of BHP Billiton Petroleum, ‘the unconventional energy sector has been responsible for 600,000 new jobs in recent years, and this is set to increase to 850,000.’

And by his estimates, the sector adds USD$100 billion to the US economy each year.

But this American energy revolution didn’t come easy.

In North America between 2008 and 2011, explorers drilled 15,000 shale gas wells. That takes a lot of investment, a lot of time and a lot of risk.

Abundant Shale Gas Basins

But, as you can see on the map below, you’ll find shale basins all over the world. Canada, Brazil, Argentina, South Africa, Europe, China, and of course…Australia.

Shale gas regions are not hard to find

Shale gas regions
Source: EIA

But in the time the North Americans drilled 15,000 wells and ensured cheap gas for decades to come, how much progress has the rest of the world made?

Less than 100 wells drilled.

So Australia has a lot of catching up to do. But it’s making tracks.

The Australian Shale Gas Story – Still in Early Stages

The market has embraced the shale story. Aussie shale stocks like Buru Energy (ASX: BRU) have gone up eight–fold in the last two years.

It’s an exciting start, but there’s still a long way to go for the Aussie shale industry.

And the best time to get in is before the industry becomes mainstream…before local explorers have drilled 15,000 wells.

My old pal, Australian Wealth Gameplan editor, Dan Denning knows this. Dan first wrote about shale gas in 2005.

This is what he wrote at the time:

‘If the U.S. government is eventually going to pump billions of dollars into the development of the shale industry, with the goal of national energy independence, I want to figure out who’s going to benefit the most…

‘…I’d rather be ahead than behind on the shale curve.’

He was ahead of the curve. Back then, the US produced less than two billion cubic feet (bcf) of shale gas per day.

This year the US is set to produce nearly 25 bcf of shale gas per day.

And last year he tipped a handful of Aussie stocks that he thought would benefit from the Aussie shale gas story.

But the real billion–dollar–question is, can we recreate North America’s success with shale gas, here in Australia?

We have the potential, but there are some big differences between Australia and the US.

Shale Gas With an Oil Kicker?

Research and Consulting Service, Wood Mackenzie, asked this question at the conference this week. The good news is they reckon it can be done.

The bad news is a number of stars need to align first.

First, explorers need to do much more drilling to see if the geology is right, and whether it’s possible to produce natural gas commercially.

Then there’s the issue of support services. It’s still a new game here, and, unlike in other resources sectors, we don’t have all the players, expertise and equipment to get the job done.

Remote locations, and the wet season, add an extra challenge.

We also need to ask the question — does Australia even need shale gas?

We have plenty of conventional natural gas already. Then we have the Coal Seam Gas industry, which is still growing, and now meets 40% of East Coast Australia’s natural gas needs. And, as I mentioned yesterday, the LNG industry is already set to triple production in the next six years.

So where does shale gas fit in to the Australian energy mix?

As with everything, it depends on the production cost. If it’s cheap enough, Australia can enjoy even more affordable natural gas, and could turn it into another export revenue stream.

But shale gas isn’t the only opportunity. The real money–spinner could be in ‘shale oil‘.

Shale Oil – ‘Liquid Rich’

They call shale ‘liquids rich’ when it contains oil. Oil is more profitable, and easier to export. Finding it in Aussie shale plays could help kick–start the development of a profitable Aussie shale industry.

The biggest opportunities for shale oil are in the Canning, Cooper and Georgina basins. They each have ‘liquids’ potential, but so far no–one has struck shale oil yet, only shale gas.

There’s a lot of Australian shale exploration planned this year. Joint ventures between small Aussie companies and giant overseas firms are drilling the better–known ‘Canning basin’ in WA and ‘Cooper Basin’ in South East QLD.

Drilling and hydraulic fracturing (fracking) is also taking place in the Georgina Basin in the Northern Territory, Gippsland in Victoria, and Galilee Basin in Queensland.

Back when the US shale boom was at this early stage, land was cheap.

Today, US shale acreage valuations are through the roof. Early investors in the right projects scored big.

This is probably why you see big players like Mitsubishi (TYO: 8058), BG Group (LON: BG), ConocoPhillips (NYSE: COP) and Hess Corp. (NYSE: HES) moving in early on the Aussie shale gas story.

And ConocoPhillips for one says it wants more.

With big companies getting in at the ground floor — and with so much focus on the sector at Australia’s largest oil and gas conference — it already looks like the shale sector is set to be Australia’s next resources boom.

Dr. Alex Cowie
Editor, Diggers and Drillers

Related Articles

The Conference of the Year "After America" DVD

APPEA – Day One at the Oil & Gas Show: Sand Dunes, Scuba Diving and Camels

Why Europe Will Ditch Green Energy


Get in Early to Shale Gas

How Central Banks Are Delivering A Financial Repression

By MoneyMorning.com.au

Imagine you are one of two people playing Monopoly. While you follow the rules religiously, the other player, who also happens to be the banker, does not.

He routinely appropriates properties. If he doesn’t like the score on the dice, he simply changes them. He continually takes as much money from the bank as he likes. Whenever the rules don’t suit he arbitrarily alters them in his favour.

Oh, and he hates to lose. Rather than concede defeat, he is perfectly willing to set fire to the table.

Imagine no longer. This is the state of the financial markets. You are playing against the world’s central banks.

For some time now, the Financial Times has been running articles (under the inauspicious label of ‘Collateral Damage’) discussing the merits or demerits of central banking. Only one contributor, Ron Paul, has challenged the status quo:

"[W]hile socialism and centralised economic planning have largely been rejected by free–market economists, the myth persists that central banks are a necessary component of market economies."

Every other contributor thus far has sought to defend central banking as a necessary part of the system… a view that seems categorically embraced by most people. In browsing through the comments of Dr. Paul’s FT article, for example, one reader posted:

"The problem with blindly accepting Dr Paul’s diagnosis is that he lacks the necessary qualifications to make a diagnosis. Would you trust a medical diagnosis made by Ben Bernanke, Mario Draghi or Mervyn King?"

No, I wouldn’t. But I wouldn’t trust an economic diagnosis from any of those individuals either. Given their track records, why would anyone?

No Central Banks

Getting rid of central banks (over time, let us be realistic) would have several effects.

First, it would require insolvent commercial or investment banks to fail properly, as opposed to feeding off the blood of taxpayers indefinitely.

As an example, lest anyone regard the $2 billion loss recently announced by JP Morgan as comparatively trivial, it should perhaps be seen in the context of the same bank’s overall derivatives exposure, which is shown graphically below.

JP Morgan’s total derivatives exposure stands at $70.1 trillion, or roughly the same size as the entire world economy. Each of the $1 trillion towers in the image is double–stacked to a height of 930 feet (283 meters).

Second, eliminating central banks would require governments to balance their books, no longer able to monetize the debt through its relations with the central banker.

Third, asset prices would revert to being determined by the market, and not by unelected economists serving the interests of bankers and politicians.

As this is clearly not going to happen anytime soon, most investment managers seem content to embrace the system and continue playing the cards they’ve been dealt.

To give you an example, the FT reported that, last year, US pension funds for the very first time put more of their assets into bonds as opposed to equities.

Like many investors, these fund managers fail to understand the risks they’re running and seem to have accepted the convention that nothing could possibly go wrong while central bankers are in charge.

Yet with Treasury yields as low as they are, this is unlikely to end well. The chart below shows the impact on investors who purchased British Gilts during the stagflation suffered in the UK during the 1970s.

Real UK Gilt Losses (Jan73 – Dec 07)

Investors who bought conventional Gilts in 1973 had to wait for 12 years to earn a positive real return on their investment. And this is exactly the sort of financial repression we have to look forward to under the current system controlled by the political and central banking elite.

Tim Price
Contributing Editor, Money Morning

Publisher’s Note: This article originally appeared in Sovereign Man: Notes From the Field

From the Archives…

What Newton Knew About House Prices …That the IMF Should
2012–05–11 – Kris Sayce

Why a Greek Exit From the Eurozone Could Be Great News For Markets
2012–05–10 – John Stepek

Why Europe Will Ditch Green Energy
2012–05–09 – Kris Sayce

Why It’s Time to Buy Gold
2012–05–08 – Dr. Alex Cowie

Why You Should Be Watching Japan’s Economy
2012–04–07 – Dan Denning

For editorial enquiries and feedback, email [email protected]


How Central Banks Are Delivering A Financial Repression

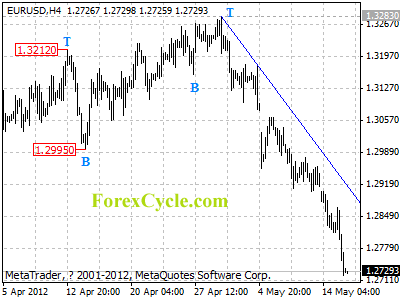
EURUSD’s downward movement extends to 1.2722

EURUSD’s downward movement from 1.3283 extends to as low as 1.2722. Further decline could be seen after a minor consolidation, and next target would be at 1.2650 area. Resistance is at 1.2800, followed by the downward trend line on 4-hour chart, only a clear break above the trend line resistance could signal completion of the downtrend.

eurusd

Daily Forex Analysis

Charles Sizemore in The Wall Street Journal’s SmartMoney

By The Sizemore Letter

Charles Sizemore gave his views on the market’s recent volatility to SmartMoney’s Quentin Fottrell:

Including today, stocks have fallen 8 days out of the last 9 – with last week the Dow posting its worst five-day stretch in five months… Financial advisers say the latest worries among investors makes sense. “The past 5 years of volatility has shattered confidence in the markets,” says Charles Sizemore, a financial adviser in Dallas, Texas, “and with the steady stream of gloomy news coming out of Europe, sentiment has only gotten worse.” Trading volume has been abnormally low for last year as many investors move to the “perceived safety of bonds from the perceived riskiness of stocks,” he says.

Still, many advisers are trying to prevent clients from selling, pointing out that broader economic trends favor stocks. For example, consumer confidence in May rose to the highest level in 4 years, according to Thomson Reuters/University of Michigan preliminary index. Meanwhile, labor’s share of income in the U.S. — in other words, corporate profits — is at an historic low, which Glenn Guard, director of investment management at Alexandria, Va.-based Campbell Wealth Management, says suggests that corporations have strong balance sheets and have the ability to hire. “We’re going to see a de-coupling of the economies in the U.S. and Europe,” with the U.S. markets outperforming in the near future.

In fact, some see the latest market drop as buying opportunity. Guard suggests “high quality, global dividend-paying stocks” such as Procter & Gamble (PG). “They’re selling Tide detergent to the Chinese and Crest toothpaste to the Brazilians,” he says. Sizemore also favors dividend-payers currently trading at low prices relative to earnings, including Microsoft (MSFT), Intel (INTC) and Johnson & Johnson (JNJ).


To view to full article, click here.

EUR/USD continues the downtrend, looking at 1.2700 next

The Euro continues to get sold off heavily again in today’s forex trading as Greece talks for a unity government collapsed today. Greece will now have to hold new elections and their is loud speculation of the Greeks leaving the euro currency.

The EUR/USD fell to the lowest level since the middle of January and looks to test 1.2700 soon. The low for the year was registered on January 13th at 1.2623.

EURO US Dollar