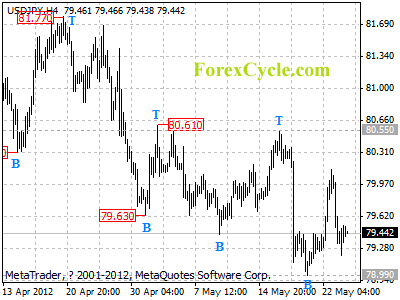
USDJPY moves sideways in a rang between 78.99 and 80.61. As long as 80.61 key resistance holds, the price action in the range is treated as consolidation of the downtrend from 84.17 (Mar 15 high), and one more fall towards 78.00 is still possible after consolidation. However, a break above 80.61 will indicate that the downward movement from 84.17 has completed at 78.99 already, and the target for the following upward movement would be at 83.00 area.
Christmas May Come Early This Year
It’s a little early for Christmas in July, but now is the time for investors to be putting together their “Christmas lists” of sorts.
Recently, I wrote a piece that described an old investment strategy of Sir John Templeton (see “An Anniversary We’d Prefer to Forget”). Sir John would make a list of companies he’d love to own “if only” they fell to a more attractive price. He would then place limit orders to buy those companies at prices substantially below the current market price. In the event of a sharp selloff, the limit ordered would be executed, and Sir John would have his shares at the prices he always wanted.
His rationale for the strategy was simple enough: we humans are instinctively herd animals, and we tend to panic when we see others around us panicking. We lose our independent judgment and we freeze in fear at exactly the moment we should be buying aggressively. Templeton’s move was designed to take his own emotions out of the equation; Sir John understood his own human shortcomings, and essentially gamed himself.
Today, with Europe teetering on the edge of a potential meltdown, I’m going to recommend that investors take a similar approach, though mine has the added bonus of adding a little extra income.
I recommend that you make a list of strong multinational companies based in Europe that you are confident can survive Armageddon with their businesses intact. Ideally, these companies would have significant percentages of their revenues coming from outside of the Eurozone.
Once you have your list of stocks, consider selling deep out-of-the-money puts on them. If prices remain relatively stable or rise, the options expire worthless and you pocket the premium. And if the share prices take a nosedive, the options will be exercised and you will be obligated to buy the shares at the prevailing market price—which was your objective all along. And you still get to pocket the premium.
Here a little explanation is needed. When you buy an option, whether it be a call or put, your risk is limited to the price you paid for the options. You are buying the right to buy or sell shares at a given price, not the obligation.
Selling, however, is a much trickier business. Your upside is limited to the premium at the time you sell the option. But your downside is much, much bigger. In fact, when selling a naked call option, your risk is theoretically infinite. For example, if you sell the right to buy Facebook (Nasdaq:$FB) at $38 to another investor and the stock rises to $100 the next day, you’re on the hook to buy at the prevailing market rate of $100 and sell at $38. Not an appealing prospect.
Likewise, when you sell a put, you are giving an investor the right to sell you shares at a price that might be far higher than the prevailing market price. So, when selling put options on your list of European stocks you’d like to own, make sure that you have the cash on hand to handle the trade if it is exercised. Don’t get greedy and sell contracts for more shares than you can afford to buy or that you would ideally like to own.
I’m not going to recommend specific put option contracts for you to sell because the entire point of this article was for you to create a list of stocks you like at prices you want to pay. I also want the advice in this article to be general and something that you can use months or years from now; recommending a specific contract would make this article too short-term for my liking.
I will, however, toss out a few company names for you to consider. Last week, I recommended Spanish bluechips Telefonica (NYSE: $TEF), Iberdrola (Pink:$IBDRY)and Banco Santander (NYSE:$STD) (see “Bargain Hunting in Spain”).
I continue to like all three, and to this list I would add French oil major Total (NYSE:$TOT) and British telecom giant Vodafone (NYSE:$VOD). While Vodafone is not a Eurozone stock, it has significant operations in the Eurozone and I would expect its share price to take a tumble in a general market rout.
If you’re not comfortable with options, that’s ok. You can accomplish essentially the same thing by placing limit orders like Templeton.
Disclosures: Sizemore Capital has positions in TEF.
This article first appeared on MarketWatch.
Position Yourself for the Rest of “Conquer the Crash”
The earlier you prepare, the better
By Elliott Wave International
To this day, I wonder why Robert Prechter’s book Conquer the Crash has not been more widely recognized. It described in advance much of what happened in the 2008 financial crisis.
Published in 2002, the book provided detailed descriptions of then-future economic scenarios. They were detailed vs. general. Prechter was specific in a way that would prove right or wrong; there was no gray.
This is from the book:
There are five major conditions in place at many banks that pose a danger: (1) low liquidity levels, (2) dangerous exposure to leveraged derivatives, (3) the optimistic safety ratings of banks’ debt investments, (4) the inflated values of the property that borrowers have put up as collateral on loans and (5) the substantial size of the mortgages that their clients hold compared both to those property values and to the clients’ potential inability to pay under adverse circumstances. All of these conditions compound the risk to the banking system of deflation and depression.
Conquer the Crash, second edition, (p. 179)
That’s just one excerpt about one topic in a 456-page text. Perhaps you see why I believe the book deserves more credit. Yet even that one paragraph from the book turned out to be a virtual mirror of what came to pass. And much of what he predicted is unfolding today: the JPMorgan trading fiasco, massive withdrawals at Greek banks, downgrades of Italian and Spanish banks and much more. Those are just a few headlines.
The broader point is that Conquer the Crash prepared its readers. Around the time the book’s second edition published in 2009, the Chicago Sun-Times remarked
And the credit implosion is still not over. Please take a look at the chart:
In the Conquer the Crash quote in the first part of this article, you’ll notice the last three words are “deflation and depression.”
The world has yet to completely pass through these economic valleys.
This article was syndicated by Elliott Wave International and was originally published under the headline Position Yourself for the Rest of “Conquer the Crash”. EWI is the world’s largest market forecasting firm. Its staff of full-time analysts led by Chartered Market Technician Robert Prechter provides 24-hour-a-day market analysis to institutional and private investors around the world.
Have the Small Cap Stocks Bottomed Yet?
David A. Banister- Chief Strategist- Markettrendforecast.com and ActiveTradingPartners.com
The IWM ETF represents the Russell 2000 small cap growth index. This ETF peaked at 84.66 this spring and has fallen in the the 74′s before the recent two day bounce. What we are looking at is a possible 5 wave rally from October into March, and now a possible 3 wave correction (Wave 2) of 38-50% of that entire 5 wave rally. Elliott Wave theory is broken down into 5 wave and 3 wave movements in the markets and individual stocks, where a full 5 wave pattern in a Bull market is obviously bullish and a 3 wave pattern corrective of the prior 5 wave rally.
The small cap index peaked with the reset of the market in March of this year, interestingly about 3 years into the Bull Market. The first low so far was a typical 38% fibonacci retracement of the rally from October through early March. The next low pivot would be a 50% pullback. This would place the IWM target around 72.10 plus minus some pennies.
In the 72′s that would represent a C wave decline that is equivalent to 161% of the A wave decline in the chart below from the 84.66 highs. ABC declines are common in a Bull cycle and are designed to throw investors off the back of the Bull. Normally the C wave is where investors finally throw in the towel near the bottom, as we saw in early October of 2011. I wrote an article on October 3rd last year, one day before the bottom outlining why a massive rally was about to ensue. Will we see the same thing now?
Well, this correction could indicate one more possible decline of 4-5% worst case should this projection in the chart below fulfill.
That said, the 38% retracement we have had so far would also qualify as a Wave 2 low last Friday. Therefore, this outline is to give you some indications of what to watch in case we drop further and pierce those lows. If we can hold this rally and rebound smartly again, then the C wave of the ABC is likely over and we can get an all clear to be more aggressive.
Join us at www.markettrendforecast.com for weekly reports and or a subscription and a 33% discount!
The Ins and Outs of International Investing
What do BMW, Burberry and Prada have in common?
Well, yes, all three are European companies with an old pedigree that produce highly-sought-after luxury goods, but besides that?
Unlike some of their peers—such as Daimler AG ($DDAIF) or Moet Hennessey Louis Vuitton ($LVMUY), none trade in the United States as a liquid ADR.
In addition to trading on German and French exchanges, respectively, both DDAIF and LVMH trade in the American over-the-counter pink sheets. Plenty of other European firms trade on the New York Stock Exchange or Nasdaq—including household names like Britain’s Vodafone ($VOD) and Spain’s Telefonica ($TEF) and Banco Santander ($STD), to name a few.
The world of ADRs is not limited to European companies, of course. China Mobile ($CHL), Turkcell ($TKC), and AmBev ($ABV) all trade as U.S. ADRs and hail from China, Turkey and Brazil, respectively. And there are hundreds more.
In contrast, BMW trades on the Xetra in Germany, Burberry trades on the London Stock Exchange, and Prada trades in Hong Kong of all places. Buying shares requires having a broker with access to these markets; a seat at the New York Stock Exchange will not suffice.
For the uninitiated in international investing, this requires a little explanation. An American Depository Receipt (“ADR”) is a security trading in the U.S. markets that represents shares of a non-U.S. company. The shares trade in U.S. dollars and pay any dividends in U.S. dollars. Aside from the occasional withholding of foreign dividends for tax purposes, a U.S. investor will generally notice no difference between holding an ADR and holding a regular U.S. stock.
Companies have their own assorted reasons for going the ADR route, but for most it is a matter of prestige and access to capital. As the largest and most liquid market in the world, the United States has been a favored place for multinational giants to raise capital for decades. In fact, the first ADR was issued as far back as 1927, for the British retailer Selfridges.
For investors, the rationale is much the same. Historically, it has been difficult for Americans to buy shares of locally-traded foreign firms. You would either need a broker in that country or a full-service U.S. broker with access to those markets, and in either event you are dealing with time zone differences, currency differences, higher trading costs and often times a serious lack of information about the stock you’re wanting to trade.
Buying the stock as an ADR alleviates these concerns and also potentially gives you better corporate governance. Sponsored ADRs trading on the NYSE (as opposed to those trading over the counter on the pink sheets) have essentially the same reporting requirements as listed U.S. firms.
For all of these reasons, ADRs are usually the best option for U.S. investors when given the choice. All else equal, I’d prefer to buy the Daimler ADR than to buy the German-traded shares.
But you shouldn’t limit yourself to the world of ADRs. Doing so may eliminate some otherwise great investment opportunities.
Consider BMW, which I mentioned above. I love BMW for precisely the same reasons I like Daimler. Luxury German cars are an aspirational status symbol around the world, but particularly in emerging markets. I consider BMW a fine “backdoor” way to profit from the rise of China’s nouveau riche, and the company’s operating results have been nothing short of stellar even in the midst of a European debt crisis. BMW had record profits in 2011 and raised its dividend to a new record level. More rises are likely. I’d prefer the ease of buying BMW as an ADR, but I would be perfectly comfortable buying it on the German exchange as well.
Much the same could be said for the two fashion brands I mentioned above. I love ADR-traded LVMH as an indirect bet on emerging market growth. But if I love LVMH, why would I also not love Burberry or Prada? All three companies are wildly profitable, have incredible brand equity and cater to the taste of high-income earners in Asia and elsewhere.
As capital markets become more globally integrated and information more dispersed, the barriers to buying and selling locally-traded shares are getting smaller. Most large, foreign blue chip companies publish their annual reports in an English version, and even for those that do not there is usually ample data available to help you in your decision making. Reporting standards do vary from country to country, but this should be no impediment to a motivated investor willing to roll up his sleeves and do a little research.
The logistics of trading have also gotten easier. These days, even many discount brokers offer some level of access to foreign-traded shares. To give two examples, Sizemore Capital primarily uses Interactive Brokers and Scottrade for trading and custody. Interactive Brokers allows me to buy or sell on virtually any major exchange in the world and to hold my cash balances in any major world currency. Scottrade’s international options are a little more limited, but Scottrade too allows for trading in a handful of foreign markets. Depending on the market in question, the trading commissions at both brokers are often about the same as they would be for regular domestic stocks.
Sure, it can be a little confusing at times when you look at your account statement and see that you just received a dividend denominated in, say, Norwegian kroner. But this is nothing to be afraid of and your broker will usually exchange it into dollars for you automatically.
Bottom line: In a world in which companies and their customers know no national boundaries, investors too should be willing to invest globally.
As a side note about over-the-counter ADRs, a lot of investors are put off by buying something on the pink sheets. I understand completely.
The pink sheets are notorious for being the home of micro-cap pump-and-dump scams, and I would never recommend that investors walk into that minefield. But it is important to view ADRs on a case-by-case basis. Daimler and LVMH have more than ample size and liquidity to trade on the New York Stock Exchange, as would Swiss confectionary giant Nestle ($NSRGY). They instead choose to go the pink sheet route because they don’t want to deal with the expensive headaches of dealing with Sarbanes-Oxley and other recent U.S. legislation. They trade on well-regulated exchanges in Europe, so their lack of regulation here is nothing I would consider a red flag. But in the case of, say, Russian gas giant Gazprom ($OGZPY), the lack of governance would be something I’d have to take into consideration.
Disclosures: Sizemore Capital currently holds long positions in CHL, DDAIF, LVMUY , NSRGY,TEF and TKC
Just How Green is Google
Google may have a bad track record on privacy practices, but when it comes to green, the internet giant is clean, racking up over $850 million in investments to develop and deploy clean energy and earning the top spot on Greenpeace’s list of IT giants who are using and advocating for clean energy.
In February, Greenpeace ranked Google the best on its “Cool IT Leaderboard”, although it only scored 53 out of 100 points on the ranking system, still putting it ahead of Cisco, with 49 points. But it was a reluctant gift from Greenpeace, which has been hounding the IT giant for some time over its long overdue moves to shift to green and to use its influence and outreach to advocate for renewable energy.
Google may have gotten off to a slow green start, but in the long term, the IT giant should benefit from the move. It is now sourcing more than 20% of its global energy use from green sources such as solar and wind. As a major consumer of energy, reducing consumption will help its profit margins and its clean energy efforts should boost its public image at a time when Google is mired in litigation over privacy practices.
And Google’s influence should not be underestimated, which is something Greenpeace understands well. Not only is Google going green, it’s also dabbling in policy initiatives, offering up its own clean energy proposals for government consideration (such as a plan to remove US dependency on fossil fuels entirely within 22 years).
So far, Google has invested $10 million in two solar companies, eSolar and Brightsource, and has created a $280 million fund with SolarCity in California to install solar panels in 9,000 homes on a lease option. The IT giant has invested another $15 million in wind energy, and $10 million in enhanced geothermal systems. Most significantly, Google Ventures has launched a $100 million venture capital fund for innovative clean technology start-ups. Beyond that, the IT giant is seeking to foray into the utility sector by applying for a license to sell bulk electricity. Smart grids and plug-in cars are also on its list of green projects, as are a number of riskier ventures, including work on a heliostat – a mirrored device that directs the sun’s rays to create thermal energy – and high-altitude flying wind turbines.
While Google and other IT giants such as Cisco, Ericsson and Dell top Greenpeace’s clean energy use and advocacy list, the environmental groups says that there is still an insufficient amount of movement in terms of addressing pollution. “Google tops the table because it’s putting its money where its mouth is by pumping investment into renewable energy,” Greenpeace International analyst Gary Cook told reporters upon the release of the “Cool IT Leaderboard.” However, he said, while the IT industry is driving significant energy demand with its data centers and global infrastructure, when it comes to addressing pollution, action has been slow.
Certainly, Google’s original plans for energy have been scaled down, and many of the more eclectic projects the company once envisioned have been cancelled as results were not forthcoming as predicted. Still, the company is now investing more in clean energy than ever – in fact, ten times more than in 2010. This is a remarkable sum for an IT company when you compare it to renewable energy investments in energy giants such as BP, for instance, which invested around $1.6 billion in 2010. Google’s focus has shifted from the eclectic to the practical, a shift most clearly seen in its drive to deploy commercial solar panels and wind turbines – investments that promise a return.
In the realm of clean energy and the US drive to reduce dependency on foreign fuel imports, Google and other IT giants could wield a significant amount of influence, both on the public and on policy. Now that that IT giants are largely on board with the clean energy initiative – though the jury is still out on Apple and Oracle – this momentum should pick up pace.
By Jen Alic of Oilprice.com
Pound Drops against Dollar on Inflation Data
By TraderVox.com
Tradervox (Dublin) -The sterling pound has been the best performer in the last three months increasing by 4.8 percent over the period. However, the current upward trend has changed today after government data showed that the inflation dropped in April more than the market was expecting. The pound fell against the greenback after extending gains for the last three days. Further, the sterling weakened after the International Monetary Fund recommended that Bank of England should resume its quantitative easing program to spur economic growth in the country.
The current European crisis is seen as a hindrance to economic growth and the strengthening pound was bound to hurt exports into the 17-nation trading bloc which takes 40 percent of UK’s exports. However, today’s inflation data will ease the pound’s surge which is good for the UK economy. According to Lee McDarby of Investec Bank Plc in London, the recent run has made the market long for an opportunity to sell and the inflation data provides that opportunity.
According to a report from the IMF, the Bank of England should embark on a program to inject more stimulus into the economy as the recent European crisis will derail the recovery. The IMF suggested quantitative easing or cutting interest rates as the possible ways the bank might take to ensure economic growth. However, BOE policy makers stopped the quantitative easing program this month after injecting 325 billion pounds into the economy. The minutes of their meeting of May 9-10 will be released tomorrow where investors will try to establish the bank’s stand on monetary easing program.
After the release of the inflation data, the sterling pound dropped by 0.2 percent against the dollar to exchange at $1.5789; the pound had fallen to $1.5733 on May 18 which is the lowest it had been since March 16. However, the Great Britain Pound gained by 0.2 percent against the euro to trade at 80.75 pence per euro.
Disclaimer
Tradervox.com is not giving advice nor is qualified or licensed to provide financial advice. You must seek guidance from your personal advisors before acting on this information. While we try to ensure that all of the information provided on this website is kept up-to-date and accurate we accept no responsibility for any use made of the information provided. Opinions expressed at Tradervox.com are those of the individual authors and do not necessarily represent the opinion of Tradervox.com or its management.
Article provided by TraderVox.com
Tradervox.com is a Forex News Portal that provides real-time news and analysis relating to the Currency Markets.
News and analysis are produced throughout the day by our in-house staff.
Follow us on twitter: www.twitter.com/tradervox
Gold & Silver Long-Term Signal
By JW Jones – Traders Video Playbook
“The selfish they’re all standing in line
Faithing and hoping to buy themselves time
Me, I figure as each breath goes by
I only own my mind.”
~ Pearl Jam, I Am Mine ~
Long time readers know that I have been and remain bullish on gold and gold stocks in the longer-term. However, the reasons why I believe gold and silver will perform well in the longer-term are a bit different than what many economists and pundits are expecting.
I am a contrarian by nature. I generally try to do the opposite of the crowd in every situation I find myself regardless of whether I am in a movie theater or trading options. Before getting into the gold and gold miners analysis, I thought I would explain my position publicly to readers. I do not consider myself an expert economist, but I try to read those who many consider to be experts looking for similarities in their viewpoints and expectations.
The herd mentality exists in financial markets and a similar behavior exists among economists. Most economists in the mainstream media today tend to be Keynesians or neo-classical economists. Both viewpoints are generally accepted as the correct interpretation of economic and monetary policies by academia.
However, the academic world can actually reduce open thought through ridicule and persecution. In the world of academia the herd is right, until someone proves that they are wrong using logic based reasoning.
Very similar to political ideologies, economic ideologies are deeply rooted. Paul Krugman is a great example of Keynesian economist. Like it or not, the majority of economists believe his views are correct regardless of whether they are based on fact, history, or dare I say “common sense.”
This leads me to the reason why precious metals and commodities in general may be approaching a major bottom and the potential for a monster rally. The reasoning stems from the fact that across the world central bankers generally share the same views as Paul Krugman. They believe that the modern finance system does not need gold and that fiat currency is the answer even though history argues in their face across multiple millennia.
Most economists and financial pundits believe that sovereign debt is going to bring down the economy and they may be correct. Many believe that the debt will unleash a massive deflationary spiral that will consume fiat valuations, specifically on risk assets and debt obligations.
I do not necessarily disagree that this is a likely outcome, but what concerns me is the number of people that believe this is true. This is the herd’s idea and as I have said many times before the herd is rarely right. This time may be different, although it rarely is. For inquiring minds I offer a rather different potentiality.
What if the debt crisis causes a totally different outcome that very few economists envision? What if they follow Dr. Krugman’s ideas and create massive amounts of debt to stimulate the economy while printing vast quantities of fiat money to prop up failing financial institutions? Clearly increasing debt levels and debasing the currency do not imply a long term positive scenario.
Central banks do not have a strong track record when it comes to reducing liquidity or increasing liquidity at the appropriate times. Thus these actions are likely to facilitate some sort of crisis in the future whether it is a result of runaway deflation or inflation.
I believe that should a deflationary crisis caused by massive debt levels and diminishing economic strength present itself, central bankers around the world will behave exactly the same way. They will act simultaneously and through dovish monetary policy central bankers will flood the world with massive sums of freshly printed fiat currency with the intent to print away issues with a liquidity induced risk-on orgy.
Should that be their ultimate choice, risk assets will rally sharply higher initially. Paper assets like stocks will produce huge gains in a short period of time while supposedly safe assets such as Treasuries would likely arrive at negative interest rates across the yield curve in nominal terms. The next phase is the scary part and why I am bullish long term of precious metals specifically.
The devaluation of fiat currencies simultaneously around the world will result in a monster economic crash when the masses realize that the majority of the major worldwide currencies are becoming worth less and less. The resulting crash would be caused by the opposite force of runaway inflation while the herd mentality that anticipates a deflationary debt spiral espoused by most experts and pundits would be proven materially false.
Under those circumstances, precious metals will be the true safe haven. Gold and silver will prove to be a true store of wealth that they have been for centuries. So many so-called experts fail to recognize that gold and silver are currencies. Yes they have industrial uses, but gold and silver represent the last unequivocal bastion of wealth preservation against the constant debasement procured by central bankers and their minions.
Under the scenario whereby central bankers flood financial markets with cheap, freshly printed fiat currency one would expect other essential commodities such as oil to also perform well. Furthermore agricultural based commodities would also flourish under those economic conditions. Investors would be in much better fiscal condition owning things that they could hold in their hands versus stocks or bonds.
I posit this potentiality not to say that this is exactly what is going to happen, but to challenge readers to open their minds. The crowd is usually wrong. The central bankers and most economists generally share the same viewpoints and their behavior is literally a giant group-think.
Is it possible that they are a herd which ultimately will be proven wrong? Will the herd mentality of economists and central bankers cause a massive currency crisis as they attempt to stem the tide of a deflationary debt crisis?
The two possible outcomes go hand in hand. I do not know what is going to happen, but neither outcome in the longer-term is especially optimistic. Should either scenario come to pass, the human condition will likely be threatened by a decrease in the standard of living across multiple developed countries and ultimately the threat of revolution and military action on a scale not seen in several decades could eventuate.
Clearly I have simplified the issues at hand presently for ease of reading, but the ultimate endgame will likely be one or a combination of both a debt crisis and a currency crisis. They will likely occur in close proximity to one other in terms of time, but the precise outcome will likely be different than what is commonly expected.
Regardless of which scenario occurs, precious metals will eventually be sought for their protection against the constant devaluation of fiat currencies by central banks around the world. For this reason, I remain a long term precious metals bull. With that said, why don’t we take a look at the recent price action in gold, silver, and gold mining stocks shown below.
A lot of writers have stated that gold has bottomed. I am not totally convinced, however I do believe that gold is in a bottoming process. For me to get completely in my gold bull suit I would need to see price action exceed the key resistance trend line shown below.
Gold Futures Contract Daily Chart
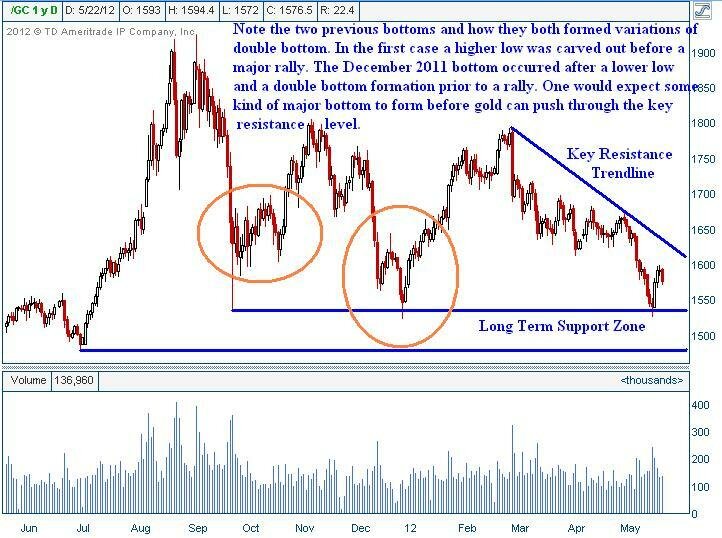
As can be seen above, until we see price push through resistance I will remain cautious. I would also point out that the last two times gold found bottoms near current prices the bottom forming process took several weeks to complete.
I do not expect for gold to form a V shaped reversal. In fact, lower prices in the short term would help drive the bullish case for the longer term. Bottoms take weeks to form and can be very dangerous trading environments where active traders get chopped around.
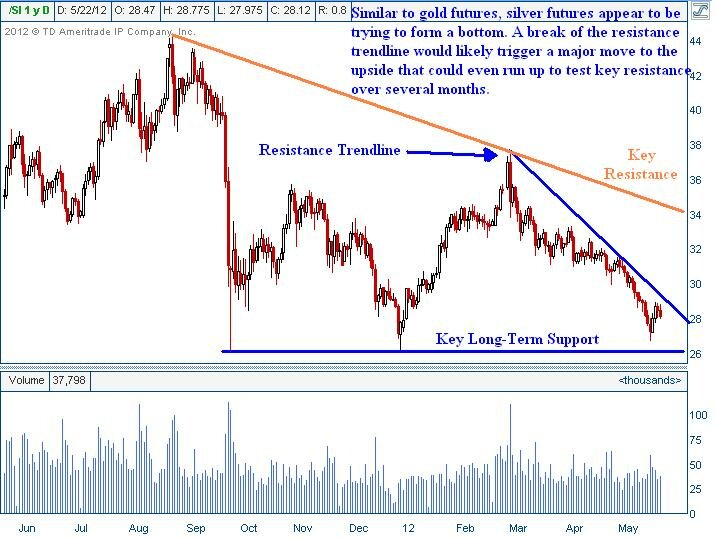
Silver is very similar to gold in that it appears to have formed the beginning of a possible bottom. Bottoms are generally not formed in one day. During the recent selloff, silver showed relative strength against gold. It is important to acknowledge that silver has yet to test the key lows that should offer support.
Because of this divergence in these two precious metals, I continue to believe that gold may see more downside again before a much stronger rally begins to take hold. Similar to gold, the descending trend line offers a great resistance level where traders can flip from being short-term bearish to longer-term bullish if the resistance line is penetrated. If we see silver carve out multiple daily closes above the resistance trend line paired with strong volume, I would anticipate that a bottom has formed and silver prices will have an upward bias. The daily chart of silver is shown below.
Silver Futures Contract Daily Chart
As expected, the gold miners have shown relative strength recently. The miners were just absolutely massacred during the recent selloff in equities and precious metals. However, gold miners similar to precious metals have a major descending trend line which they have already tested today. If the gold miners can push through resistance a large scale rally could play out. The daily chart of gold miners is shown below.
Gold Miners (GDX) Daily Chart
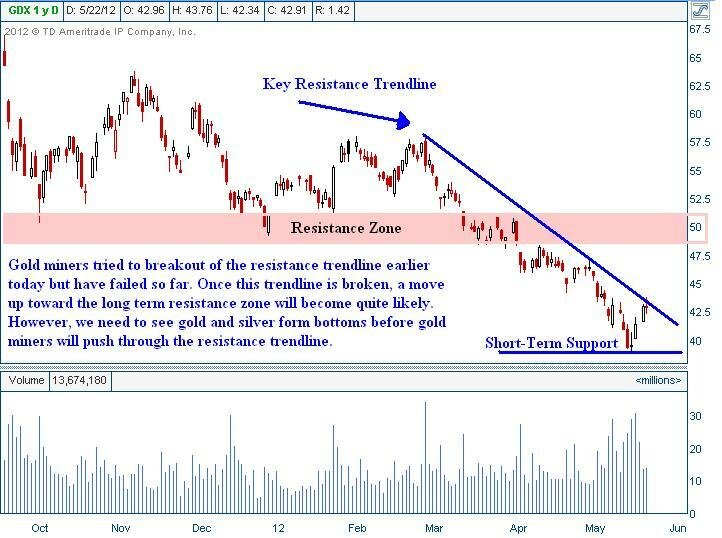
In addition, if readers look at a long term GDX price range that dates back to the 2009 lows the recent pullback is almost precisely a 0.50% Fibonacci Retracement. Similar to gold and silver, I would expect to see the gold miners pull back a bit here before pushing through major resistance. We may be setting up for a possible major bottom in precious metals and gold miners in the near future. Only time will tell.
In closing, remember to keep an open mind with regards to the future. The more often you hear the same message coming from financial pundits and experts, the more cynical you should become. Both potential scenarios will likely not end well. The question is whether the reason for the crash is deflation, inflation, or a combination of both scenarios. Regardless of the outcome, the long-term future for precious metals remains quite bright.
If you enjoyed this article and analysis, you can get our detailed trading analysis videos every Sunday, Monday, Wednesday and Thursday.
Happy Trading and Investing!
By JW Jones –Traders Video Playbook
This material should not be considered investment advice. J.W. Jones is not a registered investment advisor. Under no circumstances should any content from this article, TradersVideoPlaybook.com, or OptionsTradingSignals.com websites be used or interpreted as a recommendation to buy or sell any type of security or commodity contract. This material is not a solicitation for a trading approach to financial markets. Any investment decisions must in all cases be made by the reader or by his or her registered investment advisor. This information is for educational purposes only.
USD Moves Up vs. JPY Following Japanese Credit Downgrade
Source: ForexYard
The JPY took losses against the US dollar during European trading yesterday, following a downgrade of Japan’s credit rating. The USD/JPY advanced close to 60 pips over the course of the day, eventually peaking at 79.93. Today, dollar traders will want to pay attention to US New Home Sales figure, set to be released at 14:00 GMT. Analysts are forecasting the figure to show improvements in the US real estate sector, which if true, could help the greenback extend yesterday’s gains. In addition to the news out of the US, traders will want to pay attention to any announcements out of the euro-zone. An informal meeting of euro-zone leaders is set to conclude today. Any signs of a new strategy to combat the region’s debt crisis could lead to market volatility.
Economic News
USD – Dollar Sees Gains across the Board
The US dollar moved up vs. virtually all of its main currency rivals yesterday, following negative data out of the UK and Japan which caused investors to shift their funds to the greenback. A worse than expected UK CPI figure resulted in the GBP/USD tumbling close to 85 pips during the European session. The pair reached as low as 1.5762 before staging a slight upward correction during afternoon trading. Against the JPY, the dollar was able to benefit after Fitch Ratings downgraded Japan’s credit score. The USD/JPY shot up over 60 pips following the news to come within reach of the psychologically significant 80.00 level.
Turning to today, dollar traders will want to pay attention to the US New Home Sales figure, scheduled for 14:00 GMT. Analysts are forecasting the figure to come in at 335K, which if true, would represent the second consecutive month of growth in the US Real Estate sector. Should the news come in as expected, the dollar may be able to extend yesterday’s gains against the yen and UK pound. That being said, if today’s indicator comes in below the predicted level, the greenback could reverse its recent bullish trend.
EUR – Meeting of Euro-Zone Leaders Set to Generate Market Volatility
The euro fell against the US dollar during mid-day trading yesterday, as investor worries about the euro-zone’s prospects for economic recovery continue to dominate market sentiment. The EUR/USD dropped close to 70 pips, reaching as low as 1.2737 before staging a mild upward correction. Against the Japanese yen, the common-currency was able to benefit from a Japanese credit rating downgrade. The EUR/JPY was up around 55 pips during European trading, reaching as high as 102.00 before dropping to the 101.85 level.
Turning to today, euro traders will want to pay attention to any announcements following a meeting of euro-zone leaders regarding any new ways to combat the region’s debt crisis. Significant differences between Germany and France on the best way to promote economic recovery in the euro-zone have led to risk aversion in the marketplace in recent weeks. Unless a more unified policy is unveiled today, the euro could see further losses against the US dollar during afternoon trading.
AUD – Aussie Falls amid Increased Risk Aversion
Risk aversion in the marketplace led to significant losses for the Australian dollar vs. its US counterpart throughout yesterday’s trading session. After reaching as high as 0.9933 during early morning trading, the AUD/USD began to tumble eventually reaching 0.9864. The AUD had slightly better luck against the Japanese yen. The AUD/JPY shot up close to 40 pips during the morning session, but eventually staged a correction to erase its earlier gains.
Today, the direction the aussie takes will likely be determined by news out of the euro-zone. Should a meeting of euro-zone leaders produce any positive ideas regarding how to best stimulate growth in struggling euro-zone economies, investors may shift their funds to riskier assets which could help the AUD during afternoon trading.
Crude Oil – US Crude Inventories may Impact Price of Oil
The price of crude oil fell just over $1 a barrel during European trading yesterday, following an increase in risk aversion due to concerns about the euro-zone economic recovery. The commodity dropped as low as $92.18 during the morning session before bouncing back to the $92.41 level.
Turning to today, oil traders will want to pay attention to the US Crude Oil Inventories figure, set to be released at 14:30 GMT. US crude stockpiles have reached record highs in recent weeks, signaling decreased demand in the world’s largest oil consuming country. Should today’s figure show that US inventories increased again, the price of oil could drop further during the afternoon session.
Technical News
EUR/USD
The MACD/OsMA on the weekly chart has formed a bullish cross, indicating that this pair could see an upward correction in the coming days. This theory is supported by the Williams Percent Range on the same chart, which has dropped into oversold territory. Going long may be the wise choice for this pair.
GBP/USD
Most long term technical indicators show this pair range-trading, meaning a definitive trend is difficult to determine at this time. Traders will want to keep an eye on the Relative Strength Index on the daily chart, as it is close to dropping into oversold territory. Should the indicator drop below the 30 line, it may be a sign of an impending upward correction.
USD/JPY
The weekly chart’s Williams Percent Range has crossed over into oversold territory, indicating that this pair could see upward movement in the coming days. Additionally, the MACD/OsMA on the daily chart has formed a bullish cross. Opening long positions may be the wise choice for this pair.
USD/CHF
The weekly chart’s MACD/OsMA has formed a bearish cross, indicating that a downward correction could occur in the near future. Furthermore, the same chart’s Williams Percent Range has drifted into overbought territory. Traders may want to open short positions ahead of possible downward movement.
The Wild Card
Hang Seng Index
The daily chart’s Relative Strength Index has dropped into oversold territory, indicating that upward movement could be seen in the near future. This theory is supported by the Williams Percent Range on the same chart, which has crossed below the -80 level. Forex traders may want to go long in their positions ahead of a possible upward correction.
Forex Market Analysis provided by ForexYard.
© 2006 by FxYard Ltd
Disclaimer: Trading Foreign Exchange carries a high level of risk and may not be suitable for all investors. There is a possibility that you could sustain a loss of all of your investment and therefore you should not invest money that you cannot afford to lose. You should be aware of all the risks associated with Foreign Exchange trading.
You Choose to Outlive Your Retirement Income
Article by Investment U
No Social Security. No Medicare. No pensions. Higher life expectancy. Retirement income is harder to attain than ever, but it can be done.
A generation ago, it was easy. Case in point: My Dad spent 35 years working for Bethlehem Steel. He was a union man that knew his pension and retired health benefits were coming after he called it quits. On top of that, he would also file for social security to give him an added boost in retirement income. And that’s how it would be for the rest of his years.
Then that reality changed. For the most part, the private sector realized that pensions – and the actuaries that ran them – put a hurting on their bottom line. Workers would be OK because those 401(k) plans that Congress created finally started to really catch on in the 1990s. Thirteen or 14 years ago a 401(k) would burst off the charts with tech funds and when you wanted to play it safe a money market fund would give you 5%. This saving for retirement stuff wasn’t so hard. Can you say, “The good old days?’’
Let’s fast forward to 2012. We just saw the greatest economic downturn since the Great Depression four years ago. The ball game has changed. Gone are the days when retirement was just simple math. You knew exactly how much retirement income Social Security, savings and your pension would deliver. Then, you would cut back any unaffordable expenses when you hit 65.
With Social Security and Medicare’s future uncertain due to our budget crisis and a market that makes your employer benefit retirement plans remind you of a rollercoaster, the retirement planning process went from pretty simple to very complicated.
The current landscape has caused a great deal of pessimism concerning the retirement years. This new retirement reality is reflected in the fact that only 14% of Americans polled in the 2012 Retirement Confidence Survey conducted by the Employee Benefit Research Institute said they were “very confident they will have enough money to live comfortably in retirement.”
“Will I or we have enough money to maintain a comfortable lifestyle and make adjustments that may be necessary once I stop working?” This question is a burden weighing on the hearts of many. More than half of those surveyed said they had not even tried to calculate how much retirement income they will need.
Sit Down And Write Up A Plan
As you enter that stage where you’re really thinking about how to use retirement money for living expenses, you probably need to come up with a spending plan. Figure out the income you will have and what costs you will be paying out to help make your retirement income last over the long haul. This plan cannot be based on wishful thinking. Let’s be brutally honest. Let’s take into account the following:
- Future inflation
- Life expectancy
- Health care costs.
There is a risk these days of your nest egg running out while you are still alive and kicking.
Technology and the knowledge of how to live better have us living longer. According to the Society of Actuaries, at age 65:
- The average life expectancy is 17 years for men and 20 years for women.
- Men have a 41% chance of living to age 85 and a 20% chance of living to age 90.
- Woman have a 53% chance of living to age 85 and a 32% chance of living to age 90.
- For married couples, there is a 72% chance that at least one of them will live to age 85 and a 45% chance that one will live to age 90.
To sum it up, this money better last cause chances are that you will.
You’ll Most Likely Have a Funding Gap
Given your investments, rates of return, life expectancy and amount of risk you’re taking in your 401(k) portfolio, how much money will you need? The run-of-the-mill retirement model will tell you to assume you’ll need to replace 80% of your pre-retirement income. For most people going through this process, many find that there is a gap between projected income and expenses during retirement.
Your plan’s possible “funding gap” will show that some changes in behavior may be necessary to meet objectives. This could be accomplished by increased contributions to retirement plans, a larger allocation to stocks or greater outside savings. It is essential that you determine how you will fill the gap through creating your retirement spending plan.
How to Attack the Gap
You need to determine a strategy for using all of your investment accounts and IRAs to bridge the gap. You might want to start by taking the following steps:
- Determine the current market value of all your investments and estimate expected rates of return. You need this information so you can see how to go about withdrawing money in your retirement to meet all your known expenses.
- Rather than drawing down with specific monthly dollar amounts, you may want to take out a periodic percentage of the sum. Using a percentage can be your best bet against outliving your retirement income.
- Take note: A method popularized by William P. Bergen, a certified financial planner practicing in California, uses an annual withdrawal rate from retirement assets of 4% plus annual increases of about 3% to compensate for inflation.
For the moment, all of this is preliminary planning because Social Security and Medicare are wild cards.
If your gap really scares you, you also can take these additional steps now:
- Tell your employer to raise your pretax contribution to your employer-sponsored retirement plan.
- If you are self-employed in any manner, you can set up your own small business plan such as Simple or SEP-IRAs or a Profit Sharing or Money Purchase Pension Plan.
- Also, contribute as much as you can to your traditional IRA and/or Roth IRA.
- Then there’s the obvious. Save more in your traditional accounts!
Allocate and Make Decisions
Allocate your retirement assets to accomplish the complementary strategies of asset preservation and growth. You’ve heard this from Investment U before. Because different asset classes are imperfectly correlated – some zig, while others zag – our approach allows you to boost returns while reducing your portfolio’s volatility. True Asset Allocation should be the foundation stone of your whole investment strategy. It’s critical to your long-term financial health.
To do this, you use a special asset allocation percentage among large and small stocks, foreign shares, real estate investment trusts (REITs), gold stocks and three different types of bonds (high grade corporates, junk bonds and inflation-adjusted treasuries). The actual percentages run as follows:
- 15% – US Large Caps,
- 15% – US Small Caps,
- 10% – European Stocks,
- 10% – Pacific Rim stocks,
- 10% – Emerging Market Stocks,
- 10% – High Grade Bonds,
- 10% – High Yield Bonds,
- 10% – TIPS,
- 5% – Gold mining stocks,
- 5% – REITS
Remember that just sticking your money in money market accounts and Treasuries doesn’t cut it anymore. According to the Society of Actuaries, from 1980 to 2007, annual inflation in the United States has averaged 3.5%, so keeping some of your money in equities is vital if you expect your retirement funds to last by keeping pace with inflation.
Finally, a good idea would be to keep your retirement funds in separate “buckets.”
- Money that you will need in the 12 months or less to meet monthly expenses in cash or cash equivalents.
- Money that you expect to need in 2-5 years in fixed investments, which entail less risk and are likely to preserve your retirement capital.
- Finally, keep any money that you don’t expect to need for five to 10 years in equity investments where you will get the growth needed to keep pace with inflation.
Choose the retirement assets that you will draw down first with consideration for tax advantages. Consider withdrawals from taxable accounts first and then tax-deferred accounts such as traditional IRAs, 401(k) plans, 457 plans and the like. Roth IRAs should be drawn down last to allow the tax-free earnings to continue growing as long as possible.
I hope this is a start and gets rid of some of that pessimism.
Good Investing,
Jason Jenkins
Article by Investment U