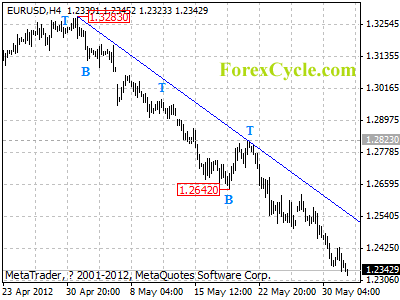
EURUSD’s downward movement from 1.3283 extends to as low as 1.2323. Further decline could be seen after a minor consolidation, and next target would be at 1.2200 area. Initial resistance is at 1.2430, a break above this level could indicate that a cycle bottom is being formed on 4-hour chart, then, consolidation of the downtrend could be seen. Key resistance is at the downward trend line, only a clear break above the trend line could signal completion of the downtrend.
Three Handy Hints to Cut Your Tax Bill in 2012
‘And here’s the rub. You don’t own the minerals. I don’t own the minerals. Governments only sell you the right to mine the resource, a resource we hold in trust for a sovereign people.’ – Prime Minister, Julia Gillard
At least the PM is consistent.
When you think about it, the way the pollies treat mining royalties is the same way that they treat your income.
You don’t own it. It’s everyone’s. Your income is just held in trust until you earn it.
Then the government takes a slab, leaving you what’s left over.
Yes, dear reader, it’s almost tax time again.
It’s time to see just how much of your income the government has stolen from you in the past 12 months.
But just as important, it’s time to plan ahead to make sure you’re able to legally cut your tax bill next year.
Here’s three handy and practical hints…
Money Saving Tax Tip #1
Prepay next year’s compulsory health insurance
OK. Strictly speaking, health insurance isn’t compulsory.
But penalising taxpayers for not having private health insurance makes it compulsory. For instance, any single person earning over $84,001 or a family earning over $168,001 has to pay the Medicare Levy Surcharge (MLS) of at least 1%.
That’s on top of the 1.5% Medicare Levy.
But if you have private health cover, you don’t pay the surcharge. And seeing as the cost of private health is usually less than the surcharge it makes sense to buy insurance…hence making it effectively compulsory.
But there’s a sting for health insurance buyers next tax year. The 30% rebate (or discount) on your health insurance will drop depending on your income. As the following table shows:
For example, a single person earning $100,000 per year will only get a 10% rebate rather than the current 30% rebate. So if their insurance policy is $1,000, they’ll only get a $100 discount (net cost $900).
But if they ditch private insurance, they’ll have to pay $1,250 for the Medicare Levy Surcharge…making them $350 worse off.
That’s the cruel nature of government and the State. Forcing ‘sovereign people’ to buy something they don’t need and won’t use.
But there is a small silver lining. You can dodge the reduced rebate bullet for one year. According to the experts, if you pre-pay next financial year’s health insurance before June 30 you’ll still qualify for the old 30% rebate.
For the single person on $100,000 that’s a $200 saving…it’s not much, but it’s better in your pocket than in your health insurer’s.
Before you do anything, check with your accountant and private health insurance firm to make sure that this is the best option for you.
Money Saving Tax Tip #2
Lock in gains and losses before June 30
This strategy is as old as the hills, but it’s worth reminding you about it.
If you have any investment gains during a tax year you have to pay tax at your marginal tax rate during that year.
But, if you have any losses from investments you can use those losses to offset any realised gains.
For instance, if you made a profit of $1,000 buying shares in Company A, you’ll need to pay tax on that profit of say 30% (depending on your tax rate).
But if you made a loss of $1,000 on Company B, you can use that loss to offset the gain…providing you sell the shares of Company B to realise the loss. You can’t claim the loss if you continue to hold the losing shares.
Hopefully you haven’t made any losses this year. But if you have, and you don’t think the stock has a chance of making a comeback, then you should think about selling out.
Just beware of one thing. Tax busy-bodies take a dim view of investors who sell a stock to claim the tax loss and then buy the stock back again.
If you think there’s a chance the stock could recover and you don’t want to miss out if it does, then maybe think about just selling half your position…at least it’ll give you a partial tax break while still keeping some skin in the game if the stock goes up.
Money Saving Tax Tip #3
Invest for tax effective income
A simple way to take advantage of the tax system is to buy income-friendly shares.
Those are shares that have what’s called a ‘fully franked’ or ’100% franked’ dividend.
Now, we won’t go into all the details about franking credits, because to be honest, it’s not very interesting.
But to put it simply, if a company pays a 70-cent fully franked dividend, it means the company has already paid tax on that dividend at the company tax rate of 30%.
So you get that tax benefit, allowing you to ‘gross up’ the dividend to $1. You then pay tax on the $1 dividend at your marginal tax rate.
If your tax rate is below 30% then you’ll receive a credit. If your tax rate is above 30% then you’ll have to pay a bit more tax.
But either way, it shows you the benefit of investing in income stocks that pay franked dividends compared to stocks that don’t.
We asked our in-house income investing expert, Nick Hubble to give us a worked example comparing two Aussie stocks – one with a fully franked dividend and one with an unfranked dividend…
Nick told us:
‘Notice how the after tax dividend yield on the fully franked share fell far less (1.31% to 1.04%) from the pre-tax dividend yield as a result of the franking credit offset. You should always double check dividend yields for this change.
‘Just to be clear, there is nothing inherently better about a franked or unfranked dividend. After all, every company is different. What is important is that the true dividend yield is different to the quoted yield. So you should always look beyond the quoted yield to work out the true yield based on your personal tax rate.’
Of course, this is only general advice. But with Australian taxes rising and the ability to reduce taxes being made harder all the time, it’s important you make the most of any tax breaks available.
Cheers,
Kris.
Related Articles
Market Pullback Exposes Five Stocks to Buy
APPEA – Day One at the Oil & Gas Show: Sand Dunes, Scuba Diving and Camels
How Bad Monetary Policy Will End the Welfare State
It’s a presidential election year in the US. There are millions of Americans still underwater on their mortgages. US house prices have neither bottomed nor recovered. And the Fed is doing all it can to prevent another great wave of foreclosures in an election year.
The past two months of action in the markets isn’t helping anyone in government.
In April, after five days in a row of falling stock prices in the US, you’d expect the powers that be to do something.
And they did. Federal Reserve Vice Chairman Janet Yellen told investors that the Fed would leave interest rates low until 2014 and maybe even until 2015. ‘Further easing actions could be warranted,’ she added.
Now that the first few weeks of May have seen the Dow wipe off 5.6%, Boston Federal Reserve President Eric Rosengren has called for further easing.
Adding to the easing talk is China. Recently the International Business Times wrote, ‘China’s interest-rate swaps market has priced in three to four benchmark interest rate cuts over the next year, reflecting growing pessimism over the world’s second-largest economy and expectations of more aggressive monetary easing.’
Investors love this kind of talk. It means free money will be around for another few years. And not just in America. Chinese money supply grew by 13.4% in the last year, according to the People’s Bank of China. Yuan-denominated loans grew by 1 trillion yen in March, or $160 billion. Reserve requirements at local banks were cut in April.
I’d suggest to you that officials in China and America are encouraging credit growth through monetary policy for the same reasons: to prevent rising political and social instability.
In China, the government of Wen Jiabao balances inflation concerns with growth concerns. If bank loans grow too fast, you get inflation and soaring prices (bad for stability). On the other hand, if credit growth contracts too quickly you get fallen house and stock prices and rising unemployment (also bad for stability).
If you know someone who believes that central bank easing is the key to sparking a real economic recovery, tell him he’s dreaming. Any short-term rallies in stocks due to news flow like this are a complete distraction from more serious issues. It should be ignored, or at least heavily discounted.
This is the point I want to make: the failure of monetary policy worldwide has begun to have political consequences.
For the past couple of years I’ve showed readers of Australian Wealth Gameplan how unsound money has brought us to the end of the Western Welfare State. Bad monetary policy results in the steady debasement of the currency. The less stable and reliable the currency is, the less trust ordinary people have in the political system (the people who defend and use the currency as a weapon and instrument of power).
In China, the political system is losing the trust of the people for many reasons; financial, political, ethical, and economic. There’s a tendency to look at the Chinese political system from the outside and view it as monolithic, where there is unanimity on all decisions. That’s not the case, of course.
Many people might find it inconceivable that the Chinese Communist Party could be yet another indirect victim of the Global Financial Crisis. But the Party is not so different from the European Central Bank or the Federal Reserve. They are institutions trying to manage and control complex systems. That’s a losing proposition in a complex world.
Prepare for the inconceivable.
Dan Denning
Editor, Australian Wealth Gameplan
From the Archives…
Free of the Dragon: Why the Energy Market Doesn’t Need China
2012-05-25 – Kris Sayce
China Stirs Up Troubled Waters in the South China Sea
2012-05-24 – Dan Denning
How Chinese Stocks Are Fading Fast
2012-05-23 – Lars Henriksson
LNG: Why Australia Will Be a New Global Gas Leader
2012-05-22 – Dr. Kent Moors
A Shocking Week for China’s Economy
2012-04-21 – Dr. Alex Cowie
Investing in Rising Corn Prices, Gold Miners, and More (CORN, NEM, GDX)
Article by Investment U
View the Investment U Video Archive |
In focus this week: why corn prices are set to rise, where gold miners are going, how Vanguard’s index mutual funds are raking in the dough and the SITFA.
There’s a ton of money to be made in corn this year. The current production estimates and demand trends can drive it back from its recent sell-off, and then some.
Corn prices jumped 9.5% recently following an 11% drop in early May that was driven by news of a huge U.S. crop this year.
Dave Marshall, an independent grain-marketing consultant, was quoted in the Journal this past week saying exporters and users are literally fighting over tight available supplies.
Wheat recently saw a 17% price increase, and corn should follow suit. Both can be used as animal feed, so corn and wheat prices are usually tied together.
And a recent comment by the Department of Agriculture has been adding to the surge in prices. It seems there were several very large corn export sales listed as going to unknown destinations, that were in fact headed for China. The International Grains Council said this past week that China’s demand could rise 50% in the year that starts this July.
I know I don’t have to tell you what increasing demand from China can mean to corn prices.
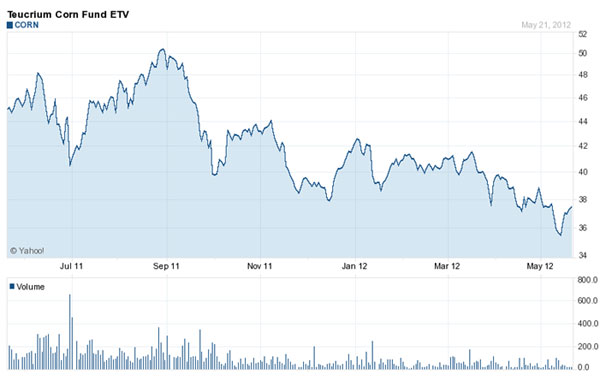
The best news: You can invest in corn without all the mechanics of the commodities exchange, via an ETF called the Teucrium Corn Fund (NYSE: CORN). Its chart is on your screen now.
Trending upward, rising demand and less of a crop than previously expected all add up to higher corn prices. Take a look at CORN.
Gold Miners
Barron’s says gold mining stocks could jump 50% if the price gap between gold and the miners narrows to historical levels.
Despite the recent sell-off in gold, it’s still up 80% since 2009, but gold miners are only up about 20% in the same period. The ratio between the two is at an all-time high.
The name Barron’s is throwing around, Newmont Mining (NYSE: NEM). It’s at or near its 52-week low and has a 3.1% dividend. Earnings are expected to hit an all-time high this year at $4.85 per share on a 6% increase in revenues. The P/E is a screaming 8!
Morgan Stanley said in a Barron’s article last week that all of the fundamentals that drove gold to the $1,900 level are still in place and they are expecting a further run-up, which can only add to the case for miners.
Newmont currently produces gold at $650 an ounce, but announced it is working to reduce that cost. Produce at $650, sell at $1,600 and higher, very nice!
The alternative play on the disparity between gold and the miners is the Market Vectors Gold Miners ETF (NYSE: GDX). It’s just a few dollars above its 52-week low and sports a diverse portfolio of mining stocks.
Spreads like this one between gold and the miners don’t last forever. Bet on it running back to its historic norm. NEM or GDX, take a look.
Mutual Funds That Have Tons of Cash Rolling In!
The top 1% of mutual funds last year brought in a net of $290 billion. The other 99% of funds had a net loss of $91 billion. That’s what I call a signal!
Which stock funds are investors pouring money into? Boring, vanilla, big-cap, dividend-paying mutual funds!
The chairman of thee top asset gathering funds, the Vanguard Group, described his funds as “not Wall Street and representative of Main Street.” The Vanguard Total Stock Market Index Fund (MUTF: VITSX) and the Vanguard Total International Stock Index Fund (MUTF: VGTSX) were the top dogs! In fact, Vanguard had seven of the top 20 asset gatherers from last year.
Bill McNabb, the Chairman of Vanguard, said they serve over 10 million families with low cost, high performance index funds. It’s hard to argue with that combination.
Boring and stable definitely appears to be the current investing trend.
The Ultimate SITFA
Usually I try to find something for this segment that hasn’t hit the big news sources, something off the beaten track. But this week I have to get my digs in on the Facebook (Nasdaq: FB) IPO.
IPOs, good ones anyway, are the ultimate insider’s territory. No one, and I mean no one who wasn’t one of the inner circle got any of this stock. The hype was so over the top I had to stop listening days before the offering. I still can’t believe how the so called intelligentsia got sucked into this one.
I wasn’t certain it was going to tank, but with a PE of 75 what did they expect?
Now we know the revenue numbers were secretly cut during the road show. A road show is when the lead underwriter travels around to talk to all the other ultimate insiders to assure them this is the one they have to own.
Having spent 10 years in the brokerage business watching the insiders scoop up all the stock in any IPO worth the paper they were printed on, I have to say it was somewhat satisfying to watch this one do the rock imitation.
FB ran the perfect scam on the wolves of the street and the insiders finally got the slap in the face they so richly deserved. FB priced this thing at the top of even the hype, not just the top of the numbers. Anyone who got caught at the top got exactly what he paid for. Hype.
This could very well turn out to be a good investment, but not until it finds its bottom. Which is where I’m sure most of the inner circle are quite sore after the good kick they just got.
Be careful, everything comes around!
Article by Investment U
Mark Skousen’s Investment Conference Round-Up
Article by Investment U
Today's contributor is the famed economist, investment analyst, author, Ben Franklin impersonator and investment conference attendee, Mark Skousen.
“On Dec. 31, trillions of dollars in tax cuts will expire, trillions more in new tax hikes under ObamaCare will kick in, and a trillion in automatic spending cuts will begin.”
– Don Luskin, “Fiscal Cliff Could Crush Stocks,” Wall Street Journal, May 4, 2012
As an investment writer, I probably lead all other writers (including Alex Green!) in one category: attending investment conferences! My subscribers are constantly amazed at how often I am away from home attending a conference or visiting a new country.
I probably attend two dozen economic and financial seminars each year, including the Milken, SALT, Money Shows, New Orleans, Investment U, and of course my own big show FreedomFest. I’m constantly on the road. I’ve been to 72 countries and this week will travel to Warsaw, Poland and London, England to deliver several addresses on economics and finance.
Why do I do it? I firmly believe I’m a better economist and financial advisor by attending conferences and hearing what others have to say. In fact, I would argue that YOU will be a better investor by attending financial conferences too.
The Buzz at the Milken Conference
May has been especially busy with conferences. I attended in Beverly Hills the famous Milken Institute Global Conference, hosted by Michael Milken. The watch word I heard repeatedly about the U.S. economy was “fiscal cliff.” The huge debt load the United States is facing on top of the trillions in unfunded liabilities is indeed cause for alarm. A crisis is coming, and nobody is doing anything about it. It may hit as early as December, as Don Luskin warned in the Wall Street Journal (see quote above).
All kinds of big wigs were at the Milken event: former President Bill Clinton, California Gov. Jerry Brown, alternative energy promoter T. Boone Pickens, doom-and-gloomer Nouriel Roubini, Walter Isaacson (author of Steve Jobs’ biography), Harvard historian Niall Ferguson, and hundreds of CEOs from around the world.
I thought Niall Ferguson, the Harvard historian, stole the show. When a Keynesian economist said that state capitalism (e.g., China) seems to work better than free-market capitalism (e.g., the United States), Ferguson jumped in to show a dramatic chart that proved otherwise. Looking at government as a percentage of gross domestic product (GDP), the size of government in China is far smaller than in the United States! “China is moving away from state capitalism toward freer markets,” he said. “The United States is moving away from free markets toward state capitalism.” China is growing faster because they are adopting free market policies – a brilliant response!
Meanwhile, I also ran into Steve Forbes, who spoke on a panel about tax reform. He railed against the millionaires’ tax (The Buffett Rule) being proposed by President Obama (and supported by Jared Bernstein on the panel), contending, “You don’t raise taxes on the successful, especially during a weak recovery.” Amen!
Afterwards, Steve asked about my own conference FreedomFest, and I told him about all of the great debates and panels we have scheduled this year. “I can’t wait,” he said. Steve Forbes and Whole Foods CEO John Mackey are our official FreedomFest co-ambassadors. Hope you’ll join us. See more below…
SALT Conference: It’s All about Jobs!
Another conference I attended was the SALT conference, run by hedge fund manager Anthony Scaramucci, who just wrote an excellent primer, “The Little Book of Hedge Funds: What You Need to Know about Hedge Funds but the Managers Won’t Tell You.” Highly recommended.
Like Milken, Scaramucci invites a lot of big names to his conference, including Al Gore and Sarah Palin. I was able to attend only one day due to other commitments, but I was on a panel with Adam Lashinsky, senior editor at Fortune magazine, about his new book, “Inside Apple: How America’s Most Admired — And Secretive — Company Really Works.”
Steve Jobs’ last name symbolizes the challenges facing America today. The future of America is all about the job participation rate and the unemployment rate. The official unemployment rate is down to 8.1%, but that’s largely because millions of people have simply stopped looking for work.
According to a recent report, approximately 86 million people are invisibly unemployed in the United States. After peaking at 67.3% in early 2000, the labor force participation rate has been falling ever since.
In our panel discussion, Lashinsky denied the popular view that technology companies like Apple don’t create many jobs. Apple may not hire a lot of workers, but the products they produce (iphones, ipads, MAC computers, etc.) sharply increase productivity and create a higher standard of living and millions of jobs indirectly – I agree.
My “Surprise” Prediction at the Money Show
I also made numerous appearances at the Las Vegas Money Show, including a SRO private meeting with subscribers (thanks for coming). Investors were worried about the bear market on Wall Street and the never-ending debt crisis in Europe.
But I offered good news to attendees. I made the “surprise” prediction that Mitt Romney would win the Presidency in November and the stock market would roar on the news. This forecast goes counter to the odds makers at www.intrade.com, the political futures market, which currently shows Obama ahead of Romney, 58% to 42%. But over the past two months Obama has been gradually losing support and Romney has been gaining. Moreover, Romney could win if the economy continues to struggle (as I expect it will) and if Romney wins the presidential debates (iffy). Remember, Reagan was way behind Jimmy Carter in early 1980 and ended up winning by a landslide, largely due to economic worries.
Don’t get me wrong: I am not rooting for a downturn just to elect a Republican. But I want someone in office who understands business, and can turn things around.
Watch Intrade carefully. The political futures market is more accurate over the past election cycles than the national polls. The pollsters survey voters with the question, “If the election were held today, who would you vote for?” There’s no skin in the game and voters can lie. But in Intrade, voters are putting up their own money and betting on the question, “Who will win the election in November?”
Update on FreedomFest, “The World’s Best Conference”
Recently I attended one of those big corporate conferences out West and a well-dressed businessman came up to me from out of the blue and introduced himself. He said, “You don’t know me but my name is Tony and I’m from Phoenix. I just want you to know that FreedomFest in Vegas is by far THE best conference I’ve ever attended, and I’ve attended all of them.”
While Tony and I were talking, a young executive came up and introduced herself as Lenore Hawkins from San Diego. “He’s right,” she said. “I always come away inspired and looking to take on the world after attending FreedomFest. This year I’m bringing five friends!”
I know this story sounds like promotional hype, but it really happened.
In fact, it happens all the time. This year the Oxford Club (Alexander Green, Karim Rahemtulla, Marc Lichtenfeld and Steve McDonald) is hosting a one-day conference at FreedomFest. Other speakers include Peter Schiff, Rick Rule, and of course, Steve Forbes and John Mackey. They attend all three days! As Keith Fitz-Gerald says, “FreedomFest is the conference even speakers like to attend.” (Yes, he’s coming.) To see what all the excitement is all about, go here, or give Tami Holland a call toll-free 1-866-266-5101.
Good Investing,
Mark Skousen
P.S. We’ve just signed on two more high-profile speakers for FreedomFest – Robert Kiyosaki, author of “Rich Dad, Poor Dad” and G. Edward Griffin, author of “The Creature from Jekyll Island.”
Article by Investment U
Central Bank News Link List – 31 May 2012
By Central Bank News
Here's today's Central Bank News link list, click through if you missed the previous central bank news link list. Remember, if you want to submit links for inclusion in the daily link list, just email them through to us or post them in the comments section below.
- Brazil Central Bank Cuts Rate -50bps to 8.50% (Financial Times)
- Denmark Central Bank Cuts Rate -15bps to 0.45% (MNI)
- Hungary c.bank Holds Interest Rate at 7.00% (Portfolio.hu)
- Turkey C.bank Keeps Interest Rate at 5.75% (Bloomberg)
- Colombia c.bank Maintains Lending Rate at 5.25% (Wall Street Journal)
- Bank of Zambia Holds Rate at 9.00% (Lusaka Times)
- China money market rates fall on policy outlook (BusinessWeek)
- Goldman Sachs: c.bank interest rate expectations (FX Street)
- Fed intervention and the markets (All Economists)
- Central Banks are never out of ammunition (Forbes)
- The Threat of Fiscal Dominance (BIS and OECD)
Using Linear Regression in Forex Trading
In forex trading, there are many different ways to analyse the data in a bid to try and accurately predict what the market is likely to do next.
Linear regression is a tool used by many traders, which sounds more complicated than it is, which offers advantages very similar to that of moving averages.
Put simply, linear regression is a statistical analysis tool which looks at both price and time. Both resistance and support levels are shown on the graph, with the slope direction depicting the overall trend of the market.
Regression is a much-used type of statistical analysis and is very commonly seen in trading. In forex, linear regression creates a channel after support and resistance levels are identified which trading will normally stick within. Any burst outside the channel is normally expected to be brief – a prolonged break-through is a sign that the market is about to reverse.
After a midway point is identified, two further lines are created both above and below – a couple of points each way – to create the channel for the range.
As well as helping to identify trends about to develop, linear regression can also help a trader to set both entry and exit points by looking at the boundaries of the channel created. This can give an indication of when the market is reaching the top of its range and the position should be closed.
However, linear regression can be used to create a simple line, rather than a channel if preferred. A linear regression line is created by joining the starting price with an end price, picking the points which create the least deviation throughout the length.
The linear regression line is viewed as the midway point or the `fair price` and is the point which the market is expect to keep moving through. If the current price is above the line, it would suggest a sell strategy and if below the line, a buy strategy.
Linear regression can be used on different time frames, depending on the trades being executed and can help to remove the psychological element from trading. The power of human emotions can be one of the hardest things for traders to overcome and much discipline and self control is required at times.
Because linear regression is based on facts, there is no need to interpret the results – they speak for themselves. This can help to make it easier – when used alongside other technical indicators – to set up entry and exit points, as well as detect trends very soon after they begin.
Linear regression is just one of the tools used by traders to help become more effective and despite its statistical strength, should never be used in isolation to determine a strategy. In order to trade forex profitably it is necessary to select the right mix of charts, tool and indicators; enough to provide sufficient detail for analysis but not too many for the picture to become clouded.
Gold and Silver “Finally Decouple” from Euro, Stocks & Commodities But Still End May Sharply Down
London Gold Market Report
from Adrian Ash
BullionVault
Thurs 31 May, 08:45 EST
WHOLESALE BULLION gold prices rose Thursday lunchtime in London, extending yesterday’s sharp jump and cutting this week’s 2.5% drop by more than two thirds even as the Euro currency again slipped through $1.24 for the second day running.
Trading near $1564 per ounce, however, Dollar gold prices headed towards their fourth monthly drop in succession, losing some 5.3% in May.
Silver bullion neared the end of May more than 10% lower from end-April, despite rallying above $28 per ounce Wednesday afternoon in London when the Euro first slipped to those fresh two-year lows.
US crude oil was on track for a monthly drop of 16% says Bloomberg, its worst fall since December 2008.
The MSCI index of global stock markets has shed nearly 9% in May.
“Gold and to a lesser extent silver decoupled from the rest of the [commodities] group on Wednesday and started to head higher,” says a US analyst.
“Finally gold is behaving ‘normally’ and is ‘profiting’ from the fears surrounding the Euro,” agreess Commerzbank analyst Eugen Weinberg, “[resisting] the general downswing experienced by commodities and equities.
“Gold is proving to be good ‘risk insurance’ [but] we believe there may still be downside risks if the US Dollar continues to remain strong.”
Standard Chartered also “see downside risks for the short term but remain long-term bulls,” they said in a note.
May has “definitely seen a flight to the Dollar rather than gold,” says Chinese brokerage CITIC Futures’ chief investment strategist Wang Xiaoli, adding that “the crisis in Europe doesn’t look like it will abate soon.”
So-called “safe haven” US Treasury bonds rose sharply again on Thursday, driving 10-year yields down to new all-time lows beneath 1.60%, following weaker-than-expected US payroll data from the private ADP group.
Ten-year Spanish bond yields meantime held near 6%, the level which Portuguese yields reached just before its ECB, IMF and European Union bailout.
Speaking to the European Parliament Thursday morning, the 17-nation Eurozone’s chief central banker Mario Draghi accused Spain and other member states of trying to deal with their domestic banking crises in “the worst possible way.”
Spain last week announced a fresh €19 billion injection of state funds into the part-nationalized Bankia lender.
“There is a first assessment, then a second, a third, a fourth,” said Draghi. “Everyone ends up doing the right thing, but at the highest cost.”
Across in Ankara, the Turkish Central Bank today said it may “gradually” raise the percentage of required reserves which commercial banks can hold in physical Gold Bullion to 30%.
The news comes only 1 months after the limit was raised to 20%, and only 2 months after Turkish banks were first allowed to hold a portion of their required reserves in gold. (Read about Turkey’s new gold policies here…)
The world’s biggest trade credit insurer, Euler Hermes, meantime suspended cover for goods being shipped to Greece, saying that until there’s “clarity” after 17 June’s Greek election, it cannot be sure debts will be paid in the event of Athens quitting the Euro.
Over in Hong Kong today, London-based luxury jeweler Graff abandoned its $1 billion stock-market IPO scheduled for tomorrow, blaming “consistently declining stock markets.”
India’s Rajesh Exports – which forecast in Sept. 2009 that rising Gold Prices could dent Indian demand, only to see the world’s #1 buyer grow its private consumption for the next two years running – today warned that Indian gold demand could fall hard in 2012 due to the weak Rupee.
In Dollar terms, “Gold Prices remain within a sideways consolidation,” says Mumbai-based RiddiSiddhi Bullions, pointing to support at $1526 and resistance at $1600.
“We are neutral gold until it makes a larger directional move outside of those levels. The trend remains bearish.”
Gold price chart, no delay | Buy gold online at live prices
Adrian Ash is head of research at BullionVault, the secure, low-cost gold and silver market for private investors online, where you can buy gold today vaulted in Zurich on $3 spreads and 0.8% dealing fees.
(c) BullionVault 2012
Please Note: This article is to inform your thinking, not lead it. Only you can decide the best place for your money, and any decision you make will put your money at risk. Information or data included here may have already been overtaken by events – and must be verified elsewhere – should you choose to act on it.
ForexCT Afternoon Market Thoughts for 31 May 2012
Video courtesy of ForexCT – A leading Australian forex broker, liscensed by the Australian Securities & Investments Commission, offers the MetaTrader4 and PROfit Platform to retail traders. Other services include Segregated Accounts, Trading workshops, Tutorials, and Commodities trading.
Italian Bond Auction Leads to Further EUR Losses
Source: ForexYard
The euro dropped to a fresh two-year low against the US dollar yesterday, following a disappointing Italian bond auction which led to fears that the euro-zone debt crisis is spreading to other countries in the region. In addition, fears regarding the health of the Spanish banking sector caused other higher yielding currencies and commodities to extend their bearish trends throughout the day. Today, traders will want to pay attention to a batch of US data, including the ADP Non-Farm Employment Change and Prelim GDP figures. Any better than expected news could help the dollar add onto its recent gains.
Economic News
USD – ADP Non-Farm Figure Set to Create Dollar Volatility
The US dollar saw additional gains against riskier currencies like the euro and AUD yesterday, as investors continued to shift their funds to safe-haven assets amid concerns regarding the Spanish banking sector. The EUR/USD fell close to 80 pips during European trading, reaching as low as 1.2406 before staging a very slight upward correction. A worse than expected Australian Retail Sales figure caused the AUD/USD to fall well over 100 pips over the course of the day. After reaching as low as 0.9724, the pair was able to reverse upwards and stabilize around the 0.9740 level.
Turning to today, traders will want to pay attention to a batch of US data, including the ADP Non-Farm Employment Change and Prelim GDP figures. The ADP statistic is considered an accurate predictor of Friday’s all-important Non-Farm Payrolls figure, and consistently leads to market volatility. A better than expected figure could help the dollar recover some of its recent losses against the JPY. With regards to the Prelim GDP, analysts are forecasting that the figure dropped from last quarter. If true, investors may take it as a sign that the US economic recovery is weakening, which could cause the dollar to fall against its safe-haven currency rivals.
EUR – Spanish, Italian News Send EUR to Fresh Lows
Ongoing fears regarding Spain’s banking sector combined with a disappointing Italian bond auction, caused the euro to tumble against several of its main currency rivals yesterday. In addition to the 80 pip drop the common currency took against the US dollar, the EUR/JPY also fell around 125 pips during European trading. The pair dropped as low as 97.91, a four-month low. That being said, the news was not all bad for the euro, which was able to move up against the AUD, following a disappointing Australian retail sales figure. The EUR/AUD reached as high as 1.2761, up over 60 pips for the day.
Turning to today, euro traders will want to monitor the results of the Irish Stability Treaty Vote. Ireland is holding a referendum on whether to accept or reject the EU Stability Treaty. Most analysts are forecasting that the referendum will pass, which if true, may give the euro a boost during mid-day trading. That being said, should Ireland vote no on the treaty, it will likely lead to additional euro-zone fears, which could result in the common-currency dropping to new lows against the USD and JPY.
JPY – Yen Continues to Benefit from Risk Aversion
Risk aversion due to euro-zone worries and worse than expected US data led to significant gains for the safe-haven Japanese yen yesterday. The USD/JPY fell as low as 78.86, down over 60 pips for the day, amid fears that the US economic recovery is slowing down. Against the AUD, the yen was able to benefit from poor Australian retail sales data. The AUD/JPY fell over 100 pips, reaching as low as $76.70.
Turning to today, traders will want to pay attention to US news, specifically the ADP Non-Farm Payrolls figure at 12:15 GMT. Should the figure come in above the forecasted 145K, the yen could reverse some of its recent gains during the afternoon session. That being said, if the figure comes in below expectations, the JPY could extend its recent bullish trend.
Crude Oil – Risk Aversion Sends Crude Oil Tumbling
The combination of euro-zone debt worries and disappointing US data sent the price of crude oil tumbling during the European session yesterday. Investor fears regarding declining demand for oil in the US was reinforced following a significantly worse than expected Pending Home Sales figure. Overall, the price of crude dropped over $2 a barrel, eventually reaching as low as $88.16.
Turning to today, oil traders will want to pay attention to the US Crude Oil Inventories figure, scheduled for 15:00 GMT. Record high crude inventories in the US have been taken as a sign of decreased demand in the world’s largest oil consuming country. Should today’s figure come in the above expected level of 0.2M, oil could drop further as a result.
Technical News
EUR/USD
A bullish cross on the daily chart’s Slow Stochastic indicates that this pair could see an upward correction in the near future. This theory is supported by the weekly chart’s Williams Percent Range, which has dropped into oversold territory. Opening long positions may be the wise choice for this pair.
GBP/USD
Long-term technical indicators are providing mixed signals for this pair. On the one hand, the weekly chart’s MACD/OsMA has formed a bearish cross, meaning downward movement could occur in the coming days. That being said, the same chart’s Williams Percent Range has dropped into oversold territory. Taking a wait-and-see approach may be the wise choice for this pair.
USD/JPY
While the Williams Percent Range on the weekly chart has dropped into oversold territory, most other technical indicators show this pair trading in neutral territory. Traders may want to take a wait-and-see approach, as a clearer picture is likely to present itself in the coming days.
USD/CHF
The Relative Strength Index on the daily chart has crossed over into the overbought zone, indicating that this pair could see downward movement in the near future. Furthermore, the weekly chart’s MACD/OsMA has formed a bearish cross. Opening short positions may be the right move for this pair.
The Wild Card
USD/HUF
Both the Slow Stochastic and the MACD/OsMA on the daily chart have formed bearish crosses, indicating that this pair could see downward movement in the near future. This theory is supported by the Relative Strength Index on the same chart, which is currently in overbought territory. This may be a good opportunity for forex traders to open short positions ahead of a possible downward correction.
Forex Market Analysis provided by ForexYard.
© 2006 by FxYard Ltd
Disclaimer: Trading Foreign Exchange carries a high level of risk and may not be suitable for all investors. There is a possibility that you could sustain a loss of all of your investment and therefore you should not invest money that you cannot afford to lose. You should be aware of all the risks associated with Foreign Exchange trading.