Canadian Dollar Rises to 7-Month High Versus U.S Dollar

Source: ForexYard

printprofile

The Canadian Dollar appreciated to a seven-month high versus its currency counterpart, the U.S dollar.The rise of the “loonie” was a result of speculation that the global growth outlook is on the mend,boosting  prospects for Canada’s exports.

The Canadian currency has strengthened against 15 of its 16 major currency counterparts, except for the Japanese Yen.The CAD is heading towards a 1.6 percent climb against the ’safe haven’ U.S dollar for the month of April.

The Canadian dollar reached the strongest level since September after hitting 98.23 cents per U.S dollar before climbing to 98.34 which was a 0.4 percent rise.

Governor of the Bank of Canada Mark Carney is expected to deliver a speech on Friday. The Governor has the biggest influence on the nations currency value and therefore the outcome of the speech could result in a short term positive or negative trend.

Forex Market Analysis provided by ForexYard.

© 2006 by FxYard Ltd

Disclaimer: Trading Foreign Exchange carries a high level of risk and may not be suitable for all investors. There is a possibility that you could sustain a loss of all of your investment and therefore you should not invest money that you cannot afford to lose. You should be aware of all the risks associated with Foreign Exchange trading.

J-Charts: The Next Evolution of Technical Analysis

Article by Investment U

J-Charts: The Next Evolution of Technical Analysis

An investor armed with some serious mathematical and scientific ammo has an edge over the competition. Which is why I’m sharing J-charts with you…

It shouldn’t surprise anyone that the analysis itself is becoming more mathematical and/or scientific. But that doesn’t make it more attractive to average investors. People are still going to prefer the easier methods of “going with the gut” or simply hiring an advisor.

But an investor armed with some serious mathematical and scientific ammo has an edge over the competition. Which is why I’m sharing J-charts with you…

Although technical analysis has been around since the nineteenth century, economists and most fundamentalists are lukewarm to the “science.” The fact is, with the human emotional element involved, much of the science available is inexact.

So just like the scientist working on his or her hypothesis, technicians have been attempting to tweak aspects of charting in order to successfully predict price.

It was this chartists’ reliance in placing price action into specific time slots that John Chen took exception to. He was looking for a model that would express the dynamic nature of markets, which he likens to the thermodynamic process.

What the Heck is a Thermodynamic System?

While researching another subject, I came across two articles by Matt Blackman, the host of TradeSystemGuru.com. In these pieces, separated by eight years, he goes into detail of Mr. Chen’s epiphany by means of the software he created. I’m going to try to give you the highlights.

John Chen believed that alternating between periods of equilibrium and chaos, price seeks to find a new balance point after each trend, similar to going up (or down) sets of stairs separated by landings. When more buyers enter, prices move out of equilibrium and trend higher until a new equilibrium point is reached (the next landing of the stairs). This isn’t governed by time, but is totally price dependent.

What’s driving all this action?

Investor behavior.

Chen’s program, called J-Chart, plots price as a five-part Chinese “Jeng” or JE character
(Chinese “Jeng” or JE character). One part of the character plots each time a transaction occurs at a specific price, allowing the user of the program to determine the level of equilibrium at any given time.

Depending on your preference, any time period may be set and periods may be combined. Opening prices are plotted in yellow and closing prices for the period are plotted in cyan (I just call it turquoise because I don’t know better).

As price plots in a given frame, a triangle begins to form. If it’s top-heavy, like Figure 1 below, the part of the plot with indentations (or caves) will generally be filled in following sessions, unless the market is trending strongly in the opposite direction.

Figure 1 - Price plots in a J-Chart showing triangular formation from high (point of origin) to low (image point) with open (yellow) and close (cyan) and balance point (solid red line).

Figure 1 – Price plots in a J-Chart showing triangular formation from high (point of origin) to low (image point) with open (yellow) and close (cyan) and balance point (solid red line). Chart provided by J-Chart.com.

The point of origin is either the high or low where price plots occur. The image point in Figure 1 contains no price plots, making this formation top heavy and out of balance. If we were looking at the equilibrium, the high and low would be the same distance from the balance point (center), where the greatest number of price plots occur and the little characters would symmetrically fill the triangle outlined by the gray lines.

Equilibrium

This system is trying to let us see when the market is or is not in equilibrium. A market in perfect equilibrium would appear as an isosceles triangle turned vertical. But the assumption has to be made that efficient markets make sense. If you’ve looked over the market for just the past six months, you know that’s far from the truth. Prices respond by moving up too far in a bull run and then back down again when emotion ebbs.

Yet, even when they’re driven by strong investor sentiment, markets must obey certain energetic laws. Prices moving too quickly upward must at some point come back and fill the areas that have been missed. These show up on the J-Chart display as gaps (caves), narrow price activity, or unbalanced triangles (see Figure 2).

Figure 2 - Real price action showing double balance points and price vacuum or “cave” in the middle. The natural tendency is to fill this void in subsequent price action unless there is an overwhelming move either higher or lower. However, sooner or later, this price cave will have to be filled.

Figure 2 – Real price action showing double balance points and price vacuum or “cave” in the middle. The natural tendency is to fill this void in subsequent price action unless there is an overwhelming move either higher or lower. However, sooner or later, this price cave will have to be filled. Chart provided by J-Charts.

Price Forecasting

Price forecasting is achieved by using the J-Chart forecasting tool. Using two balance points, or an image or point of origin and subsequent balance point, a triangle is plotted by the program from which the trader can then draw a horizontal line forward (see Figure 1). And this forecasting ability is pretty cool. The program allows you to set your options as to what you can see depending on your investing objectives.

Stop losses are set using major balance points from prior days, past highs, or lows and at the horizontal blue lines plotted by the program showing significant support/resistance (Figure 1).

The trader also can use the previous day together with overnight price activity before the market opens on the trading day – trying to see if the market is still trending. Once the trading day begins – and with the intraday interval set – the trader watches everything unfold and sets new targets and stop losses as the market moves.

What to Take From This

There’s a lot of indicators and systems being churned out there in the marketplace that claim they are the best way to predict price. What sticks will be an equal combination of what has great marketing pizazz and then what works.

We’re looking at stock picking by means of science that most Americans don’t know about or want to understand. And this seems to be a trend. I think everyone needs to think about what they want from the market (and maybe you have several end games from investing). Either way, this is an available tool that gives you another way to discover trends – and that’s the whole point of technical analysis.

Good Investing,

Jason Jenkins

Article by Investment U

UK Government: Fracking Causes Earthquakes, but It’s Worth the Risk

The process of hydraulic fracturing is a mining technique which uses injected fluid to propagate fractures in a rock layer to release hydrocarbon deposits that would otherwise be uncommercial. Developed in the U.S. and first used in 1947 for stimulating of oil and natural gas wells, the use of “fracking” soared in the past decade as thousands of wells have been drilled into the Marcellus Formation, also referred to as the Marcellus Shale, a deposit of marine sedimentary rock found in eastern North America.

While initial environmental protests of the technique centered around its possibility of polluting underground water aquifers as a number of known carcinogenic substances are used in the procedure, more recently research has focused on an even more ominous byproduct of the technique – the increased possibility of earthquakes. While in the U.S. the U.S. Geological Survey and the state governments are investigating the link, in Britain the Department of Energy and Climate Change on 17 April published an independent expert report recommending measures to mitigate the risks of seismic tremors from hydraulic fracturing and invited public comment on its recommendations.

The report reviewed a series of studies commissioned by Cuadrilla, whose fracking operations in Lancashire aroused public debate, and the document “confirms that minor earthquakes detected in the area of the company’s Preese Hall operations near Blackpool in April and May last year were caused by fracking.” DECC’s Chief Scientific Advisor David MacKay remarked, “If shale gas is to be part of the UK’s energy mix we need to have a good understanding of its potential environmental impacts and what can be done to mitigate those impacts. This comprehensive independent review of Cuadrilla’s evidence suggests a set of robust measures to make sure future seismic risks are minimized – not just at this location but at any other potential sites across the UK.”

The report is certain to reopen debate about the Lancashire tremors, which on 1 April and 27 May 2011 shook the Blackpool area, registering 2.3 and 1.5 on the Richter Scale. On 2 November a report commissioned by Cuadrilla Resources, “The Geo-mechanical Study of Bowland Shale Seismicity,” acknowledged that hydraulic fracturing was responsible for the two tremors and possibly as many as fifty separate earth tremors overall, noting that it was “highly probable” that the hydraulic fracturing of its Preese Hall-1 well did trigger a number of “minor” seismic events.

At the time of the report’s release Cuadrilla Resources CEO Mark Miller said, “We unequivocally accept the findings of this independent report and are pleased that the report concludes that there is no threat to people or property in the local area from our operations. We are ready to put in place the early detection system that has been proposed in the report so that we can provide additional confidence and security to the local community. Cuadrilla Resources is working with the relevant local and national authorities to implement the report’s recommendations so we may safely resume our operations.”

The British Geological Survey also linked smaller quakes in the Blackpool area to fracking. BGS Dr. Brian Baptie said, “It seems quite likely that they are related,” noting, “We had a couple of instruments close to the site and they show that both events occurred near the site and at a shallow depth.”

While the DECC report confirms that Cuadrilla Resources ‘s test-fracking likely caused the 2011 two small tremors last year, it also said that Cuadrilla Resources could proceed with exploring the area if it follows a new set of expensive safety measures.

Cuadrilla Resources clearly sees the report as vindication, with Miller proclaiming, “We are pleased that the experts have come to a clear conclusion that it is safe to allow us to resume hydraulic fracturing, following the procedures outlined in the review. Many of today’s recommendations were contained in the original expert studies we published in November last year, and our supplementary information sent to DECC in January. We have already started to implement a number of the experts’ recommendations in the pursuit of best practice and look forward to the final decision by DECC ministers concerning the resumption of hydraulic fracturing following the six week period for public comment commencing on 17 April.”

And insurers in the City of London clearly believe that the DECC report validates fracking. City insurance brokerage Willis chief operating officer of global energy Neil Smith said, “Shale gas is here to stay… The issues are of a political nature and a lot are born out of ignorance of what the operations are.” Dominick Hoare of Watkins Syndicate at the Lloyd’s of London insurance market was equally bullish, saying, “With a proper assessment it’s a good risk to assume,” as was Matt Yeldham, the head of casualty at Aegis’ marine and offshore liability division, who commented, “Provided fracking is conducted in an appropriate fashion, it would appear on the whole to present a reasonable risk profile” before adding, “Underwriters are not there to cover long-term health hazard and other latent issues.”

It is precisely those “long-term health hazard and other latent issues” that should be at the top of the British government’s concerns, but Westminster has repeatedly proven that its interests more closely align with those investment bankers in the City of London than those forced to live with the consequences if the environmental nay-sayers ultimately prove correct about water pollution and “seismic events.”

Source: http://oilprice.com/Energy/Energy-General/UK-Govt.-Seismic-Fracking-Report-Certain-to-Sharpen-Debate.html

By. John C.K. Daly of Oilprice.com


Gold & Silver Flat as Traders Await “Hints” of QE from Fed, Data Signal Fresh QE Elsewhere

London Gold Market Report
from Adrian Ash
BullionVault
Weds 25 April, 08:55 EST

WHOLESALE MARKET gold prices reversed a short dip Wednesday lunchtime in London to trade absolutely flat on the day and unchanged from the end of last week ahead of the US Fed’s monetary policy statement.

Silver bullion prices held beneath $31 per ounce, and the Euro was also unchanged after a brief rally above $1.32.

US Treasury bond prices ticked lower, edging interest rates higher, while commodities and world stock markets rose but the British Pound slipped from 6-month highs on confirmation of the UK’s first “double dip” recession since the mid-1970s.

“Any suggestions of further [Quantitative Easing] could see gold prices move towards $1670,” says today’s commodities note from South Africa’s Standard Bank, looking ahead to today’s US Fed decision and press conference.

“If the statement is unchanged from the last meeting, we expect the physical market to buy dips towards $1600 – as it has done since beginning March.”

April’s range in Dollar gold prices has been its most narrow, says analysis by Reuters precious-metals reporters, since June last year – just before the metal added $400 per ounce to set all-time records above $1900, up more than 27% by the first week of September.

This week already, open interest in US gold futures has fallen to the lowest level of 2012 so far, and this month’s sales of Gold Eagle coins by the US Mint are set for the weakest April total in 5 years, according to Commerzbank.

April’s sales already lag February this year, the lowest monthly total for gold coin sales by the US Mint since June 2008, some 3 months before the collapse of Lehman Brothers sparked a surge in global gold investing demand.

Gold prices have been “heading down towards the 2008-12 uptrend line, now at $1606.96,” says the latest technical analysis from Axel Rudolph at Commerzbank in Luxembourg.

Also pointing to the uptrend starting with the collapse of Lehman Brothers, “The 3.5-year weekly trend line support is in at $1627,” says Russell Browne at Scotia Mocatta in New York.

“So we could a late week break below here as a fresh leg lower to $1538.”

“$1624 is a critical level,” counters  Phil Smith in Beijing for Reuters Technical, “and a break below would set up a decline back to $1520.”

Further ahead, however, “We expect gold prices to climb as subdued US growth reduces the market’s expectations of real [interest] rates,” says an update to Goldman Sachs’ commodities market advice today.

On the other side of the trade, and “with gold prices expected to continue to climb through 2012, we find hedging opportunities less attractive for gold mining producers at this time,” says Goldman, reversing its previous advice that miners look to defend the value of their future output by selling its forwards.

Most of what little gold producer hedging was seen last year appeared “to be related to specific gold mining projects,” said Philip Klapwijk, executive chairman of Thomson-Reutrs GFMS, at the London launch of the precious metal consultancy’s Gold 2012 Survey earlier this month.

“There seems little appetite for strategic hedging against a fall in gold prices,” he went on, after the industry spent the last decade unwinding the 3,000-tonne short position it had built up during the long bear market in gold ending 2001.

Looking again at today’s policy decision from the US Federal Reserve, “I don’t think they will announce the QE3, but Bernanke’s speech may offer some hints,” says one Hong Kong dealer quoted by Reuters.

“We don’t know, but we can see that other nations have already cut interest rates.”

With European Central Bank president Mario Draghi today attending the European Parliament’s Monetary Affairs Committee, “There is a very compelling case for further intervention from the ECB,” reckons Barbara Ridpath, chief executive officer of the bank-funded International Centre for Financial Regulation, speaking to Bloomberg.

“Many of these banks simply cannot refinance their maturing debt in the bond market.”

After the Bank of Japan issued ¥10 trillion ($123 billion) in new quantitative easing in February, all 14 economists surveyed by Bloomberg News this week “predict additional easing” when the central bank releases its latest inflation forecast this coming Friday, says the newswire.

As a result of the Yen rising again on the currency market, “Most expect an increase ranging from ¥5 to ¥10 trillion,” says Bloomberg.

Today’s UK data “support the view that the Bank of England will do a final £25 billion of quantitative easing in May,” reckons economist Philip Rush at Nomura in London.

Adrian Ash
BullionVault

Gold price chart, no delay   |   Buy gold online at live prices

Adrian Ash is head of research at BullionVault, the secure, low-cost gold and silver market for private investors online, where you can buy gold today vaulted in Zurich on $3 spreads and 0.8% dealing fees.

(c) BullionVault 2012

Please Note: This article is to inform your thinking, not lead it. Only you can decide the best place for your money, and any decision you make will put your money at risk. Information or data included here may have already been overtaken by events – and must be verified elsewhere – should you choose to act on it.


European Central Bank: “Great White Fear” Takes A Bite Out of Recovery

EWI’s Global Market Perspective foresaw the shift in European banks from lenders to savers via one remarkable chart

By Elliott Wave International

It’s been over two years since the European Central Bank began its open-heart surgery of the eurozone’s anemic economy. So far, the procedure has included an unprecedented $3 trillion-plus in bailouts, monetary transfusions, AND toxic debt transplants.

Yet, according to a recent slew of discomforting news reports, the economies across the pond would still flatline in seconds without constant life support. Here, an April 18, 2012, Wall Street Journal writes:

“Europe Hemorrhages through Refinancing Operation Band-Aid” and reveals that Europe’s banking sector has wolfed down three years of Long Term Refinancing Operations (LTROs) in under four months.

The question is — what went wrong?

Well, to answer this, we have to go back to the drawing board to mid-2010. It was then that the European Central Bank and company released the rescue-package Kraken via a $1 trillion bailout of Greece and a full-fledged initiation of its LTRO.

And, as the following May 10, 2010, news items make plain, this credit-reflating beast was set to tear Europe’s economic bear to shreds:

  • “This is shock-and-awe, part II, in 3D, with a much bigger budget and more impressive array of special effects. The EU package eliminates the danger that Greece’s debt woes will ricochet through Europe’s banks.” (USA Today)
  • “This is a truly overwhelming force and should be more than sufficient to stabilize markets, prevent panic and contain the risk of contagion.” (Bloomberg Businessweek)

In the July 2010 Global Market Perspective, however, our analysts foresaw a fatal flaw in the plan. The first part was fine: The European Central Bank (ECB) bought packages of debt and resold them to smaller banks at a historically low interest rate.

BUT the second part didn’t work out: Instead of rebundling those loans and passing them on to small businesses to stimulate investment, THOSE banks redeposited the funds with the ECB. Riffing off the famous “Jaws” quote (“We’re gonna need a bigger boat”), the July 2010 Global Market Perspective captured the great-white fear circling the lending sector via the following chart of commercial banks’ usage of the ECB’s Deposit Facility and wrote:

“The chart roughly indicates the degree to which banks fear for the insolvency of one another. Banks receive below-market interest rates on their ECB deposits, so they’re generally loathe to hold significant funds there. As anxiety grows, however, so do banks’ deposits in the Facility, mainly because their desire for adequate interest gives way to their more essential need to safeguard principal … Because the [economic downturn] is still young, deposits at the ECB will likely keep rising. Like stocks, the casual approach to banking that existed up until now is in for a massive shift.”

Flash two years ahead. The April 2012 Global Market Perspective’s updated chart below shows that usage of the ECB’s Deposit Facility has indeed risen, nay doubled, since the original forecast.

The question now is not whether monetary policy will save Europe’s economy, but whether the one precondition for recovery — confidence — will return to lenders.


What the European Debt Crisis Could Mean for YOUR InvestmentsThe European Debt Crisis is affecting investments across the globe. Gain a valuable perspective on the European debt crisis and get ahead of what is yet to come in this FREE club resource from Elliott Wave International.Read Your Free Report Now: The European Debt Crisis and Your Investments.

This article was syndicated by Elliott Wave International and was originally published under the headline European Central Bank: “Great White Fear” Takes A Bite Out of Recovery. EWI is the world’s largest market forecasting firm. Its staff of full-time analysts led by Chartered Market Technician Robert Prechter provides 24-hour-a-day market analysis to institutional and private investors around the world.


EUR Recovers Following Successful Debt Auction

Source: ForexYard

The euro staged a slight recovery against the US dollar yesterday, following a successful Dutch debt auction which calmed investor fears regarding the recent political turmoil in Holland. After tumbling over 100 pips earlier in the week, the EUR/USD was once again above the 1.3200 level during the afternoon session. Turning to today, traders will want to pay attention to US news, including the FOMC Statement, FOMC Economic Projections and FOMC Press Conference. Any mention of future quantitative easing measures could cause the US dollar to take losses during the second half of the week.

Economic News

USD – FOMC Economic Projections Could Lead to Market Volatility

The US dollar saw slight bearish movement yesterday, following positive euro-zone news that led to an increase in risk taking in the marketplace. The EUR/USD gained around 70 pips during the European session before stabilizing around the 1.3200 level. Against the Australian dollar, the greenback also lost around 75 pips for the day. The AUD/USD reached as high as 1.0320 during the afternoon session and eventually stabilized around 1.0300.

Turning to today, a batch of US data is forecasted to create volatility in the marketplace. The FOMC Statement, FOMC Economic Projections and FOMC Press Conference, schedule for 16:30, 18:00 and 18:15 GMT, may result in further dollar losses should they mention a new round of quantitative easing in the US. In addition, traders will also want to pay attention to the US Core Durable Goods Orders figure, scheduled for 12:30 GMT. Analysts are forecasting the figure to come in well below last month’s result. If true, the dollar could see losses against currencies like the Japanese yen and Swiss franc.

EUR – EUR Gains Viewed as Temporary

The euro reversed some of its losses from earlier in the week during yesterday’s trading session, as investors reacted positively to a Dutch debt auction. The news helped calm investor fears regarding the political situation in Holland. Earlier in the week, elections were called in the country after a failure to agree on a set of budget cuts. The euro gained 70 pips against the USD following the news, peaking at 1.3217 before staging a slight downward correction. Against the British pound, the euro was up over 40 pips. The EUR/GBP rose as high as 0.8185 during afternoon trading.

Turning to today, traders will want to continue monitoring developments out of the euro-zone, particularly with regards to the upcoming elections in France. The current President lost the first round of elections earlier this week. Any signs that the opposition could take control after the second round of voting on May 6th could result in the euro turning bearish. Furthermore, a batch of potentially significant US data is set to be released throughout the day. Any positive developments regarding the US economic recovery could result in the euro reversing yesterday’s gains.

Gold – Gold Benefits from Bearish Dollar

Gold steadily increased in value throughout yesterday’s trading session after a successful Dutch debt auction turned the USD bearish against the euro. Typically the price of gold becomes bullish when the dollar drops in value, as it makes the precious metal cheaper for international buyers. Gold reached as high as $1648.83 an ounce yesterday before moving downward and stabilizing at $1642.34. Overall, gold was up close to 850 pips for the day.

Turning to today, traders will want to keep an eye on US economic indicators scheduled to be released throughout the day. Any signs that US interest rates could be increased earlier than expected could result in significant gains for the dollar, which may cause gold to turn bearish. At the same time, should today’s news indicate that the Fed may initiate another round of quantitative easing in the coming months, the dollar could move further downward, in which case gold could extend yesterday’s upward trend.

Crude Oil – Positive Euro-Zone News Leads to Gains for Oil

A successful debt auction out of the Netherlands yesterday resulted in moderate risk taking in the marketplace, which in turn caused crude oil to increase in value. The price of crude was up just over $1 for the day, peaking at $104.08 a barrel before reversing. Eventually the price stabilized around the $103.75 level.

Turning to today, oil traders will want to pay close attention to the US Crude Oil Inventories figure at 14:30 GMT, followed by FOMC Statement at 16:30. Analysts are predicting that the inventories figure will come in at 2.7M, below last week’s result of 3.9M. If true, investors may take it as a sign of increased demand in the US, which could result in oil prices going up.

With regards to the FOMC Statement, any mention of another round of quantitative easing may lead to a drop in the value of the USD, which could also lead to an increase in the price of oil. That being said, should the statement discuss a future increase in US interest rates, oil prices may fall.

Technical News

EUR/USD

The daily chart’s Slow Stochastic appears to be forming a bearish cross, indicating that downward movement could occur in the near future. This theory is supported by the Williams Percent Range on the same chart which has crossed into overbought territory. Traders may want to go short in their positions.

GBP/USD

The weekly chart’s Williams Percent Range has crossed into overbought territory in a sign that this pair could see a bearish correction in the coming days. In another sign that downward movement may occur, the daily chart’s Relative Strength Index is moving up and may cross into the overbought region shortly. Traders may want to go short in their positions.

USD/JPY

Most long term technical indicators show this pair trading in neutral territory, meaning that no definitive trend is known at this time. That being said, the daily chart’s MACD/OsMA has formed a bullish cross. Traders will want to keep an eye on other indicators on this chart, as they may provide further clues as to a possible impending upward correction.

USD/CHF

A bullish cross on the daily chart’s Slow Stochastic appears to be forming, in a sign that upward movement could occur in the near future. In addition, the Williams Percent Range on the same chart is currently at -80, right on the border of being in oversold territory. Going long may be the preferred strategy for this pair.

The Wild Card

EUR/AUD

A bearish cross has formed on the daily chart’s Slow Stochastic, indicating that downward movement could occur in the near future. Furthermore, the Williams Percent Range on the same chart has crossed over into overbought territory. This may be a good opportunity for forex traders to open short positions ahead of a possible bearish correction.

Forex Market Analysis provided by ForexYard.

© 2006 by FxYard Ltd

Disclaimer: Trading Foreign Exchange carries a high level of risk and may not be suitable for all investors. There is a possibility that you could sustain a loss of all of your investment and therefore you should not invest money that you cannot afford to lose. You should be aware of all the risks associated with Foreign Exchange trading.


Yen Declines Versus Majors Ahead Of BoJ Meeting

Source: ForexYard

printprofile

The Japanese Yen traded down versus the majority of its currency counterparts ahead of speculation that officials from the Bank of Japan will add stimulus measures at a policy meeting expected to take place this week.

The Yen fell 0.1 percent versus the 17-nation euro to trade at 107.43 during the morning hours of the Asian trading session,after dropping 0.5 percent during yesterday’s trading.The Japanese currency also saw losses against the U.S Dollar and the British Pound.

The Australian Dollar also made gains over the Yen after the first case of Mad Cow Disease in six years boosted speculation that the demand for Australian beef will rise.

There a number of Yen-related reports due for release on Thursday which could affect the price movements of the currency. The reports include,Japanese Unemployment Rate,Tokyo Core CPI,Retail Sales as well as the Bank of Japan’s Interest Rate Decision.

Forex Market Analysis provided by ForexYard.

© 2006 by FxYard Ltd

Disclaimer: Trading Foreign Exchange carries a high level of risk and may not be suitable for all investors. There is a possibility that you could sustain a loss of all of your investment and therefore you should not invest money that you cannot afford to lose. You should be aware of all the risks associated with Foreign Exchange trading.

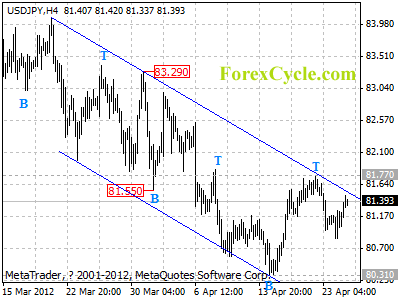
USDJPY stays in a downward price channel

USDJPY stays in a downward price channel on 4-hour chart, and remains in downtrend from 84.17, the price action from 80.31 is likely consolidation of the downtrend.. Now the fall from 81.77 would possibly be resumption of the downtrend, another fall to 79.50 area is possible over the next several days. Key resistance is now at 81.77, only break above this level will indicate that the fall from 84.17 had completed at 80.31 already, the further rise to 83.00 could be seen.

usdjpy

Daily Forex Analysis

Central Bank News Link List – 25 April 2012

By Central Bank News
Here's today's Central Bank News link list, click through if you missed the previous central bank news link list.  Remember, if you want to submit links for inclusion in the daily link list, just email them through to us or post them in the comments section below.

12% Compulsory Super – Get Ready for the Government’s Next Tax Grab

By MoneyMorning.com.au

The rule of unintended consequences is that something unforeseen happens as a result of doing something else.

A good example is the housing insulation scheme.  The idea behind the policy was that it would serve a dual purpose.  It would stimulate the economy and help the environment.

A political one-two if ever there was one.

But, in order to profit from the huge taxpayer-funded handout, companies had to get in quick.  The handout wouldn’t last forever.  If an insulation company took too long to get its act together, other companies would act, and so it could miss the government cash.

The unintended consequence was that companies cut corners.  Such as by not providing suitable training.  This even led to some under-qualified installers dying.  And when the government axed the insulation scheme, it left companies with a whole bunch of excess stock.

Well, it seems the government has knocked-in another own goal.  This time with changes to compulsory superannuation

Superannuation Isn’t “Magic Money”…

You’re probably aware that compulsory superannuation will rise in stages.  From 9% of your salary today, to 12% by 2020.

Most people think super money is magic money.  That it just appears from nowhere.  But most people don’t realise that a company allocates super money from its labour force budget.

So, if the government increases compulsory super, the company has to make a choice.  Does it reduce staff wages?  Cut staff numbers?  Or cut other costs – buy lower quality components, move to a premises with lower rent, and so on.

The easiest choice is to either cut wages or at the very least not increase wages by as much as they otherwise would.  This creates an unintended consequence for the government and its budget plans…

You see, the problem is the impact it has on government tax revenue.  Simply put, if you earn $80,000 and your boss gives you a $2,400 (3%) pay rise, the government will swipe $888 of that amount as tax.

But, if the government forces employers to pay that 3% pay rise as a super contribution, the tax taken by the government is only $360.

That’s because the government levies tax on super contributions at 15%.  Compared to the 37% rate for a wage earner on $80,000.

Of course, the above is an example.  The rise from 9% to 12% won’t happen in one go.  It will rise over the next seven years.  But the point remains the same.

By forcing bosses to pay more super to workers rather than giving them a pay rise, the government forgoes 15 cents in the dollar for every dollar that goes to superannuation rather than to the workers’ pocket.

As you can guess, that’s fine by us. We’d rather you get the money than the government (in fact, we say you should get to keep all your income and the government get nothing).

But it hasn’t taken the government long to realise it has shot itself in the foot.

…Superannuation is Captive Money

This news came out late last week in the Fairfax press:

“A senior [government] source confirmed yesterday reports that the billions in tax breaks that apply to superannuation contributions were squarely in the sights of the government’s razor gang as it strives to return the budget from a $40 billion-plus deficit to a surplus.”

The irony appears to be completely lost on the government.  It passes a law to force people to save more for retirement… but then slugs them with a tax bill.

But then, maybe it’s not an unintended consequence.  Maybe it’s part of the government’s grand plan to raise taxes.  Think about it this way…

There are far fewer ways to claim tax deductions within a super fund than outside.  And the money is captive.  You can’t touch it.

But maybe we give politicians too much credit for having brains.

The bottom line is, the attack continues by governments here and overseas on privately held wealth.  The question is, are you prepared to do anything about it?

We’re doing our part by bringing this to your attention.  And we even give you advice on ways to grow and protect your wealth.

The next step is for you to do something… to grow and protect your wealth.  If you haven’t already started, what are you waiting for?

Cheers.
Kris

P.S. One potential way to grow your wealth is by investing in small-cap stocks. In our job as editor of Australian Small-Cap Investigator, we spend our days looking at small-cap stocks. Our aim is to find the stocks that are most likely to give investors explosive returns. And right now, we’ve identified five Aussie small-cap stocks we believe could return up to 1,544% within the next two years. To find out the names of these stocks and what they do, click here…

The Conference of the Year “After America” DVD

Why You MUST Speculate

Disruptive Technology Stocks For Smart Small-Cap Investors


12% Compulsory Super – Get Ready for the Government’s Next Tax Grab